 E-submission
Articles
- Page Path
- HOME > J Pathol Transl Med > Volume 59(3); 2025 > Article
-
Original Article
Thoracic aortic calcification as a predictor of coronary artery disease: a systematic review and meta-analysis -
Hussein Nafakhi1
 , Alaa Salah Jumaah2, Akeel Abed Yasseen2
 -
Journal of Pathology and Translational Medicine 2025;59(3):161-170.
DOI: https://doi.org/10.4132/jptm.2025.03.05
Published online: April 30, 2025
1Department of Internal Medicine, Faculty of Medicine, University of Kufa, Kufa, Iraq
2Department of Pathology and Forensic Medicine, Faculty of Medicine, University of Kufa, Kufa, Iraq
- Corresponding Author Akeel Abed Yasseen, PhD Department of Pathology and Forensic Medicine, Faculty of Medicine, University of Kufa, Kufa, P.O. Box 21, Iraq Tel: +964-7811131586, Fax: E-mail: akeelyasseen@uokufa.edu.iq
© The Korean Society of Pathologists/The Korean Society for Cytopathology
This is an Open Access article distributed under the terms of the Creative Commons Attribution Non-Commercial License (http://creativecommons.org/licenses/by-nc/4.0) which permits unrestricted non-commercial use, distribution, and reproduction in any medium, provided the original work is properly cited.

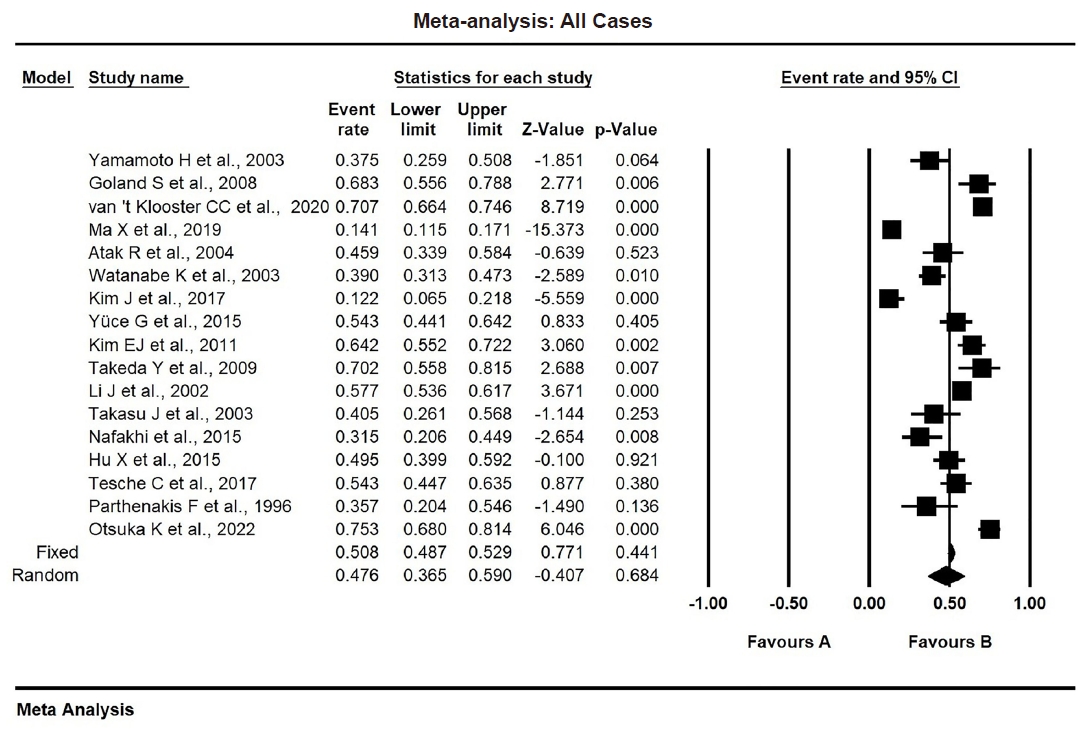
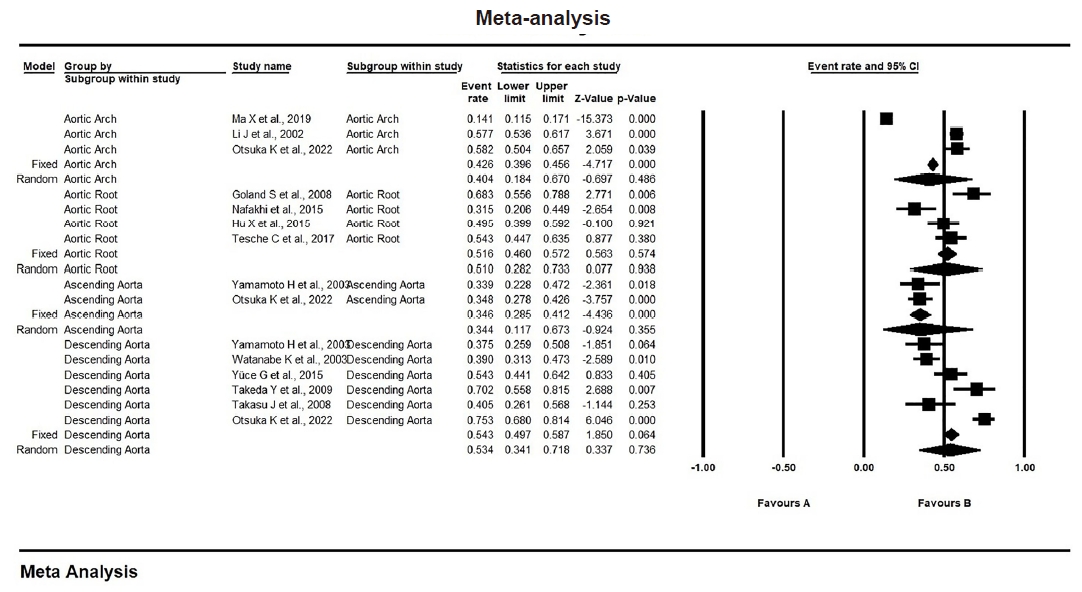

Figure & Data
References
Citations
- International Liver Transplantation Society/Liver Intensive Care Group of Europe guidelines for cardiovascular assessment before liver transplantation
Emmanuel Weiss, Gonzalo Crespo, Alexandra Anderson, Gianni Biancofiore, Ryan Chadha, Jacek B. Cywinski, Andrea De Gasperi, James Findlay, Marc Giménez-Milà, Constantine Karvellas, Michael Kaufman, Ashish Malik, Marina Moguilevitch, Sher-Lu Pai, Koen Reynt
American Journal of Transplantation.2026; 26(2): 219. CrossRef - Segmental thoracic aorta calcification in diabetic patients: Relationship with coronary atherosclerosis burden
Wasan Kadhum Abbas, Abdulameer A. Al-Mosawi, Ali M. Al-Shirazi, Hussein Nafakhi, Hayder Nafakhi
Journal of Diabetes & Metabolic Disorders.2026;[Epub] CrossRef
 PubReader
 ePub Link
-
 Cite this Article
- Cite this Article
-
- Close
- Download Citation
- Close
- Figure
-


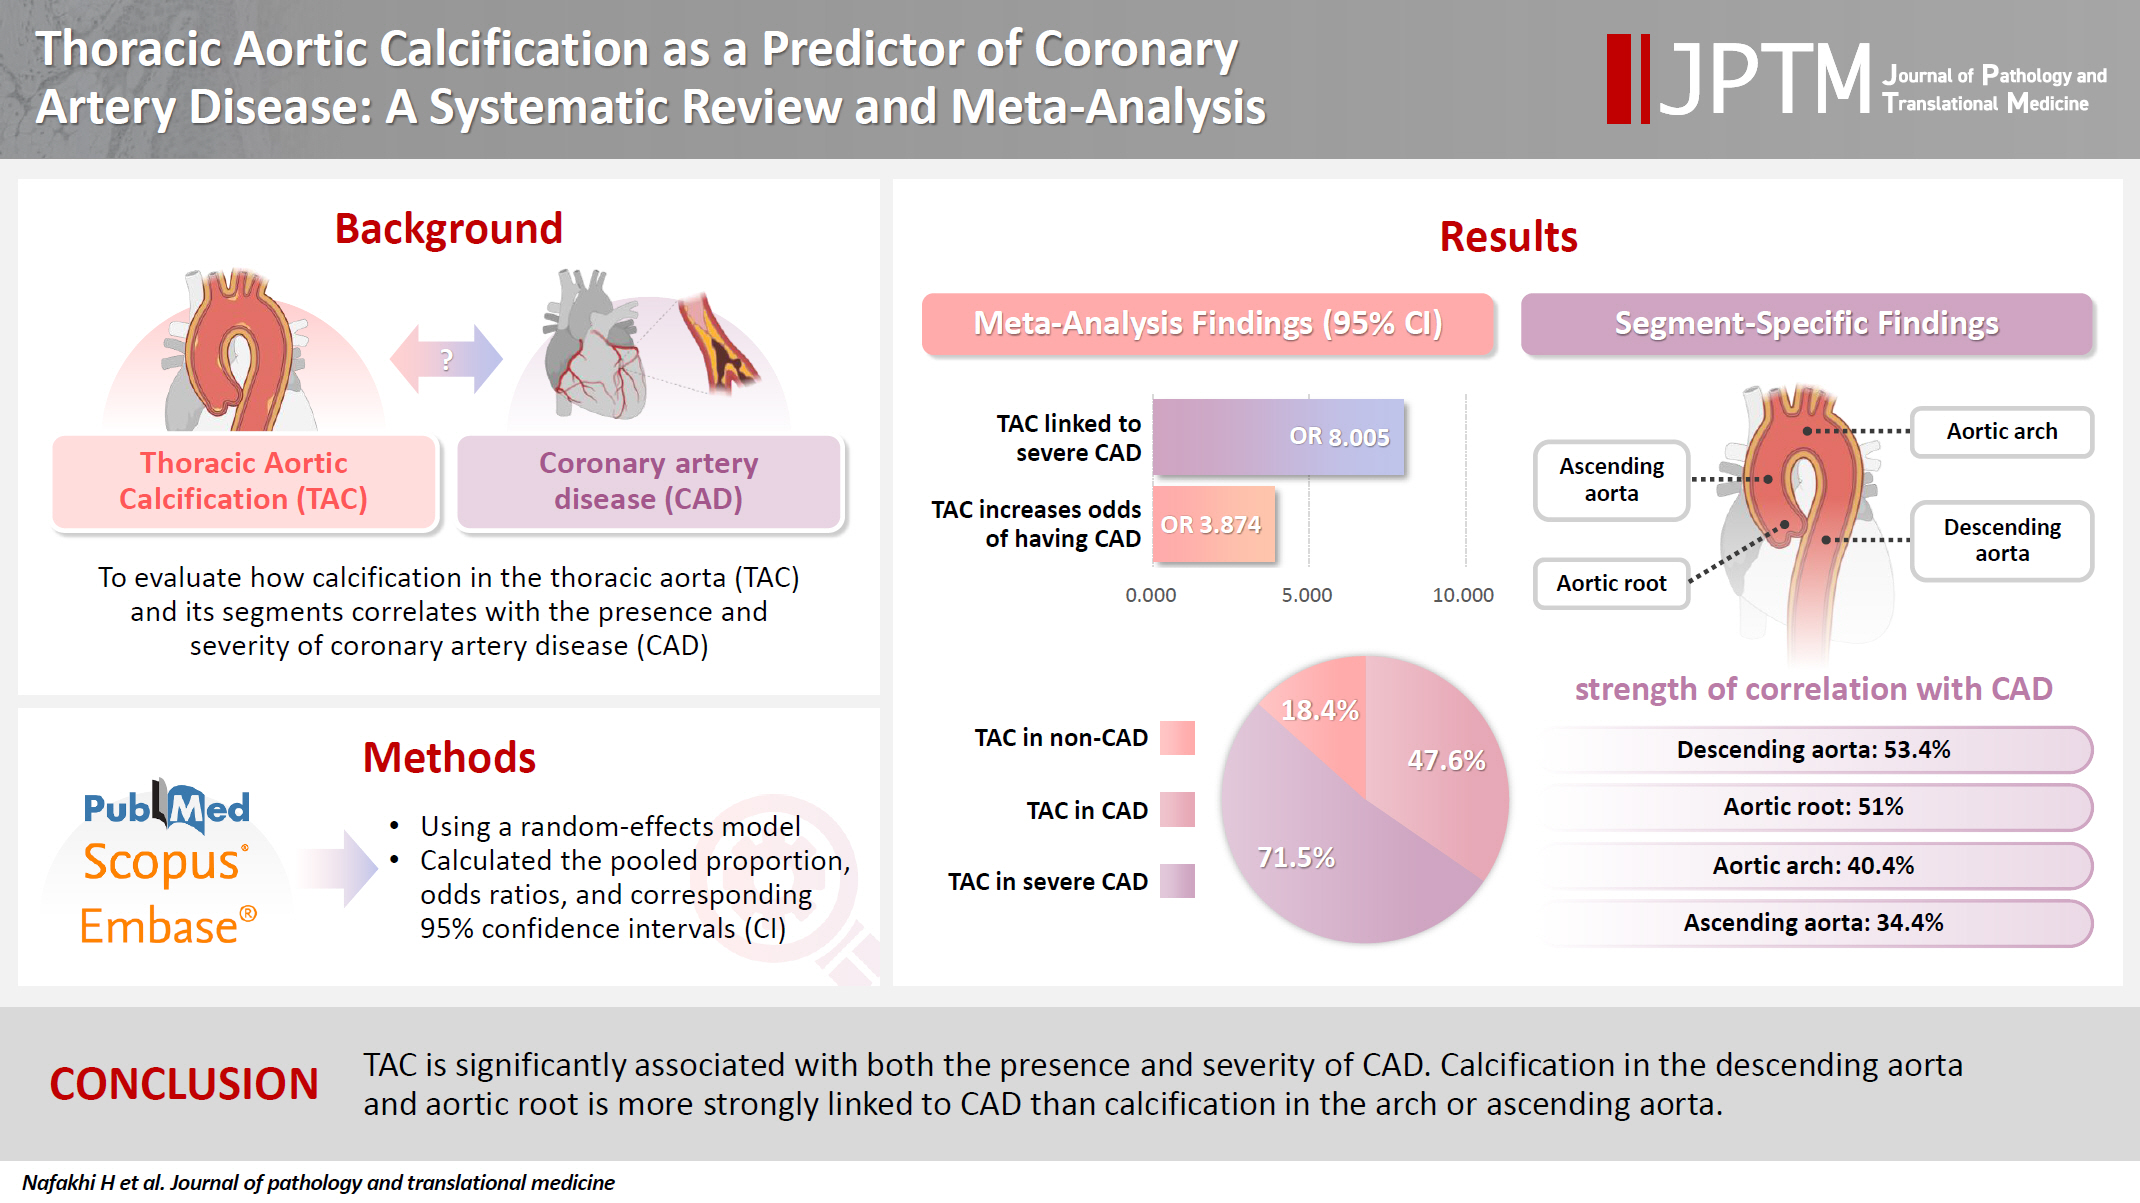


Fig. 1.
Fig. 2.
Fig. 3.
Graphical abstract
| Study | Study sample size (CAD) | TAC in CAD | TAC in CAD proportion | Study country | Method used for detection of TAC | Thoracic aorta site |
|---|---|---|---|---|---|---|
| Parthenakis et al. (1996) [31] | 28 | 10 | 0.357 | Greece | Echocardiography | TAC |
| Li et al. (2002) [16] | 570 | 329 | 0.577 | USA | Chest radiography | Arch |
| Yamamoto et al. (2003) [14] | 56 | 21 | 0.375 | USA | CT | TAC, ascending, descending |
| Takasu et al. (2003) [27] | 37 | 15 | 0.405 | USA | CT | Descending |
| Watanabe et al. (2003) [24] | 141 | 55 | 0.390 | Japan | CT | Descending |
| Atak et al. (2004) [23] | 61 | 28 | 0.459 | Turkey | Chest radiography | TAC |
| Goland et al. (2008) [22] | 60 | 41 | 0.683 | USA | Echocardiography | ARC |
| Takeda et al. (2009) [26] | 47 | 33 | 0.702 | Japan | CT | Descending |
| Kim et al. (2011) [5] | 120 | 77 | 0.642 | Soth Korea | CT | TAC |
| Yuce et al. (2015) [25] | 92 | 50 | 0.543 | Turkey | CT | Descending |
| Nafakhi et al. (2015) [28] | 54 | 17 | 0.315 | Iraq | CT | ARC |
| Hu et al. (2015) [29] | 101 | 50 | 0.495 | Germany | CT | ARC |
| Tesche et al. (2017) [30] | 105 | 57 | 0.543 | USA | CT | ARC |
| Kim et al. (2017) [6] | 74 | 9 | 0.122 | USA | CT | TAC |
| Ma et al. (2019) [17] | 597 | 84 | 0.141 | China | Chest radiography | Arch |
| van 't Klooster et al. (2020) [8] | 474 | 335 | 0.707 | Netherland | CT | TAC |
| Otsuka et al. (2022) [32] | 158 | 119 | 0.753 | Japan | CT | TAC |
| Variable | Pooled proportion (95% CI, %) | No. of studies | p-value | Heterogeneity testing | Publication bias (Egger's regression test) | Model | |||
|---|---|---|---|---|---|---|---|---|---|
| I2 | p-value | τ2 | Intercept (95% CI) | p-value | |||||
| TAC in CAD | 0.476 (0.365 to 0.590) | 17 | .684 | 96.36 | <.001 | 0.866 | –1.680 (–7.960 to 4.580) | .570 | Random effect |
| TAC in non-CAD | 0.184 (0.113 to 0.287) | 17 | <.001 | 96.818 | <.001 | 1.365 | 1.692 (–2.807 to 6.193) | .217 | Random effect |
| TAC in mild CAD | 0.251 (0.086 to 0.544) | 7 | .091 | 98.127 | <.001 | 2.826 | -4.372 (–22.151 to 13.405) | .277 | Random effect |
| TAC in severe CAD | 0.715 (0.287 to 0.940) | 7 | .325 | 98.439 | <.001 | 5.907 | 8.888(–2.444 to 20.221) | .049 | Random effect |
| Variable | Pooled odd ratio (95% CI) | No. of studies | p-value | heterogeneity | Publication bias (Egger's regression test) | Model | |||
|---|---|---|---|---|---|---|---|---|---|
| I2 | p-value | τ2 | Intercept (95% CI) | p-value | |||||
| TAC in CAD vs. TAC in non-CAD | 3.874 (2.789–5.381) | 17 | <.001 | 71.749 | <.001 | 0.323 | 1.590 (–1.966 to 5.147) | .177 | Random effects |
| TAC in severe CAD vs. TAC in mild CAD | 8.005 (2.611–24.542) | 7 | <.001 | 90.946 | <.001 | 1.9996 | –5.714 (–12.970 to 1.541) | .049 | Random effects |
CAD, coronary artery disease; TAC, thoracic aortic calcification; CT, computed tomography; ARC, aortic root calcification.
TAC, thoracic aortic calcification; CAD, coronary artery disease; CI, confidence interval.
TAC, thoracic aortic calcification; CAD, coronary artery disease; CI, confidence interval.

