 E-submission
Articles
- Page Path
- HOME > J Pathol Transl Med > Volume 54(6); 2020 > Article
-
Original Article
The frequency of POLE-mutation in endometrial carcinoma and prognostic implications: a systemic review and meta-analysis -
Alaa Salah Jumaah1
 , Mais Muhammed Salim1, Hawraa Sahib Al-Haddad2, Katherine Ann McAllister3, Akeel Abed Yasseen1
 -
Journal of Pathology and Translational Medicine 2020;54(6):471-479.
DOI: https://doi.org/10.4132/jptm.2020.07.23
Published online: September 2, 2020
1Department of Pathology and Forensic Medicine, Faculty of Medicine, University of Kufa, Kufa, Iraq
2Al-Furat Al-Awsat Hospital, Kufa, Iraq
3School of Biomedical Science, University of Ulster, Northern Ireland, UK
- Corresponding Author: Akeel Abed Yasseen, PhD, Department of Pathology and Forensic Medicine, Faculty of Medicine, University of Kufa, Kufa, P.O. Box 21, Najaf Governorate, Iraq Tel: +96-47811131586, E-mail: akeelyasseen@uokufa.edu.iq
© 2020 The Korean Society of Pathologists/The Korean Society for Cytopathology
This is an Open Access article distributed under the terms of the Creative Commons Attribution Non-Commercial License (http://creativecommons.org/licenses/by-nc/4.0) which permits unrestricted non-commercial use, distribution, and reproduction in any medium, provided the original work is properly cited.
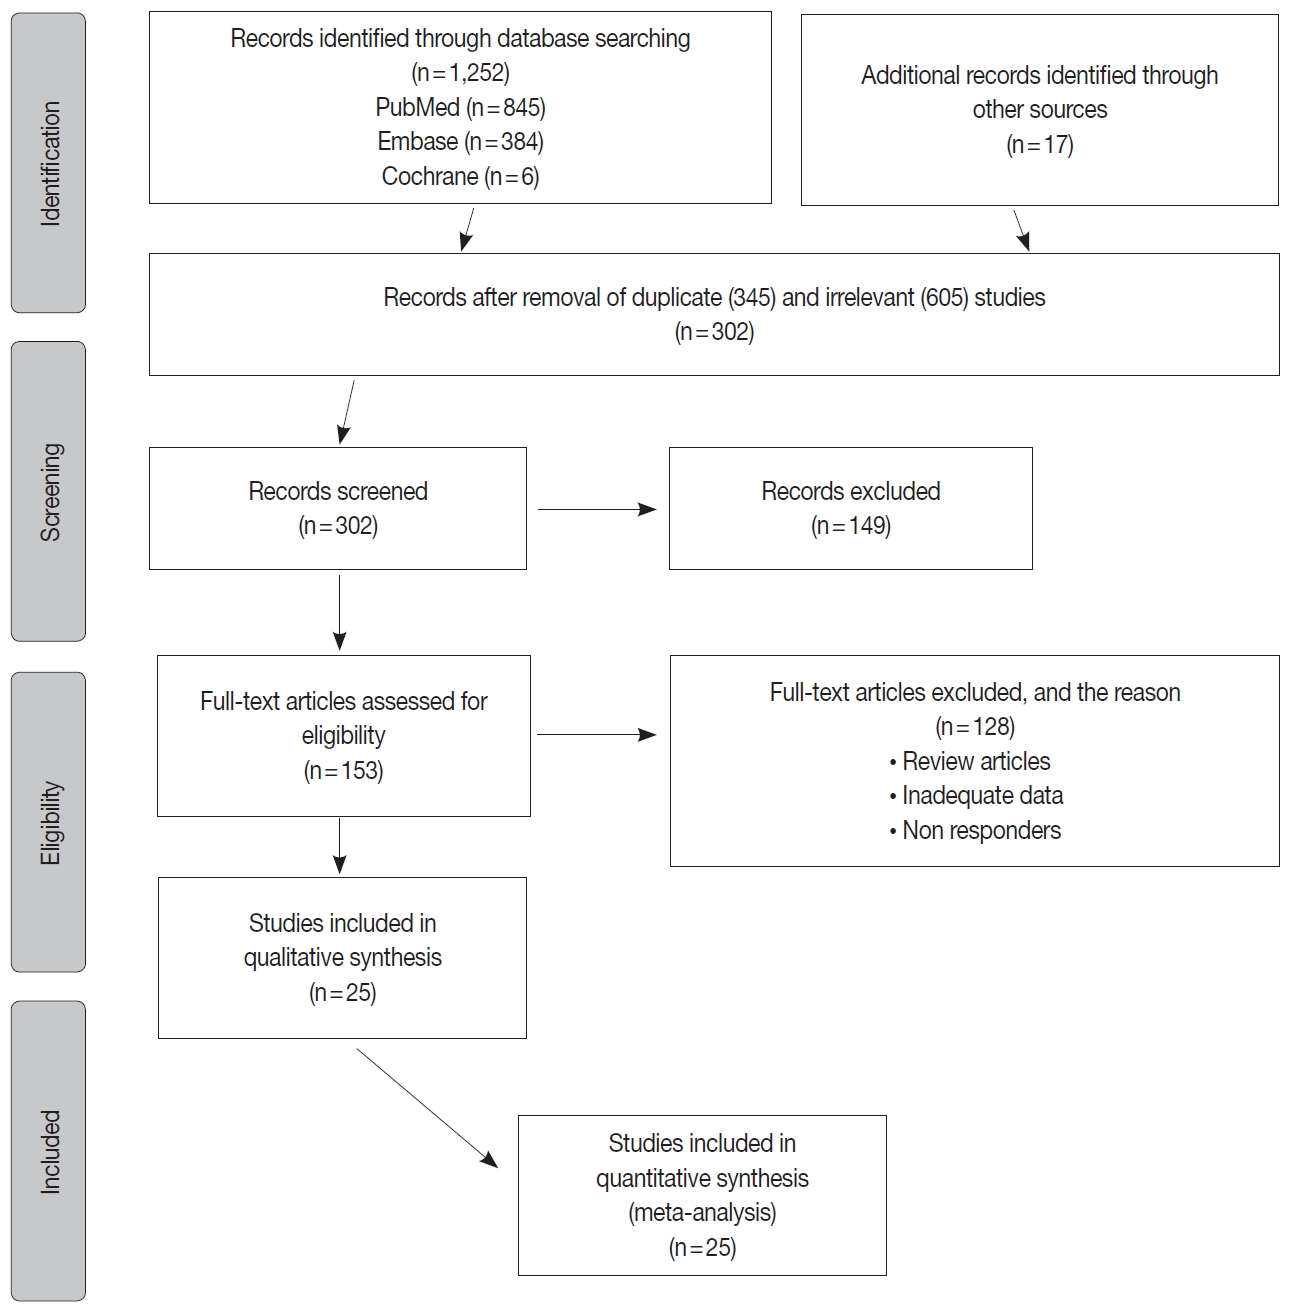

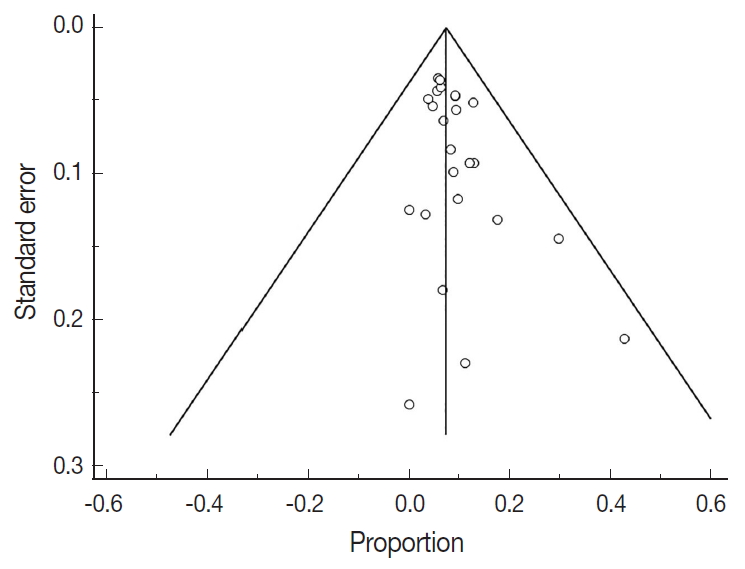
Figure & Data
References
Citations
- The relationship between histopathological data and molecular alterations with oncological outcomes in endometrioid-type endometrial cancers and a novel POLE mutation
Elif Aksahin, Fuat Demirkiran, Tugan Bese, Sukru Cebi, Abdullah Serdar Acikgoz, Basak Ozge Kayan, Yeliz Aykanat, Ismail Yilmaz, Ayse Namal, Sennur Ilvan, Omer Uysal, Macit Arvas
Journal of Gynecologic Oncology.2026;[Epub] CrossRef - Characterization of Korean Colorectal Cancer Reveals Novel Driver Gene and Clinically Relevant Mutations
Junho Kang, Dong Min Lim, Young‐Joon Kim, Hyeran Shim, Tae‐You Kim, Kyu Joo Park, Sung‐Bum Kang, Chang Sik Yu, Jong Lyul Lee, Yeuni Yu, Hansong Lee, Eun Jung Kwon, Hyo Min Kim, Seongik Mun, Donghee Kwak, Hae Seul Lee, Hye Jin Heo, Eun Kyoung Kim, Seung Eu
MedComm.2026;[Epub] CrossRef - CircRNA-miRNA-mRNA interactome analysis in endometrial cancer
Tikam Chand Dakal, Abhishek Kumar, Pawan Kumar Maurya
Journal of Biomolecular Structure and Dynamics.2025; 43(3): 1486. CrossRef - The prognostic implication of polymerase epsilon-mutated endometrial cancer
Kai-Hung Wang, Dah-Ching Ding
Tzu Chi Medical Journal.2025; 37(2): 135. CrossRef - Functions, interactions and prognostic role of POLE: a bioinformatics analysis
Jonathan Carvajal-Veloza, Fredy Galindo-Morales, Luz Dary Gutierrez-Castañeda
Journal of Gynecologic Oncology.2025;[Epub] CrossRef - Development of Antibody–Drug Conjugates for Malignancies of the Uterine Corpus: A Review
Taro Yamanaka, Tadaaki Nishikawa, Hiroshi Yoshida
Cells.2025; 14(5): 333. CrossRef - Efficacy of dostarlimab in recurrent or advanced mismatch Repair-Deficient endometrial Cancer as a Single-Agent therapy: A systematic review and Meta-Analysis
Ramazan Rezaei, Hedieh Haji Khodaverdi Khani
DARU Journal of Pharmaceutical Sciences.2025;[Epub] CrossRef - POLE-mutated endometrial cancer: new perspectives on the horizon?
Daniele Fanale, Lidia Rita Corsini, Paola Piraino, Erika Pedone, Chiara Brando, Tancredi Didier Bazan Russo, Pietro Ferraro, Alisia Simone, Silvia Contino, Ornella Prestifilippo, Ugo Randazzo, Ambra Giurintano, Carla Ferrante Bannera, Antonio Galvano, Lor
Frontiers in Oncology.2025;[Epub] CrossRef - Mismatch repair, p53, and L1 cell adhesion molecule status influence the response to chemotherapy in advanced and recurrent endometrial cancer
Jung Chul Kim, Byungsoo Ahn, Yong Jae Lee, Eun Ji Nam, Sang Wun Kim, Sunghoon Kim, Young Tae Kim, Eunhyang Park, Jung-Yun Lee
BMC Cancer.2024;[Epub] CrossRef - A single-institution retrospective exploratory analysis on the effectiveness and safety of lenvatinib plus pembrolizumab for advanced endometrial cancer: insights from ProMisE molecular classification system
Yohei Chiba, Masahiro Kagabu, Mitsumasa Osakabe, Rikako Ito, Sho Sato, Eriko Takatori, Yoshitaka Kaido, Takayuki Nagasawa, Tadahiro Shoji, Naoki Yanagawa, Tsukasa Baba
Japanese Journal of Clinical Oncology.2024; 54(4): 424. CrossRef - Potential of molecular classification to guide fertility-sparing management among young patients with endometrial cancer
Nuria Agusti, Alexa Kanbergs, Roni Nitecki
Gynecologic Oncology.2024; 185: 121. CrossRef - Assessing the New 2020 ESGO/ESTRO/ESP Endometrial Cancer Risk Molecular Categorization System for Predicting Survival and Recurrence
Yung-Taek Ouh, Yoonji Oh, Jinwon Joo, Joo Hyun Woo, Hye Jin Han, Hyun Woong Cho, Jae Kwan Lee, Yikyeong Chun, Myoung-nam Lim, Jin Hwa Hong
Cancers.2024; 16(5): 965. CrossRef - The Clinical and Pathological Characteristics of POLE-Mutated Endometrial Cancer: A Comprehensive Review
Xiaohong Yao, Min Feng, Wei Wang
Cancer Management and Research.2024; Volume 16: 117. CrossRef - National Survey of Current Follow-up Protocols for Patients Treated for Endometrial Cancer in the UK
H. Patel, K. Drinkwater, A. Stewart
Clinical Oncology.2024; 36(6): e146. CrossRef - Nab-Paclitaxel-Based Systemic Approach to Achieving Complete Remission for Relapsed Stage III Endometrial Carcinoma: Insights From the Indian Subcontinent
Prasanna Rammohan, Vipulkumar Thummar, Priya Mehta
Cureus.2024;[Epub] CrossRef - High prevalence of “non‐pathogenic” POLE mutation with poor prognosis in a cohort of endometrial cancer from South India
Santhosh Kuriakose, Dhananjayan Dhanasooraj, P. M. Shiny, S. Shammy, V. P. Sona, Anupama A. Manjula, Amrutha Ramachandran, Bindu Vijaykumar, Nayana Susan, M. Dinesan, Uma V. Sankar, Kavitha Ramachandran, P. S. Sreedharan
International Journal of Gynecology & Obstetrics.2024; 166(3): 1263. CrossRef - Patterns and Frequency of Pathogenic Germline Mutations among Patients with Newly-Diagnosed Endometrial Cancer: The Jordanian Exploratory Cancer Genetics (Jo-ECAG) Endometrial Study
Hikmat Abdel-Razeq, Hira Bani Hani, Baha Sharaf, Faris Tamimi, Hanan Khalil, Areej Abu Sheikha, Mais Alkyam, Sarah Abdel-Razeq, Tala Ghatasheh, Tala Radaideh, Suhaib Khater
Cancers.2024; 16(14): 2543. CrossRef - Accelerated clinical response achieved by combining short-term tumor-directed photodynamic therapy with immunotherapy-based systemic therapies in synchronous colorectal cancer with MSI-H and POLE mutation: a case report
Yuhan Wang, Lei Gao, Bin Ma, Jianming Shi, Zhenyu Yin, Weidong Zhu, Hao Chen
Frontiers in Immunology.2024;[Epub] CrossRef - Morphomolecular Correlation and Clinicopathologic Analysis in Endometrial Carcinoma
Göksenil Bülbül, Tekincan Çağri Aktaş, Anil Aysal Ağalar, Safiye Aktaş, Sefa Kurt, Bahadir Saatli, Emine Çağnur Ulukuş
International Journal of Gynecological Pathology.2024; 43(6): 535. CrossRef - Prognostic implications of immunohistochemistry in patients with endometrial cancer
Maria-Bianca Anca-Stanciu, Andrei Manu , Maria Victoria Olinca , Bogdan Cătălin Coroleucă , Diana-Elena Comandaşu , Ciprian Andrei Coroleucă , Călina Maier , Elvira Brătilă
Romanian Journal of Morphology and Embryology.2024; 65(2): 185. CrossRef - Translating biological insights into improved management of endometrial cancer
Jeffrey A. How, Amir A. Jazaeri, Shannon N. Westin, Barrett C. Lawson, Ann H. Klopp, Pamela T. Soliman, Karen H. Lu
Nature Reviews Clinical Oncology.2024; 21(11): 781. CrossRef - Fast and reliable Sanger POLE sequencing protocol in FFPE tissues of endometrial cancer
Izabela Laczmanska, Dagmara Michalowska, Marcin Jedryka, Dorota Blomka, Mariola Semeniuk, Ewelina Czykalko, Mariola Abrahamowska, Paulina Mlynarczykowska, Agnieszka Chrusciel, Ireneusz Pawlak, Adam Maciejczyk
Pathology - Research and Practice.2023; 242: 154315. CrossRef - Uterine Neoplasms, Version 1.2023, NCCN Clinical Practice Guidelines in Oncology
Nadeem Abu-Rustum, Catheryn Yashar, Rebecca Arend, Emma Barber, Kristin Bradley, Rebecca Brooks, Susana M. Campos, Junzo Chino, Hye Sook Chon, Christina Chu, Marta Ann Crispens, Shari Damast, Christine M. Fisher, Peter Frederick, David K. Gaffney, Robert
Journal of the National Comprehensive Cancer Network.2023; 21(2): 181. CrossRef - The hereditary N363K POLE exonuclease mutant extends PPAP tumor spectrum to glioblastomas by causing DNA damage and aneuploidy in addition to increased mismatch mutagenicity
Guillaume Labrousse, Pierre Vande Perre, Genis Parra, Marion Jaffrelot, Laura Leroy, Frederic Chibon, Frederic Escudie, Janick Selves, Jean-Sebastien Hoffmann, Rosine Guimbaud, Malik Lutzmann
NAR Cancer.2023;[Epub] CrossRef - New boundaries for fertility sparing management in endometrial cancer
Alexandros Rodolakis, Vasilis Pergialiotis, Nikolaos Thomakos
Current Opinion in Oncology.2023; 35(5): 394. CrossRef - PD-1 and PD-L1 Blockade plus Chemotherapy in Endometrial Cancer
New England Journal of Medicine.2023; 389(9): 866. CrossRef - The Shifting Landscape of p53abn Endometrial Cancers: A Review of the Prognostic and Predictive Impact and Current Therapeutic Directions
Angelo Anater
Journal of Medical and Radiation Oncology.2023; 3(2): 1. CrossRef - The Advantages of Next-Generation Sequencing Molecular Classification in Endometrial Cancer Diagnosis
Daniela Rivera, Michele Paudice, Giulia Accorsi, Floriana Valentino, Marta Ingaliso, Ada Pianezzi, Paola Roggieri, Lucia Trevisan, Giulia Buzzatti, Serafina Mammoliti, Fabio Barra, Simone Ferrero, Gabriella Cirmena, Viviana Gismondi, Valerio Gaetano Vello
Journal of Clinical Medicine.2023; 12(23): 7236. CrossRef - The clinicopathology and survival characteristics of patients with POLE proofreading mutations in endometrial carcinoma: A systematic review and meta-analysis
Alaa Salah Jumaah, Hawraa Sahib Al-Haddad, Katherine Ann McAllister, Akeel Abed Yasseen, Manish S. Patankar
PLOS ONE.2022; 17(2): e0263585. CrossRef - Enhanced polymerase activity permits efficient synthesis by cancer-associated DNA polymerase ϵ variants at low dNTP levels
Stephanie R Barbari, Annette K Beach, Joel G Markgren, Vimal Parkash, Elizabeth A Moore, Erik Johansson, Polina V Shcherbakova
Nucleic Acids Research.2022; 50(14): 8023. CrossRef - The Role of Immunohistochemistry Markers in Endometrial Cancer with Mismatch Repair Deficiency: A Systematic Review
Amelia Favier, Justine Varinot, Catherine Uzan, Alex Duval, Isabelle Brocheriou, Geoffroy Canlorbe
Cancers.2022; 14(15): 3783. CrossRef - The clinicopathological characteristics of POLE-mutated/ultramutated endometrial carcinoma and prognostic value of POLE status: a meta-analysis based on 49 articles incorporating 12,120 patients
Qing Wu, Nianhai Zhang, Xianhe Xie
BMC Cancer.2022;[Epub] CrossRef - Mismatch repair deficiency and clinicopathological characteristics in endometrial carcinoma: a systematic review and meta-analysis
Alaa Salah Jumaah, Hawraa Sahib Al-Haddad, Mais Muhammed Salem, Katherine Ann McAllister, Akeel Abed Yasseen
Journal of Pathology and Translational Medicine.2021; 55(3): 202. CrossRef - Evaluation of treatment effects in patients with endometrial cancer and POLE mutations: An individual patient data meta‐analysis
Jessica N. McAlpine, Derek S. Chiu, Remi A. Nout, David N. Church, Pascal Schmidt, Stephanie Lam, Samuel Leung, Stefania Bellone, Adele Wong, Sara Y. Brucker, Cheng Han Lee, Blaise A. Clarke, David G. Huntsman, Marcus Q. Bernardini, Joanne Ngeow, Alessand
Cancer.2021; 127(14): 2409. CrossRef - Endometrial cancer
Vicky Makker, Helen MacKay, Isabelle Ray-Coquard, Douglas A. Levine, Shannon N. Westin, Daisuke Aoki, Ana Oaknin
Nature Reviews Disease Primers.2021;[Epub] CrossRef
 PubReader
 ePub Link
-
 Cite this Article
- Cite this Article
-
- Close
- Download Citation
- Close
- Figure
-

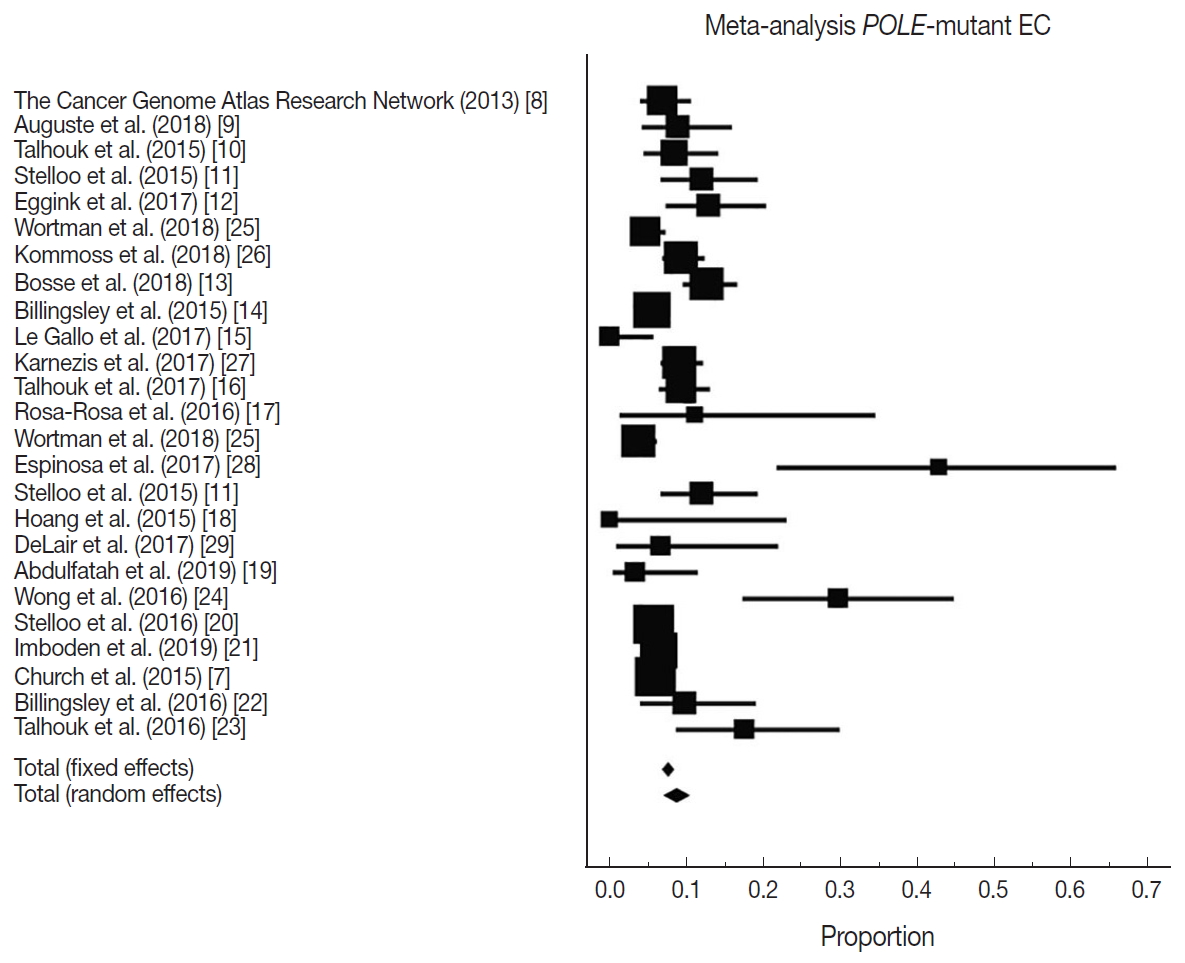


Fig. 1.
Fig. 2.
Fig. 3.
| Study | EC cohort size | Proportion POLE-mutant | Country | Sequencing method | Location of exonuclease mutations |
|---|---|---|---|---|---|
| The Cancer Genome Atlas Research Network (2013) [8] | 248 | 17 | USA | Exome sequencing | Hotspots: Pro286Arg and Val411Leu |
| Auguste et al. (2018) [9] | 102 | 9 | Canada and Europe | Sanger sequencing | Exons 9 and 13 |
| Talhouk et al. (2015) [10] | 143 | 12 | Canada | Fluidigm-MiSeq and sanger sequencing | Exons 9–14 |
| Stelloo et al. (2015) [11] | 116 | 14 | Europe and Australia | Sanger sequencing | Exons 9 and 13 |
| Eggink et al. (2017) [12] | 116 | 15 | Europe and Australia | Sanger sequencing | Exons 9, 13 and 14 |
| Wortman et al. (2018) [25] | 344 | 16 | Netherlands | Sequencing | Not reported |
| Kommoss et al. (2018) [26] | 452 | 42 | Germany | Sequencing | Exons 9–14 |
| Bosse et al. (2018) [13] | 376 | 48 | USA, Canada, and Europe | Sanger or next-generation approaches | Hotspots in the exonuclease domain (exons 9–14) |
| Billingsley et al. (2015) [14] | 535 | 30 | USA | Sanger sequencing | Residues 268–471 |
| Le Gallo et al. (2017) [15] | 63 | 0 | USA and Europe | Sanger sequencing | Not reported |
| Karnezis et al. (2017) [27] | 460 | 42 | Canada | Sequencing | Not reported |
| Talhouk et al. (2017) [16] | 319 | 30 | Canada | Sanger sequencing | Exons 9–14 |
| Rosa-Rosa et al. (2016) [17] | 18 | 2 | USA and Europe | Sanger sequencing | Exons 9 and 13 |
| Wortman et al. (2018) [25] | 416 | 16 | Netherlands | Sequencing | Not reported |
| Espinosa et al. (2017) [28] | 21 | 9 | Spain | Sequencing | Exons 9 to 14 |
| Stelloo et al. (2015) [11] | 116 | 14 | Europe | Sanger sequencing | Exons 9 and 13 |
| Hoang et al. (2015) [18] | 14 | 0 | Canada | Sanger sequencing | Exons 9–14 |
| DeLair et al. (2017) [29] | 30 | 2 | USA | Sequencing | Exons 9–14 |
| Abdulfatah et al. (2019) [19] | 60 | 2 | USA | Sanger sequencing | Exons 9 and 13 |
| Wong et al. (2016) [24] | 47 | 14 | Singapore | Next generation sequencing | Exons 9–14 |
| Stelloo et al. (2016) [20] | 834 | 49 | Netherlands | Sanger sequencing | Exons 9 and 13 |
| Imboden et al. (2019) [21] | 599 | 38 | Sweden | Sanger sequencing | Exons 9–14 |
| Church et al. (2015) [7] | 788 | 48 | Europe | Sanger sequencing | Exons 9 and 13 |
| Billingsley et al. (2016) [22] | 72 | 7 | USA | Sanger sequencing | Residues 268–471 |
| Talhouk et al. (2016) [23] | 57 | 10 | USA and Canada | Ultra-deep MiSeq or sanger sequencing | Exons 9–14 |
| Clinicopathological characteristics in EC | Pooled % portion (95% CI, %) | No. of studies | I2 (95% CI) | p-value | Model |
|---|---|---|---|---|---|
| Overall POLE mutation | 8.59 (7.01–10.32) | 25 | 78.10 (68.15–84.94) | < .001 | Random effect |
| POLE mutation in type I | 8.22 (6.27–10.42) | 9 | 74.88 (51.43–87.00) | < .001 | Random effect |
| POLE mutation in type II | 0.93 (0.34–1.81) | 10 | 75.32 (54.08–86.74) | < .001 | Random effect |
| Stage I–II | 89.51 (81.11–95.66) | 10 | 69.09 (40.43–83.96) | < .001 | Random effect |
| Stage III–IV | 14.77 (5.99–26.59) | 7 | 65.96 (23.79–84.79) | < .001 | Random effect |
| Grade I–II | 46.36 (30.66–62.43) | 7 | 82.15 (64.34–91.06) | < .001 | Random effect |
| Grade III | 51.53 (36.08–66.84) | 8 | 81.79 (65.23–90.46) | < .001 | Random effect |
| Lymphovascular invasion | 31.11 (10.44–56.86) | 8 | 93.34 (89.15–95.91) | < .001 | Random effect |
| Myometrial invasion less than 50% | 49.90 (43.71–56.21) | 7 | 22.10 (0.00–65.16) | 0.260 | Fixed effect |
| Clinicopathology: POLE-mutant vs. wild type | Pooled odd ratio (95% CI) | No. of studies | I2 (95% CI, %) | p-value for I2 | Model |
|---|---|---|---|---|---|
| Stage I–II EC | 3.727 (2.063–6.732) | 8 | 0.00 (0.00–25.07) | .890 | Fixed effect |
| Stage III–IV EC | 0.269 (0.147–0.494) | 7 | 0.00 (0.00–53.51) | .716 | Fixed effect |
| Grade I–II EC | 0.400 (0.295–0.542) | 8 | 3.95 (0.00–69.18) | .399 | Fixed effect |
| Grade III EC | 2.246 (1.655–3.048) | 8 | 0.00 (0.00–29.91) | .865 | Fixed effect |
| LVI | 0.929 (0.643–1.341) | 8 | 6.95 (0.00–70.15) | .376 | Fixed effect |
| MI less than 50% | 1.481 (0.996–2.202) | 6 | 47.63 (0.00–79.24) | .089 | Random effect |
| Type I endometrioid histology | 1.721 (1.113–2.662) | 9 | 0.00 (0.00–68.45) | .486 | Fixed effect |
| Study | OS estimated HR (95% CI) | DSS estimated HR (95% CI) | PFS estimated HR (95% CI) | Survival analysis test | Method |
|---|---|---|---|---|---|
| Talhouk et al. (2017) [16] | 1.01 (0.29–3.42) | 0.42 (0.30–0.57) | - | Multivariable analysis | Kaplan-Meier survival analysis |
| Talhouk et al. (2015) [10] | 0.17 (0.01–1.98) | 0.170 (0.01–1.99) | - | Multivariable analysis | Kaplan-Meier with log-rank significance testing and Cox proportional hazard regression models |
| Church et al. (2015) [7] | 1.06 (0.58–1.91) | 0.19 (0.02–1.31) | - | Multivariable analysis | Kaplan-Meier method and compared by the log-rank test |
| Karnezis et al. (2017) [27] | 0.59 (0.21–1.60) | 0.49 (0.12–1.90) | 0.26 (0.04–1.49) | Univariable survival analysis | Kaplan-Meier survival curve |
| Stelloo et al. (2016) [20] | 1.10 (0.39–3.10) | Multivariable analysis | Kaplan-Meier survival analysis | ||
| Bosse et al. (2018) [13] | 0.23 (0.06–0.76) | Multivariable analysis | Kaplan-Meier survival curve | ||
| Pooled HR (95% CI) | 0.90 (0.59–1.38) | 0.41 (0.30–0.55) | 0.23 (0.08–0.64) | ||
| I2 (95% CI, %) | 0.00 (0.00–73.28) | 0.00 (0.00–67.34) | 0.00 (0.00–0.00) |

