 E-submission
Articles
- Page Path
- HOME > J Pathol Transl Med > Volume 46(3); 2012 > Article
-
Original Article
Cyclooxygenase-2 Expression and Its Prognostic Significance in Clear Cell Renal Cell Carcinoma - Ji Won Lee1, Jeong Hwan Park2, Ja Hee Suh2, Kyung Han Nam2, Ji-Young Choe2, Hae Yoen Jung2, Ji Yoen Chae2, Kyung Chul Moon2,3
-
Korean Journal of Pathology 2012;46(3):237-245.
DOI: https://doi.org/10.4132/KoreanJPathol.2012.46.3.237
Published online: June 22, 2012
1Department of Pediatrics, Medical Research Center, Seoul National University College of Medicine, Seoul, Korea.
2Department of Pathology, Medical Research Center, Seoul National University College of Medicine, Seoul, Korea.
3Kidney Research Institute, Medical Research Center, Seoul National University College of Medicine, Seoul, Korea.
- Corresponding Author: Kyung Chul Moon, M.D. Department of Pathology and Kidney Research Institute, Medical Research Center, Seoul National University College of Medicine, 103 Daehak-ro, Jongno-gu, Seoul 110-799, Korea. Tel: +82-2-2072-1767, Fax: +82-2-743-5530, blue7270@snu.ac.kr
© 2012 The Korean Society of Pathologists/The Korean Society for Cytopathology
This is an Open Access article distributed under the terms of the Creative Commons Attribution Non-Commercial License (http://creativecommons.org/licenses/by-nc/3.0) which permits unrestricted non-commercial use, distribution, and reproduction in any medium, provided the original work is properly cited.


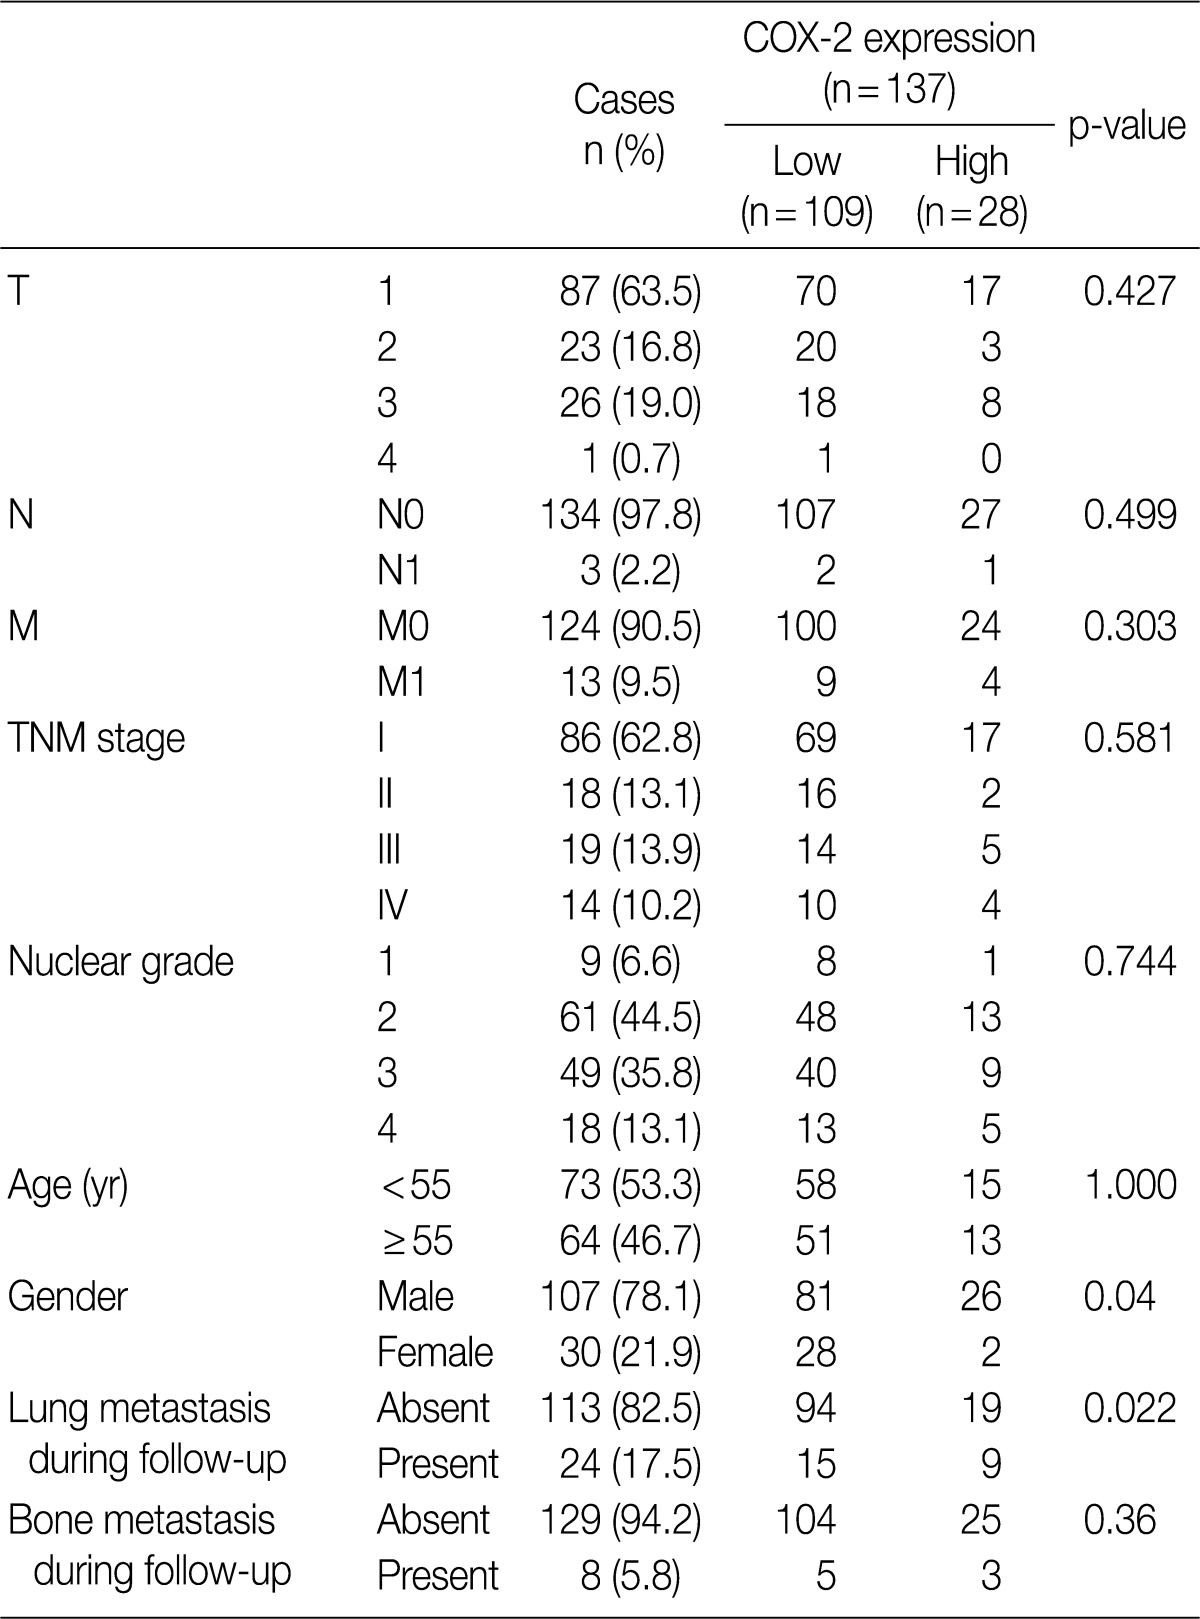

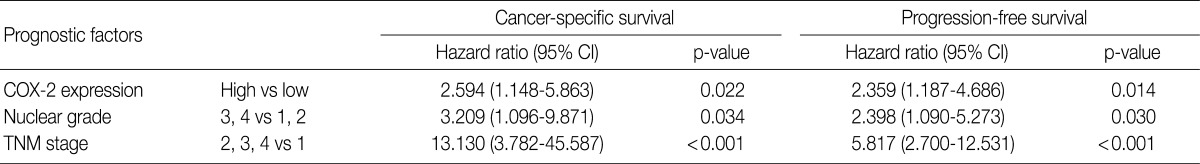
Figure & Data
References
Citations
- Arachidonic acid metabolism as a therapeutic target in AKI-to-CKD transition
Xiao-Jun Li, Ping Suo, Yan-Ni Wang, Liang Zou, Xiao-Li Nie, Ying-Yong Zhao, Hua Miao
Frontiers in Pharmacology.2024;[Epub] CrossRef - The tumor microenvironment and immune targeting therapy in pediatric renal tumors
Amy B. Hont, Benoit Dumont, Kathryn S. Sutton, John Anderson, Alex Kentsis, Jarno Drost, Andrew L. Hong, Arnauld Verschuur
Pediatric Blood & Cancer.2023;[Epub] CrossRef - Free-fatty acid receptor-1 (FFA1/GPR40) promotes papillary RCC proliferation and tumor growth via Src/PI3K/AKT/NF-κB but suppresses migration by inhibition of EGFR, ERK1/2, STAT3 and EMT
Priyanka F. Karmokar, Nader H. Moniri
Cancer Cell International.2023;[Epub] CrossRef - Flavonoids derived from Anemarrhenae Rhizoma ameliorate inflammation of benign prostatic hyperplasia via modulating COX/LOX pathways
Xiaotong Cao, Ying Shang, Weigui Kong, Shuqing Jiang, Jun Liao, Ronghua Dai
Journal of Ethnopharmacology.2022; 284: 114740. CrossRef - Kirenol, darutoside and hesperidin contribute to the anti-inflammatory and analgesic activities of Siegesbeckia pubescens makino by inhibiting COX-2 expression and inflammatory cell infiltration
Yu-Sang Li, Jian Zhang, Gui-Hua Tian, Hong-Cai Shang, He-Bin Tang
Journal of Ethnopharmacology.2021; 268: 113547. CrossRef - Differential expression of cyclooxygenase-2 and cyclin D1 in salivary gland tumors
Jefferson da Rocha Tenório, Leorik Pereira da Silva, Marília Gabriela de Aguiar Xavier, Thalita Santana, George João Ferreira do Nascimento, Ana Paula Veras Sobral
European Archives of Oto-Rhino-Laryngology.2018; 275(9): 2341. CrossRef - Retrospective evaluation ofCOX‐2 expression, histological and clinical factors as prognostic indicators in dogs with renal cell carcinomas undergoing nephrectomy
S. Carvalho, A. L. Stoll, S. L. Priestnall, A. Suarez‐Bonnet, K. Rassnick, S. Lynch, I. Schoepper, G. Romanelli, P. Buracco, M. Atherton, E. M. de Merlo, A. Lara‐Garcia
Veterinary and Comparative Oncology.2017; 15(4): 1280. CrossRef - Functional PTGS2 polymorphism-based models as novel predictive markers in metastatic renal cell carcinoma patients receiving first-line sunitinib
Arancha Cebrián, Teresa Gómez del Pulgar, María José Méndez-Vidal, María Luisa Gonzálvez, Nuria Lainez, Daniel Castellano, Iciar García-Carbonero, Emilio Esteban, Maria Isabel Sáez, Rosa Villatoro, Cristina Suárez, Alfredo Carrato, Javier Munárriz-Ferránd
Scientific Reports.2017;[Epub] CrossRef - COX-2 expression in ovarian cancer: an updated meta-analysis
Haiming Sun, Xuelong Zhang, Donglin Sun, Xueyuan Jia, Lidan Xu, Yuandong Qiao, Yan Jin
Oncotarget.2017; 8(50): 88152. CrossRef - COX-2 Expression in Renal Cell Carcinoma and Correlations with Tumor Grade, Stage and Patient Prognosis
Hedieh Moradi Tabriz, Marzieh Mirzaalizadeh, Shahram Gooran, Farzaneh Niki, Maryam Jabri
Asian Pacific Journal of Cancer Prevention.2016; 17(2): 535. CrossRef - Lipidomic Signatures and Associated Transcriptomic Profiles of Clear Cell Renal Cell Carcinoma
Kosuke Saito, Eri Arai, Keiko Maekawa, Masaki Ishikawa, Hiroyuki Fujimoto, Ryo Taguchi, Kenji Matsumoto, Yae Kanai, Yoshiro Saito
Scientific Reports.2016;[Epub] CrossRef - Intratumoral expression of cyclooxygenase-2 (COX-2) is a negative prognostic marker for patients with cutaneous melanoma
Łukasz Kuźbicki, Dariusz Lange, Agata Stanek-Widera, Barbara W. Chwirot
Melanoma Research.2016; 26(5): 448. CrossRef - New Insights on COX-2 in Chronic Inflammation Driving Breast Cancer Growth and Metastasis
Honor J. Hugo, C. Saunders, R. G. Ramsay, E. W. Thompson
Journal of Mammary Gland Biology and Neoplasia.2015; 20(3-4): 109. CrossRef - The Role of Prostaglandin E2 in Renal Cell Cancer Development: Future Implications for Prognosis and Therapy
Katarzyna Kaminska, Cezary Szczylik, Fei Lian, Anna M Czarnecka
Future Oncology.2014; 10(14): 2177. CrossRef - Genomics and epigenomics of clear cell renal cell carcinoma: Recent developments and potential applications
Małgorzata Rydzanicz, Tomasz Wrzesiński, Hans A.R. Bluyssen, Joanna Wesoły
Cancer Letters.2013; 341(2): 111. CrossRef - Quantitative Assessment of the Association of COX-2 (Cyclooxygenase-2) Immunoexpression with Prognosis in Human Osteosarcoma: A Meta-Analysis
Zhe Wang, Maolin He, Zengming Xiao, Hao Wu, Yang Wu, Dominique Heymann
PLoS ONE.2013; 8(12): e82907. CrossRef
 PubReader
 Cite this Article


Fig. 1
Fig. 2
Fig. 3
Fig. 4
Fig. 5


3CCRCC, clear cell renal cell carcinoma; COX-2, cyclooxygenase-2; TNM, tumor, node and metastasis.
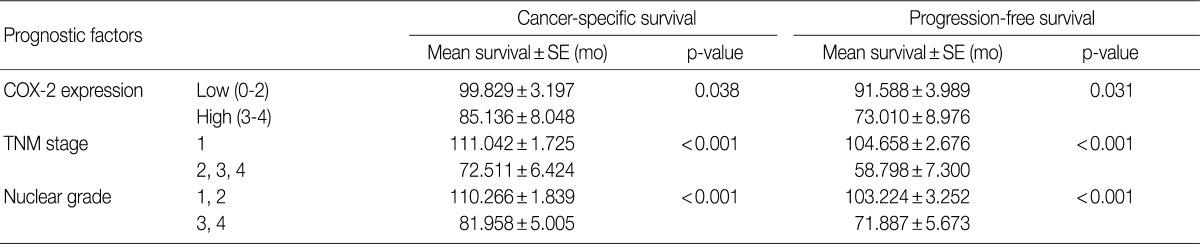
CCRCC, clear cell renal cell carcinoma; SE, standard error; COX-2, cyclooxygenase-2; TNM, tumor, node and metastasis.
CCRCC, clear cell renal cell carcinoma; COX-2, cyclooxygenase-2; CI, confidence interval; TNM, tumor, node and metastasis.

