 E-submission
Articles
- Page Path
- HOME > J Pathol Transl Med > Volume 56(1); 2022 > Article
-
Original Article
Clinicopathologic implication of PD-L1 gene alteration in primary adrenal diffuse large B cell lymphoma -
Ki Rim Lee1,2
 , Jiwon Koh2,3, Yoon Kyung Jeon2,3, Hyun Jung Kwon1,2, Jeong-Ok Lee4,5, Jin Ho Paik1,2
 -
Journal of Pathology and Translational Medicine 2022;56(1):32-39.
DOI: https://doi.org/10.4132/jptm.2021.10.05
Published online: November 16, 2021
1Department of Pathology, Seoul National University Bundang Hospital, Seongnam, Korea
2Department of Pathology, Seoul National University College of Medicine, Seoul, Korea
3Department of Pathology, Seoul National University Hospital, Seoul, Korea
4Department of Internal Medicine, Seoul National University Bundang Hospital, Seongnam, Korea
5Department of Internal Medicine, Seoul National University College of Medicine, Seoul, Korea
- Corresponding Author: Jin Ho Paik, MD, PhD, Department of Pathology, Seoul National University Bundang Hospital, 82, Gumi-ro 173beon-gil, Bundang-gu, Seongnam 13620, Korea, Tel: +82-31-787-7717, Fax: +82-31-787-4012, E-mail: paikjh@snu.ac.kr
© 2022 The Korean Society of Pathologists/The Korean Society for Cytopathology
This is an Open Access article distributed under the terms of the Creative Commons Attribution Non-Commercial License (https://creativecommons.org/licenses/by-nc/4.0) which permits unrestricted non-commercial use, distribution, and reproduction in any medium, provided the original work is properly cited.

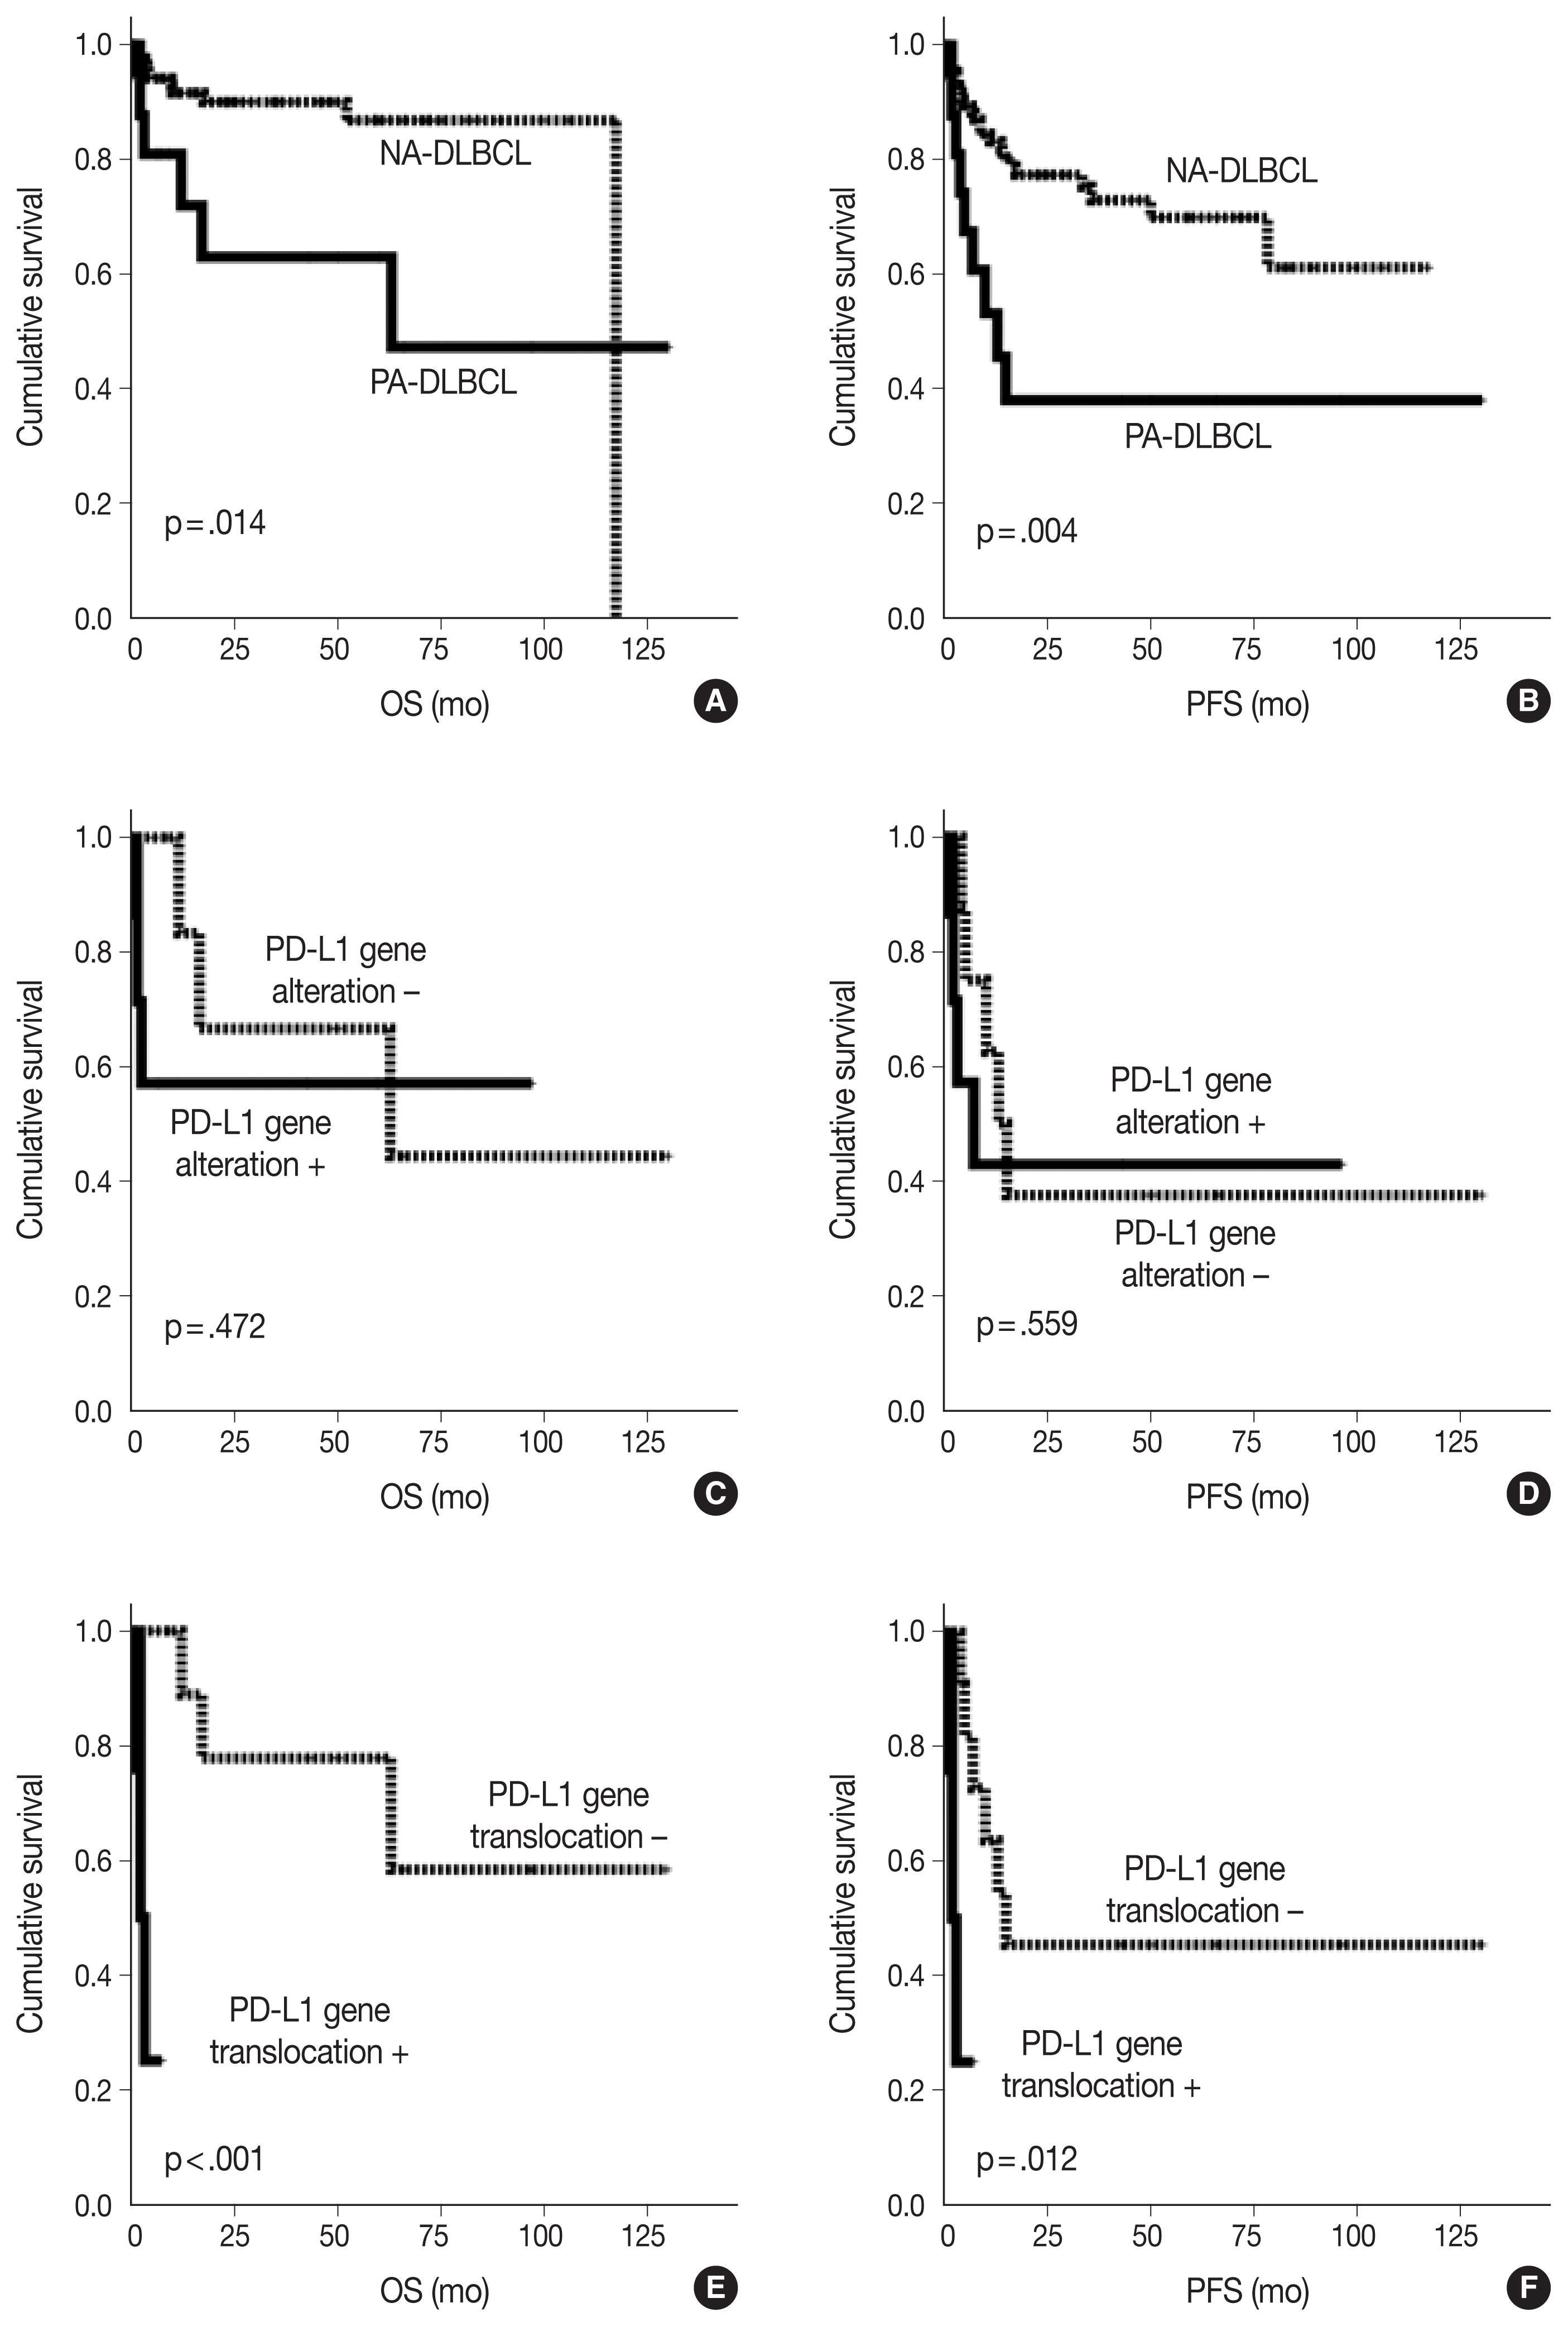
Figure & Data
References
Citations
- Case Report: Diagnostic value of spectral CT in primary adrenal lymphoma
Xiang Zhuang, Xi xi Jin, Li wen Feng, Hui Zhang
Frontiers in Oncology.2026;[Epub] CrossRef
 PubReader
 ePub Link
-
 Cite this Article
- Cite this Article
-
- Close
- Download Citation
- Close
- Figure
-
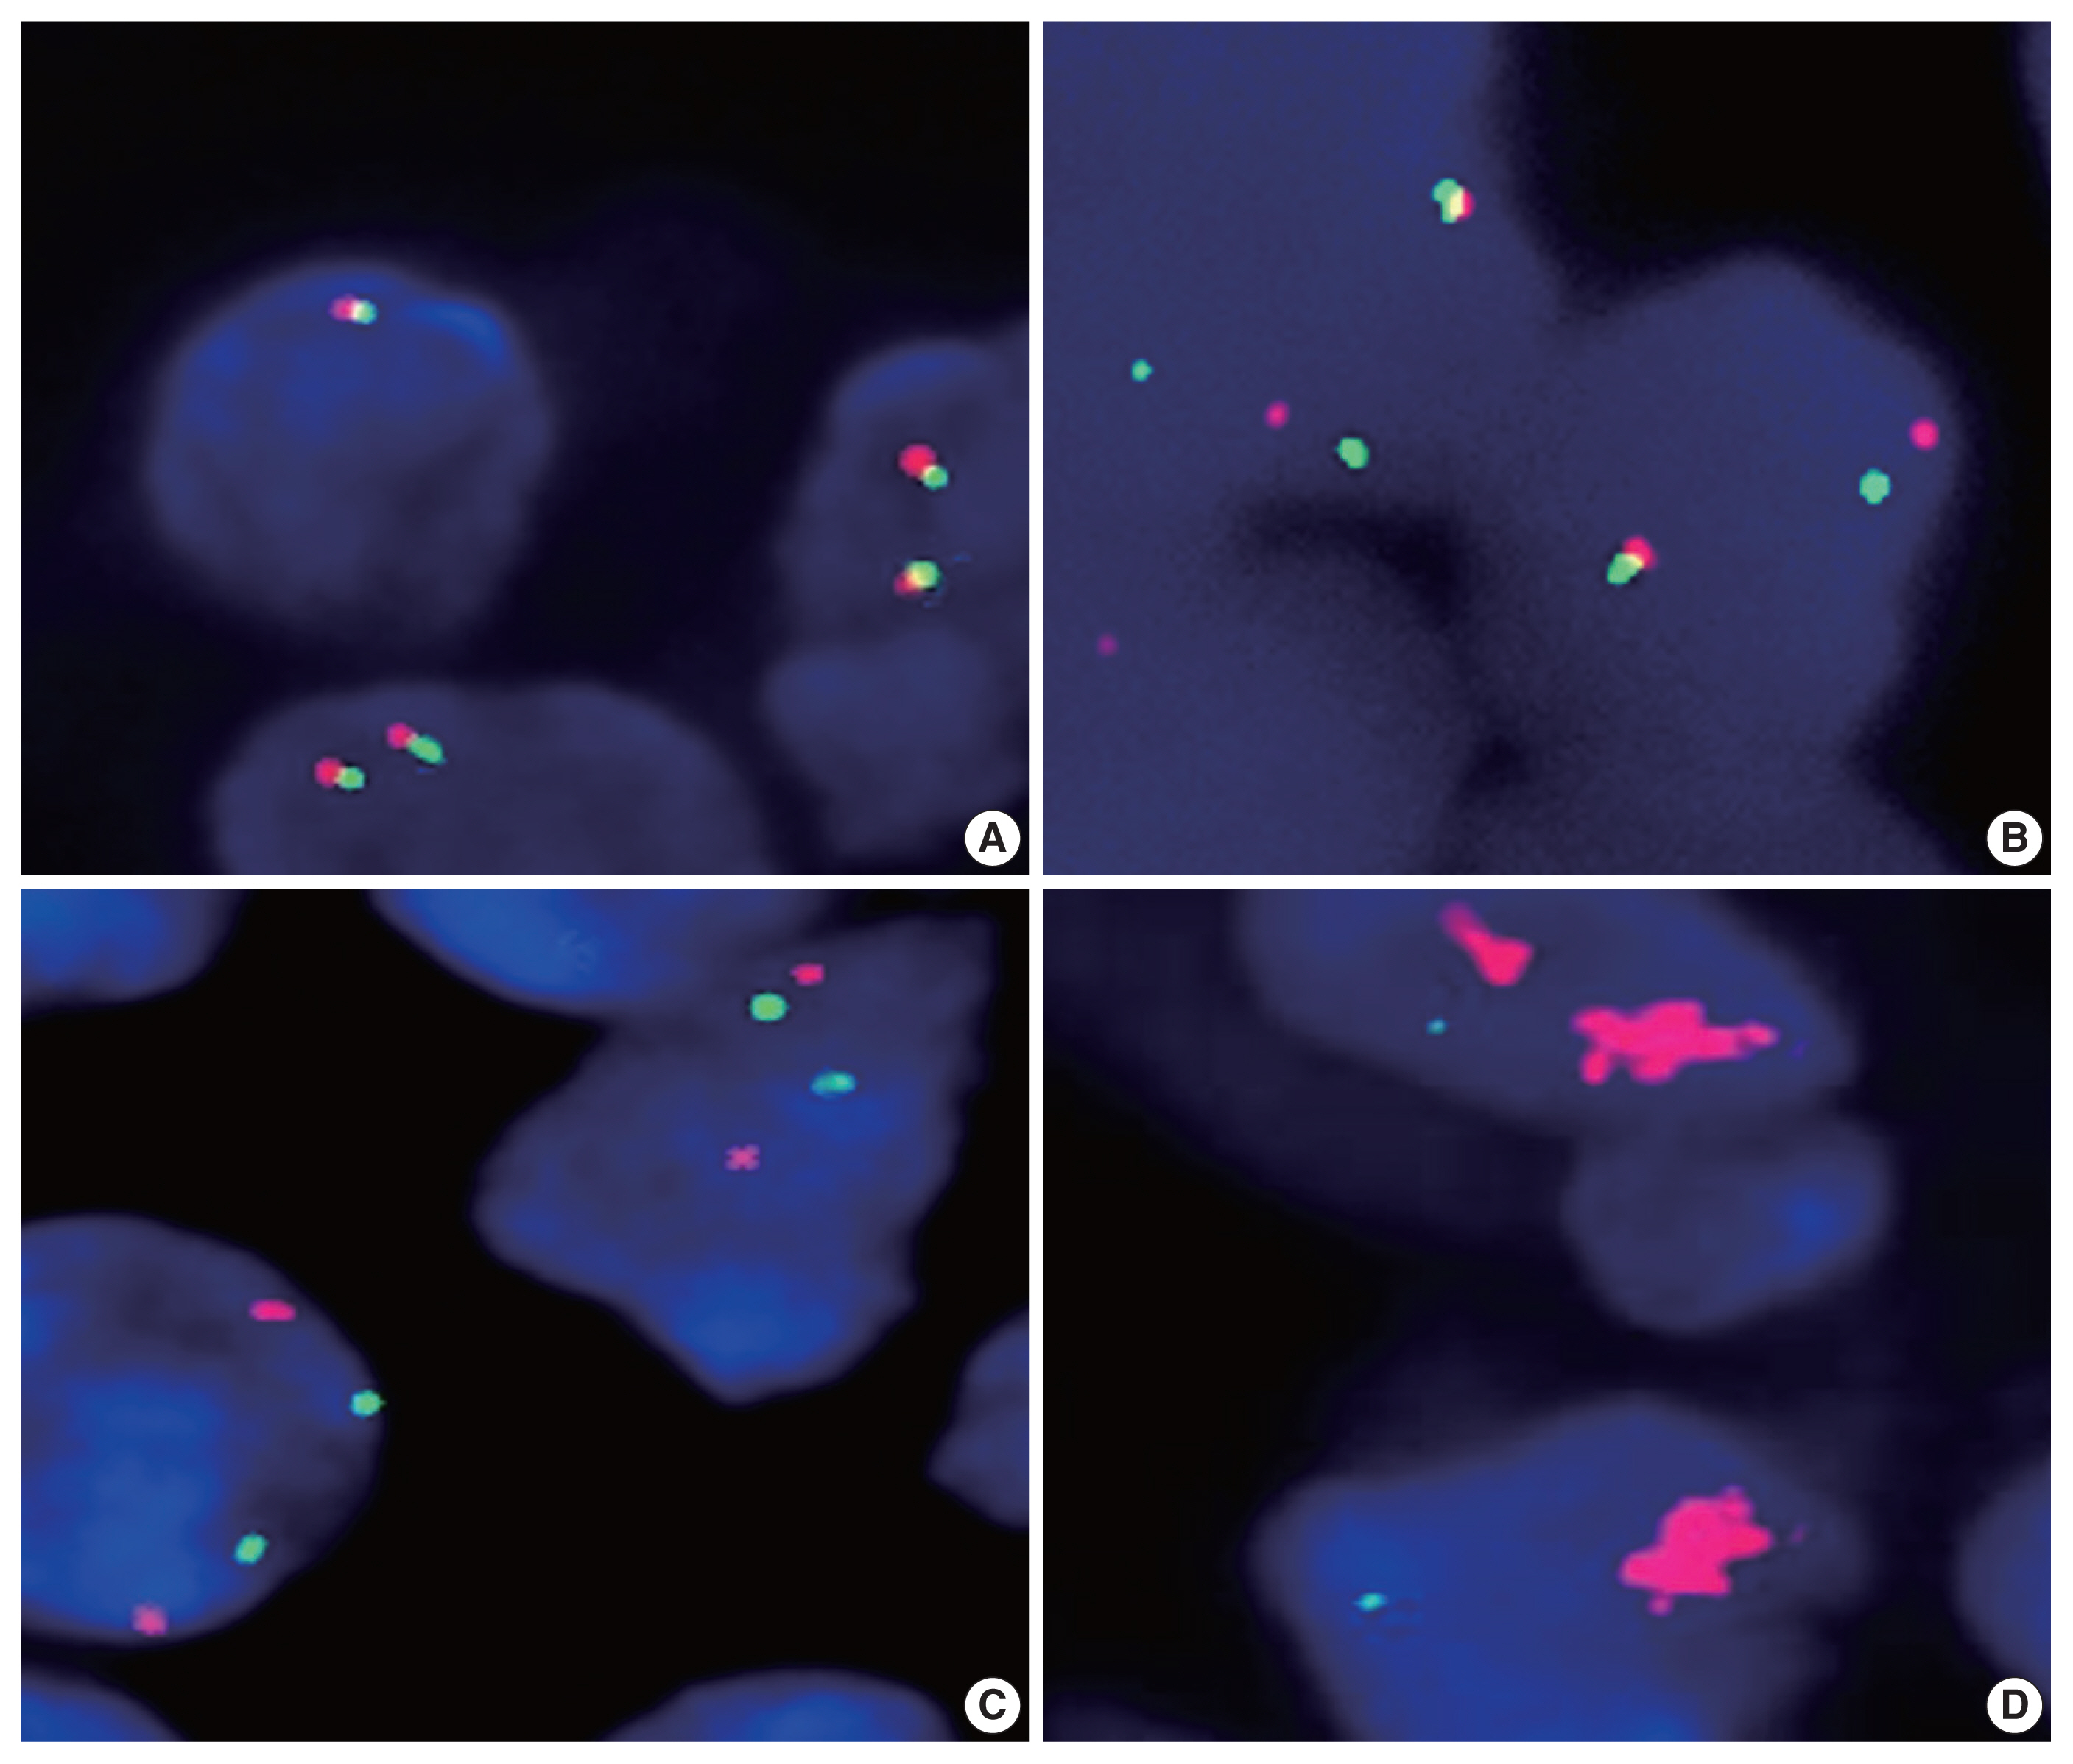


Fig. 1
Fig. 2
| Clinicopathologic characteristic | PA-DLBCL | NA-DLBCL | p-value |
|---|---|---|---|
| Age (yr) | .796 | ||
| ≤ 60 | 9 (50.0) | 42 (46.7) | |
| > 60 | 9 (50.0) | 48 (53.3) | |
| Sex | .667 | ||
| Men | 10 (55.6) | 45 (50.0) | |
| Women | 8 (44.4) | 45 (50.0) | |
| B symptoms | .082 | ||
| Absent | 10 (55.6) | 69 (76.7) | |
| Present | 8 (44.4) | 21 (23.0) | |
| ECOG PS | .003 | ||
| < 2 | 8 (53.3) | 80 (88.9) | |
| ≥ 2 | 7 (46.7) | 10 (11.1) | |
| Serum LDH | .035 | ||
| Normal | 4 (22.2) | 43 (49.4) | |
| Elevated | 14 (77.8) | 44 (50.6) | |
| Ann Arbor stage | .796 | ||
| I–II | 9 (50.0) | 42 (46.7) | |
| III–IV | 9 (50.0) | 48 (53.3) | |
| International prognostic index | .007 | ||
| 0–2 | 5 (27.8) | 56 (62.2) | |
| 3–5 | 13 (72.0) | 34 (37.8) | |
| Bone marrow involvement | > .99 | ||
| Absent | 13 (86.7) | 70 (84.3) | |
| Present | 2 (13.3) | 13 (15.7) | |
| Bulky mass (> 10 cm) | .084 | ||
| < 10 | 14 (77.8) | 83 (92.2) | |
| ≥ 10 | 4 (22.0) | 7 (7.8) | |
| Hans classification | .224 | ||
| GCB | 2 (13.3) | 25 (30.1) | |
| Non-GCB | 13 (86.7) | 58 (69.9) | |
| BCL2 expression | .349 | ||
| Negative | 4 (26.7) | 35 (39.3) | |
| Positive | 11 (73.3) | 54 (60.7) | |
| BCL6 expression | .079 | ||
| Negative | 4 (26.7) | 46 (51.1) | |
| Positive | 11 (73.3) | 44 (48.9) | |
| CD10 expression | .459 | ||
| Negative | 15 (93.8) | 76 (84.4) | |
| Positive | 1 (6.2) | 14 (15.6) | |
| MUM1 expression | .047 | ||
| Negative | 2 (13.3) | 36 (40.0) | |
| Positive | 13 (86.7) | 54 (60.0) | |
| Treatment | .585 | ||
| R-CHOP | 17 (94.4) | 81 (90.0) | |
| R-others | 1 (5.6) | 4 (4.4) | |
| Others | 0 (0.0) | 5 (5.6) | |
| Total | 18 (100.0) | 90 (100.0) |
| PD-L1 genetic status | PA-DLBCL | NA-DLBCL | p-value |
|---|---|---|---|
| PD-L1 translocation | .016 | ||
| Absent | 14 (77.8) | 84 (96.6) | |
| Present | 4 (22.2) | 3 (3.4) | |
| PD-L1 amplification | .034 | ||
| Absent | 15 (83.3) | 85 (97.7) | |
| Present | 3 (16.7) | 2 (2.3) | |
| PD-L1 genetic alteration | .001 | ||
| Absent | 11 (61.1) | 81 (94.2) | |
| Present | 7 (38.9) | 5 (5.8) | |
| Total | 18 (100.0) | 87 (100.0) |
| Clinicopathologic characteristic | Absence of PD-L1 genetic alteration | Presence of PD-L1 genetic alteration | p-value |
|---|---|---|---|
| Age (yr) | > .99 | ||
| ≤ 60 | 6 (54.5) | 4 (57.1) | |
| > 60 | 5 (45.5) | 3 (42.9) | |
| Sex | > .99 | ||
| Male | 6 (54.5) | 4 (57.1) | |
| Female | 5 (45.5) | 3 (42.9) | |
| B symptoms | .145 | ||
| Absent | 8 (72.7) | 2 (28.6) | |
| Present | 3 (27.3) | 5 (71.4) | |
| ECOG PS | .619 | ||
| < 2 | 5 (62.5) | 3 (42.9) | |
| ≥ 2 | 3 (37.5) | 4 (57.1) | |
| Serum LDH | .119 | ||
| Normal | 4 (36.4) | 0 | |
| Elevated | 7 (63.6) | 7 (100.0) | |
| Ann Arbor stage | .335 | ||
| I–II | 4 (36.4) | 5 (71.4) | |
| III–IV | 7 (63.6) | 2 (28.6) | |
| International prognostic index | .596 | ||
| 0–2 | 4 (36.4) | 1 (14.3) | |
| 3–5 | 7 (63.6) | 6 (85.7) | |
| Bone marrow involvement | .486 | ||
| Absent | 7 (77.8) | 6 (100.0) | |
| Present | 2 (22.2) | 0 | |
| Bulky disease (cm) | .119 | ||
| < 10 | 7 (63.6) | 7 (100.0) | |
| ≥ 10 | 4 (36.4) | 0 | |
| Mass size (cm) | 7.4 ± 3.2 | 5.5 ± 1.6 | .157 |
| Hans classification | > .99 | ||
| GCB | 1 (10.0) | 1 (20.0) | |
| Non-GCB | 9 (90.0) | 4 (80.0) | |
| BCL2 expression | .560 | ||
| Negative | 2 (20.0) | 2 (40.0) | |
| Positive | 8 (80.0) | 3 (60.0) | |
| BCL6 expression | > .99 | ||
| Negative | 3 (30.0) | 1 (20.0) | |
| Positive | 7 (70.0) | 4 (80.0) | |
| CD10 expression | > .99 | ||
| Negative | 9 (90.0) | 6 (100.0) | |
| Positive | 1 (10.0) | 0 | |
| MUM1 expression | > .99 | ||
| Negative | 1 (10.0) | 1 (20.0) | |
| Positive | 9 (90.0) | 4 (80.0) | |
| Total | 11 (100.0) | 7 (100.0) |
| Clinicopathologic variable | p-value | |
|---|---|---|
|
| ||
| Progression-free survival | Overall survival | |
| Age (≤ 60 vs. > 60) | .139 | .192 |
| Sex (male vs. female) | .910 | .656 |
| ECOG PS (< 2 vs. ≥ 2) | .039 | .661 |
| B symptoms (absent vs. present) | .206 | .704 |
| Serum LDH (normal vs. elevated) | .768 | .267 |
| International prognostic index (0–2 vs. 3–5) | .057 | .260 |
| Bone marrow involvement (absent vs. present) | .986 | .431 |
| Bulky disease (< 10 cm vs. ≥ 10 cm) | .158 | .873 |
| Ann Arbor stage (I–II vs. III–IV) | .535 | .857 |
| Hans classification (GCB vs. non-GCB) | .942 | .992 |
| PD-L1 gene alteration (− vs. +) | .559 | .472 |
| PD-L1 gene amplification (− vs. +) | .317 | .139 |
| PD-L1 gene translocation (− vs. +) | .012 | < .001 |
Values are presented as number (%). PA, primary adrenal; DLBCL, diffuse large B cell lymphoma; NA, non-adrenal; ECOG PS, Eastern Cooperative Oncology Group performance status; LDH, lactate dehydrogenase; GCB, germinal center B cell. p-values were calculated by Pearson’s chi-square test (2-sided) or Fisher’s exact test (2-sided).
Values are presented as number (%). p-values were calculated by Fisher’s exact test (2-sided). PD-L1, programmed death-ligand 1; PA, primary adrenal; DLBCL, diffuse large B cell lymphoma; NA, non-adrenal.
Values are presented as number (%) or mean ± SD. PDL1, programmed death-ligand 1; ECOG PS, Eastern Cooperative Oncology Group performance status; LDH, lactate dehydrogenase; GCB, germinal center B cell. p-values were calculated by Fisher’s exact test (2-sided) or Spearman’s correlation (2-sided; rho = −0.456).
PD-L1, programmed death-ligand 1; ECOG PS, Eastern Cooperative Group performance status; LDH, lactate dehydrogenase; GCB, germinal center B cell.

