 E-submission
Articles
- Page Path
- HOME > J Pathol Transl Med > Volume 54(5); 2020 > Article
-
Original Article
Lymph node size and its association with nodal metastasis in ductal adenocarcinoma of the pancreas -
Jaehoon Shin1
 , Seungbeom Shin2, Jae Hoon Lee3, Ki Byung Song3, Dae Wook Hwang3, Hyoung Jung Kim4, Jae Ho Byun4, HyungJun Cho2, Song Cheol Kim3, Seung-Mo Hong1
 -
Journal of Pathology and Translational Medicine 2020;54(5):387-395.
DOI: https://doi.org/10.4132/jptm.2020.06.23
Published online: July 21, 2020
1Department of Pathology, Asan Medical Center, University of Ulsan College of Medicine, Seoul, Korea
2Department of Statistics, Korea University, Seoul, Korea
3Department of Surgery, Asan Medical Center, University of Ulsan College of Medicine, Seoul, Korea
4Department of Radiology and Research Institute of Radiology, Asan Medical Center, University of Ulsan College of Medicine, Seoul, Korea
- Corresponding Author: Seung-Mo Hong, MD, PhD, Department of Pathology, Asan Medical Center, University of Ulsan College of Medicine, 88 Olympic-ro 43-gil, Songpa-gu, Seoul 05505, Korea Tel: +82-2-3010-4558, Fax: +82-2-472-7898, E-mail: smhong28@gmail.com
© 2020 The Korean Society of Pathologists/The Korean Society for Cytopathology
This is an Open Access article distributed under the terms of the Creative Commons Attribution Non-Commercial License (http://creativecommons.org/licenses/by-nc/4.0) which permits unrestricted non-commercial use, distribution, and reproduction in any medium, provided the original work is properly cited.
Abstract
-
Background
- Although lymph node metastasis is a poor prognostic factor in patients with pancreatic ductal adenocarcinoma (PDAC), our understanding of lymph node size in association with PDAC is limited. Increased nodal size in preoperative imaging has been used to detect node metastasis. We evaluated whether lymph node size can be used as a surrogate preoperative marker of lymph node metastasis.
-
Methods
- We assessed nodal size and compared it to the nodal metastatic status of 200 patients with surgically resected PDAC. The size of all lymph nodes and metastatic nodal foci were measured along the long and short axis, and the relationships between nodal size and metastatic status were compared at six cutoff points.
-
Results
- A total of 4,525 lymph nodes were examined, 9.1% of which were metastatic. The mean size of the metastatic nodes (long axis, 6.9±5.0 mm; short axis, 4.3±3.1 mm) was significantly larger than that of the non-metastatic nodes (long axis, 5.0±4.0 mm; short axis, 3.0±2.0 mm; all p<.001). Using a 10 mm cutoff, the sensitivity, specificity, positive predictive value, overall accuracy, and area under curve was 24.8%, 88.0%, 17.1%, 82.3%, and 0.60 for the long axis and 7.0%, 99.0%, 40.3%, 90.6%, and 0.61 for the short axis, respectively.
-
Conclusions
- The metastatic nodes are larger than the non-metastatic nodes in PDAC patients. However, the difference in nodal size was too small to be identified with preoperative imaging. The performance of preoperative radiologic imaging to predict lymph nodal metastasis was not good. Therefore, nodal size cannot be used a surrogate preoperative marker of lymph node metastasis.
- Case selection
- A total of 223 consecutive surgically resected PDAC cases from December of 2013 to December of 2014 were selected from a pathology archive. PDAC was the only pancreatic cancer included because it made up most of the surgically resected pancreatic cancer cases. Other histologic subtypes, such as adenosquamous, colloid, medullary, undifferentiated carcinomas, undifferentiated carcinomas with osteoclast-like giant cells, and squamous cell carcinomas, were not present. Fifteen PDACs arising from intraductal papillary mucinous neoplasm and one double primary cancer with concurrent pancreatic duodenal cancer were excluded. In addition, seven patients who had preoperative chemo-radiation therapy were also excluded. Finally, a total of 200 PDAC cases, including 133 pancreaticoduodenectomy, 58 distal pancreatectomy, and nine total pancreatectomy cases, were selected, and all cases had lymph node dissection. A flow chart illustrating the inclusion and exclusion criteria is depicted in Fig. 1. Clinical characteristics such as age and sex of the patient, tumor location, operation type, follow-up data, survival data, and recurrence and metastasis data were obtained from the electronic medical records. Pathologic data were evaluated, i.e., tumor size, invasion into the extrahepatic bile duct, duodenum, and spleen, histologic tumor grade, lymphovascular and perineural invasion, invasion of the large vessel, including splenic, portal, or superior mesenteric veins, the cancer resection margin, and pT and pN categories. The pT and pN categories were determined based on the 8th edition of the American Joint Committee on Cancer cancer staging system [9].
- Radiologic evaluation of suspicious metastatic lymph nodes
- Lymph nodes suspicious for metastasis were defined as those having a short axis more than 10 mm or an abnormal shape, including a round contour with an irregular margin or hypodense or heterogeneous density [22].
- Histopathological evaluation of lymph nodes
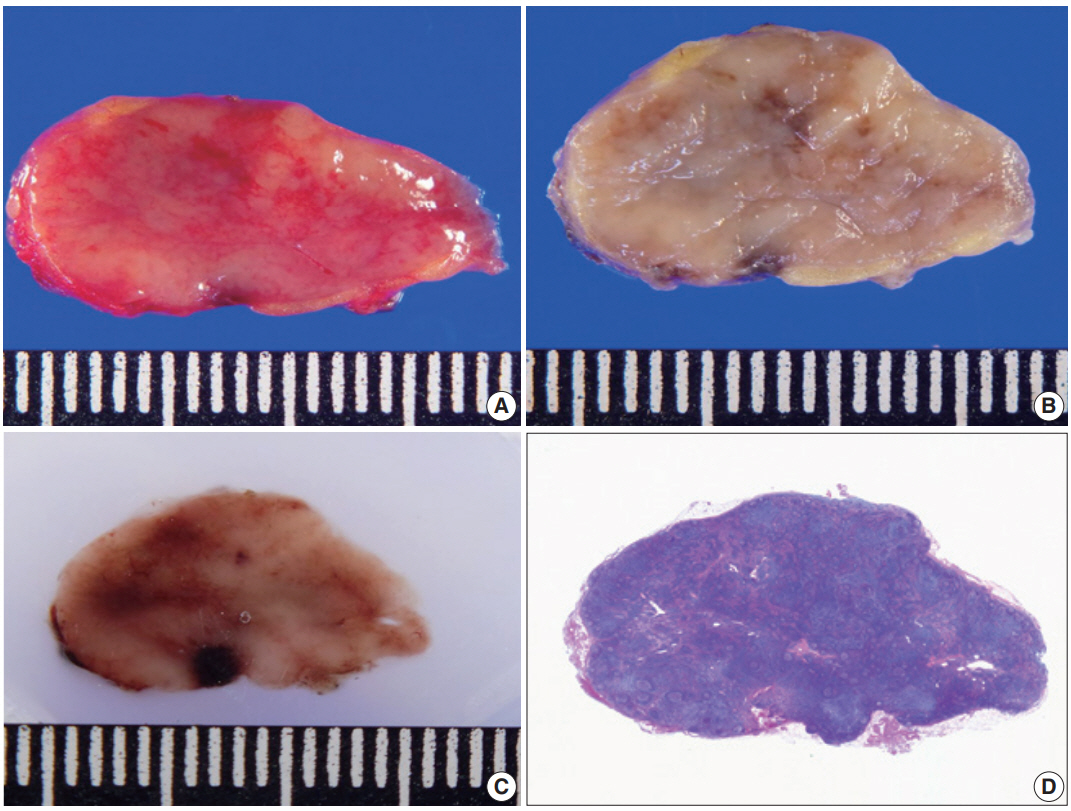
- Lymph nodes were meticulously retrieved during gross examination. Small lymph nodes were submitted as a single piece, while large lymph nodes were bisected [23]. Six cases were randomly selected to evaluate the shrinkage effect during the overnight fixation procedure with 10% neutral buffered formalin. The size of 85 lymph nodes was measured at the time of gross examination (before fixation) and on the formalin-fixed paraffin-embedded (FFPE) tissue blocks (after fixation). The size of the lymph nodes both in the long and short axes on hematoxylin and eosin (H&E) slides was measured. Representative gross (before and after fixation) and microscopic images of lymph node are depicted in Fig. 2.
- All H&E stained slides were carefully reviewed by two pathologists (J.S. and S.M.H.). The total examined and metastatic lymph nodes were counted. Since most pathologic examinations measure and use the largest dimension, the dimension of the long axis of each lymph node (in mm) was measured with a ruler and recorded, regardless of metastatic status. In addition, the dimension of the short axis of each lymph node was also measured, because measurement of the short axis of lymph nodes has been used in preoperative radiologic evaluation [22]. The largest dimension of each metastatic foci was measured and recorded. The lymph node size distribution and the relationship between lymph node size and metastatic status were evaluated.
- Statistical analysis
- Statistical analyses were performed with IBM SPSS Statistics for Windows, ver. 20.0 (IBM Corp., Armonk, NY, USA) and R project ver. 3.6.1. Categorical variables were compared by the Pearson chi-square and Fisher exact tests. Continuous variables were compared by the independent Student’s t-test and Wilcoxon signed-rank test. A p-value less than .05 was considered statistically significant. We used a logistic regression model to predict the probability of lymph node metastasis. Receiver operating characteristic (ROC) curves were generated to calculate the area under the curve (AUC), which measures the predictive power of lymph node size for estimating metastasis by preoperative imaging modalities.
MATERIALS AND METHODS
- Case characteristics
- The clinicopathologic characteristics of the patients are summarized in Table 1. The mean patient age was 62.1±10.0 years (range, 35 to 82 years), and 113 were male and 87 were female. The mean tumor size was 33±13 mm (range, 6 to 88 mm). Approximately two-thirds (113) of the cases were classified as T2 (66.5%), 22 cases (11%) were T1, 37 cases (18.5%) were T3, and eight cases (4%) were classified as T4. Lymphovascular and perineural invasion occurred in 149 (74.5%) and 181 (90.5%) cases, respectively. Lymph node metastasis was observed in 124 (62%) cases. Of the cases with nodal metastasis, 85 were N1 cases (42.5%) and 39 were N2 cases (19.5%). The median follow-up period was 20 months (range, 1 to 71 months), and 161 of 200 patients died during this period.
- Comparison of lymph node size before and after fixation
- The mean long axis nodal sizes of 85 lymph nodes from six randomly selected cases before and after the fixation procedure were 6.9±4.5 mm (range, 2 to 19 mm) and 6.5±3.9 mm (range, 2 to 17 mm), respectively. There was a significant decrease in lymph node size after fixation (Wilcoxon signed-rank test, p<.001). The calculated shrinkage effect (mean, 0.47±0.75; 95% confidence interval [CI], 0.31 to 0.63) after fixation was 6.8%. There were 14 metastatic (16%) and 71 were non-metastatic (84%) lymph nodes. The mean sizes of metastatic nodes along the long axis before and after fixation were 8.7±5.2 mm and 8.1±4.8 mm, respectively. The mean sizes of non-metastatic nodes along the long axis before and after fixation were 6.6±4.3 mm and 6.1±3.7 mm, respectively. No significant differences in the shrinkage effect were observed between the metastatic and non-metastatic lymph node groups (p=.585).
- The mean short axis nodal sizes before and after the fixation procedure were 4.2±2.6 mm (range, 1 to 15 mm) and 3.9±2.2 mm (range, 1 to 13.5 mm), respectively. There was a significant decrease in lymph node size after fixation (Wilcoxon signed-rank test, p<.001). The calculated shrinkage effect (mean, 0.33±0.49; 95% CI, 0.22 to 0.44) after fixation was 7.9%. The mean sizes of metastatic nodes along the short axis before and after fixation were 5.4±3.6 mm and 4.9±3.1 mm, respectively. The mean sizes of non-metastatic nodes along the short axis before and after fixation were 4.0±2.4 mm and 3.7±2.0 mm, respectively. No significant differences in the shrinkage effect were observed between the metastatic and non-metastatic lymph node groups (p=.156).
- Association of lymph node metastasis and other clinicopathologic factors
- The associations between lymph node metastasis and other clinicopathologic factors are summarized in Table 1. Lymph node metastasis was associated with large tumor size (p=.015), invasion into large vessels, including the splenic, portal, and/or superior mesenteric veins (p=.007), involvement of the resection margin (p=.027), high T categories (p=.008), and lymphovascular invasion (p<.001).
- Comparison of lymph node size based on metastatic status
- A total of 4,525 lymph nodes were evaluated in this study; 412 (9.1%) had metastatic foci, while 4,113 (90.9%) had no metastasis. The mean number of examined lymph nodes was 22.6±11.9 per case (Fig. 3). The mean number of metastatic lymph nodes was 2.1±2.6 per case (Fig. 4). The mean sizes of the long and short axes of all lymph nodes were 5.2±4.1 mm and 3.1±2.2 mm, respectively. The mean size of the long axis of the 412 metastatic lymph nodes (6.9±5.0 mm) was significantly larger than that of the non-metastatic lymph nodes (5.0±4.0 mm, p<.001). Similarly, the mean size of the short axis of the metastatic lymph nodes (4.3±3.1 mm) was significantly larger than that of the non-metastatic lymph nodes (3.0±2.0 mm, p<.001).
- As imaging modalities can detect lymph nodes with a diameter of more than 10 mm of the short axis, we compared the size of the largest lymph node from each case. The mean size of the largest lymph nodes measured along the long axis from 200 individual cases was 14.7±5.8 mm. The mean size of the largest lymph node from 124 patients with nodal metastasis (15.6±5.7 mm) was significantly larger than that from 76 patients without metastasis (13.3±5.8 mm, p=.009). There were 595 lymph nodes with a diameter greater 10 mm, 102 of which exhibited metastatic foci (17.1%).
- Preoperative estimation of lymph node metastasis by imaging modalities based on each case
- Preoperative radiologic estimation of lymph node metastasis by preoperative CT or MRI imaging was compared with metastatic status by histopathologic evaluation in 200 cases. The sensitivity and specificity of preoperative radiologic estimation of metastasis was 56.5% (70/124 cases) and 89.5% (68/76 cases), respectively. The positive predictive value (PPV) and negative predictive value (NPV) of the estimation of lymph node metastasis was 89.7% (70/78 cases) and 55.7% (68/122 cases), respectively, based on preoperative radiologic imaging.
- Sensitivity, specificity, PPV, NPV, and overall accuracy of nodal metastasis with different cutoffs based on the number of examined lymph nodes
- We then compared the metastatic status of lymph nodes at six different cutoff points, including 6, 8, 10, 12, 15, and 20 mm, based on lymph node size measured along the long axis after fixation. The sensitivity, specificity, PPV, and NPV at each cutoff point for all 4,525 evaluated lymph nodes are summarized in Table 2. At the cutoff point of 10 mm, the sensitivity was 24.8% (102/412 lymph nodes), specificity was 88.0% (3,620/4,113), PPV was 17.1% (102/595), NPV was 92.1% (3,620/3,930), and overall accuracy was 82.3% (3,722/4,525).
- We also compared the metastatic status of lymph nodes at six different cutoff points, including 4, 6, 8, 10, 12, and 14 mm, based on lymph nodes measured along the short axis after fixation. The sensitivity, specificity, PPV, and NPV at each cutoff point for all 4,525 evaluated lymph nodes are summarized in Table 3. At the cutoff point of 10 mm, the sensitivity was 7.0% (29/412 lymph nodes), specificity was 99.0% (4,070/4,113), PPV was 40.3% (29/72), NPV was 91.4% (4,070/4,453), and overall accuracy was 90.6% (4,099/4,525).
- Predicted probability of lymph node metastasis based on logistic regression and analysis of ROC
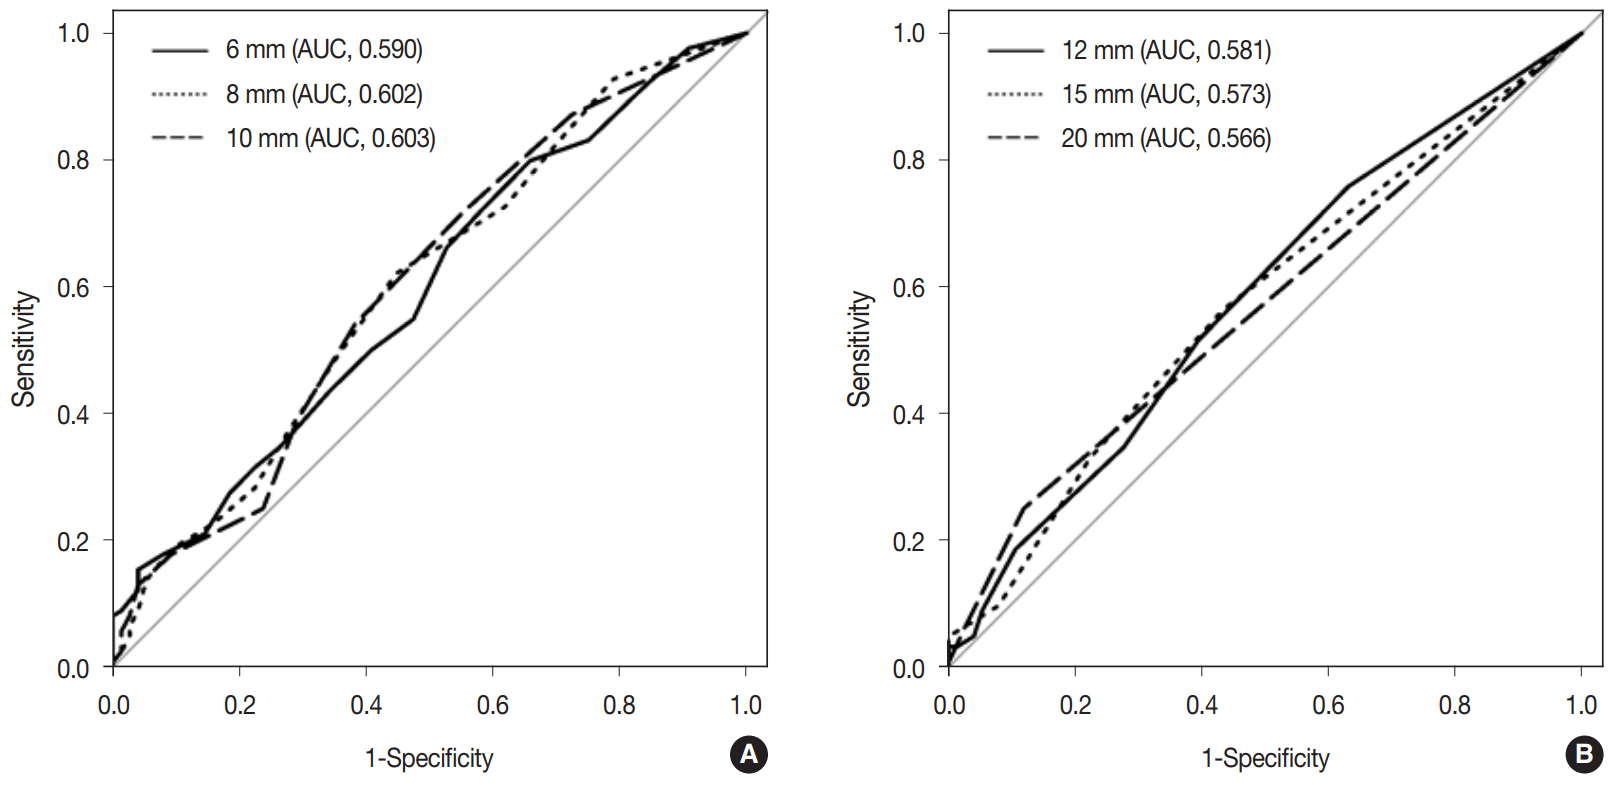
- The predicted probability of node metastasis according to lymph node size was assessed by logistic regression analysis. As lymph node size measured along the long axis increased by 1 mm, the odds of node metastasis increased by 1.09-fold. When the long axis size of lymph nodes was more than 10 mm, the predicted probability of nodal metastasis was 12.5%. Fig. 5 demonstrates the ROC curves of six cutoff points for discriminating metastatic lymph nodes from non-metastatic ones measured along the long axis. The AUC value of the ROC curve at the 10 mm cutoff was the largest (0.603; 95% CI, 0.522 to 0.684).
- Similarly, as lymph node size measured along the short axis increased by 1 mm, the odds of node metastasis increased by 1.24-fold. When the short axis size of lymph nodes was more than 10 mm, the predicted probability of nodal metastasis was 32.0%. Fig. 6 demonstrates the ROC curves of six cutoff points for discriminating metastatic lymph nodes from non-metastatic ones measured along the short axis. The AUC value of the ROC curve at the 10 mm cutoff was the largest (0.610; 95% CI, 0.516 to 0.705).
RESULTS
- Lymph node metastasis is a poor prognostic factor in patients with PDAC [5-8,12]. To better understand the relationship between lymph node size and metastases, we comprehensively evaluated all harvested lymph nodes by measuring the size along the long and short axes and compared the lymph node size and metastasis. The AUC was 0.61 and 0.60 when nodal size was measured along the short and long axis, respectively, at the cutoff points of 10 mm. These results indicate that the performance of preoperative radiologic imaging to predict lymph nodal metastasis is not good.
- We observed that when cancer cells metastasized to lymph nodes, the nodal size was significantly larger than that of nonmetastatic lymph nodes. However, the mean size difference measured along the long axis between metastatic (6.9 mm) and nonmetastatic (5.0 mm) lymph nodes was only 1.9 mm. Similarly, the mean size difference measured along the short axis between metastatic (4.3 mm) and non-metastatic (3.0 mm) lymph nodes was only 1.3 mm. Traditionally, lymph nodes with a diameter of more than 10 mm measured along the short axis have been radiologically considered as metastatic lymph nodes. When we compared the largest lymph nodes from each case, the mean difference in size measured along the long axis between metastatic (15.6 mm) and non-metastatic (13.3 mm) nodes was only 2.3 mm. When largest lymph nodes from each case were compared, the mean difference in size measured along the short axis between metastatic (8.8 mm) and non-metastatic (7.6 mm) nodes was only 1.2 mm. This difference may not be enough to discriminate metastatic lymph nodes from non-metastatic ones on preoperative imaging modalities or during surgery.
- We evaluated 4,525 lymph nodes and compared node size and metastatic status to determine how to best discriminate between metastatic and non-metastatic lymph nodes. The sensitivity, specificity, PPV, and NPV in the present study was 25%, 88%, 17%, and 92%, respectively, at the 10 mm cutoff point measured along the long axis. The sensitivity, specificity, PPV, and NPV was 7%, 99%, 40%, and 91%, respectively, at the 10 mm cutoff point measured along the short axis. Previous studies compared lymph node size and metastatic status using a small number of lymph nodes. The results of our study and previous reports are summarized in Table 4. The sensitivity and specificity in our study were comparable with those of previous research (sensitivity, 14%–37%; specificity, 60%–92%) [15-21]. Megibow et al. [16] included large number of examined cases (n=95), and the sensitivity, specificity, PPV, and NPV of their study was 37%, 60%, 47%, and 56%, respectively. The PPV was slightly lower but the NPV was higher in our study, possibly because we included a large number of lymph nodes. Our study had 91% accuracy rate measured along the short axis in estimating nodal metastasis at a 10 mm cutoff point.
- In contrast to previous work, we compared the sensitivity, specificity, accuracy, PPV, and NPV of lymph node size to estimate metastasis at several different cutoff points measured along both the long and short axis. Recent technical advances in multi-detector CT scanning allows for reconstructed images at a resolution of 2–5 mm thickness [22]. We were able to best discriminate between metastatic and non-metastatic lymph nodes from ROC analyses with a 10 mm cutoff for the short axis diameter. The PPV of estimating metastatic lymph nodes was 40% based on the ROC analyses.
- In our study, the shrinkage effect after FFPE fixation was 6.8%. This suggests that if the long axis of a lymph node is 10 mm after FFPE tissue, this is equivalent to it being 10.7 mm on imaging modalities. The shrinkage effect of lymph nodes (6.8% and 7.9% along the long and short axis, respectively) in the present study was larger than that of kidney and uterine cervix tissues, but smaller than that of other organs in previous studies [24]. The shrinkage effect after FFPE varied between 2.7% to 20%, depending on the organ [24]. One previous study reported that the shrinkage effect of lymph node was 10% when tested with 5% formaldehyde [14].
- We measured lymph nodes along the long and short axis regardless of other aspects of metastatic lymph nodes. Some studies measured the short-axis diameter only and used 10 mm as the benchmark to diagnose metastasis [16-21], while other studies used specifically selected cutoff points, including 5 mm, 15 mm, or 20 mm, for diagnosis. We measured lymph node size the same way as the previous studies by measuring the short-axis diameter and compared size and metastasis at selected cutoff points. In addition, we also measured lymph node size along the long axis, since all pathologic fields use the largest dimension of tumor size. The metastatic lymph nodes were best distinguished from nonmetastatic nodes at the cutoff point 10 mm regardless of measuring either long or short axis. However, the performance was not good enough. Therefore, preoperative radiologic evaluation of metastatic lymph nodes may not be dependable.
- In summary, metastatic PDAC lymph nodes are larger than non-metastatic ones. Although the metastatic lymph nodes were best distinguished from non-metastatic nodes at the cutoff point 10 mm regardless of measuring either long or short axis, the performance was not good enough. Therefore, nodal size cannot be used a surrogate preoperative marker of lymph node metastasis.
DISCUSSION
Ethics Statement
Institutional Review Board approval with patient consent waiver was obtained (approval number: 2020-0440).
Author contributions
Conceptualization: JS, SMH. Data curation: JS. Formal analysis: JS, SS, HC. Funding acquisition: SMH. Investigation: JS, JHL, KBS, DWH. Methodology: HJK, JHB, SCK, SMH. Supervision: SMH. Validation: JS, SS. Writing—original draft: JS, SS, SMH. Writing—review & editing: JS, SS, HC, SMH. Approval of final manuscript: all authors.
Conflicts of Interest
The authors declare that they have no potential conflicts of interest.
Funding Statement
This work was supported by the National Research Foundation of Korea (NRF) and funded by the Ministry of Science, ICT, and Future Planning (SMH, NRF-2019R1H1A2102016).


| Study | No. of patients | No. of lymph nodes | Measured axis | Cut off point (mm) | Sensitivity (%) | Specificity (%) | PPV (%) | NPV (%) | Accuracy (%) |
|---|---|---|---|---|---|---|---|---|---|
| Rosch et al. [21] | 40 | NA | Short | 10 | 36 | 80 | 7 | 42 | NA |
| Palazzo et al. [19] | 38 | NA | Short | 10 | 19 | 92 | 83 | 34 | 42 |
| Muller et al. [17] | 22 | NA | Short | 10 | 20 | 75 | NA | NA | 50 |
| Megibow et al. [16] | 95 | NA | Short | 10–15 | 37 | 60 | 47 | 56 | 53 |
| Zeman et al. [20] | 26 | NA | Short | 10 | NA | NA | NA | NA | 58 |
| Midwinter et al. [18] | 23 | NA | Short | 10 | 33 | 86 | 60 | 67 | NA |
| Roche et al. [15] | 9 | 40 | Short | 10 | 14 | 85 | 17 | 8 | 72.5 |
| Our study | 200 | 4,525 | Short and long | 10 | 7 | 99 | 40 | 91 | 91 |
- 1. Roth MT, Berlin JD. Current concepts in the treatment of resectable pancreatic cancer. Curr Oncol Rep 2018; 20: 39.ArticlePubMedPDF
- 2. Jung KW, Won YJ, Kong HJ, Lee ES. Prediction of cancer incidence and mortality in Korea, 2018. Cancer Res Treat 2018; 50: 317-23. ArticlePubMedPMCPDF
- 3. Siegel RL, Miller KD, Jemal A. Cancer statistics, 2019. CA Cancer J Clin 2019; 69: 7-34. ArticlePubMedPDF
- 4. Hernandez JM, Morton CA, Al-Saadi S, et al. The natural history of resected pancreatic cancer without adjuvant chemotherapy. Am Surg 2010; 76: 480-5. ArticlePubMedPDF
- 5. Lowder CY, Metkus J, Epstein J, et al. Clinical implications of extensive lymph node metastases for resected pancreatic cancer. Ann Surg Oncol 2018; 25: 4004-11. ArticlePubMedPDF
- 6. Allen PJ, Kuk D, Castillo CF, et al. Multi-institutional validation study of the American Joint Commission on Cancer (8th Edition) changes for T and N staging in patients with pancreatic adenocarcinoma. Ann Surg 2017; 265: 185-91. ArticlePubMedPMC
- 7. Konstantinidis IT, Deshpande V, Zheng H, et al. Does the mechanism of lymph node invasion affect survival in patients with pancreatic ductal adenocarcinoma? J Gastrointest Surg 2010; 14: 261-7. ArticlePubMedPDF
- 8. Murakami Y, Uemura K, Sudo T, et al. Number of metastatic lymph nodes, but not lymph node ratio, is an independent prognostic factor after resection of pancreatic carcinoma. J Am Coll Surg 2010; 211: 196-204. ArticlePubMed
- 9. Amin MB, Edge SB, Greene FL, et al. AJCC cancer staging manual. 8th ed. New York: Springer, 2017.
- 10. Li HJ, Chen YT, Yuan SQ. Proposal of a modified American Joint Committee on Cancer staging scheme for resectable pancreatic ductal adenocarcinoma with a lymph node ratio-based N classification: a retrospective cohort study. Medicine (Baltimore) 2018; 97: e12094.PubMedPMC
- 11. Schwarz RE, Smith DD. Extent of lymph node retrieval and pancreatic cancer survival: information from a large US population database. Ann Surg Oncol 2006; 13: 1189-200. ArticlePubMedPDF
- 12. Tomlinson JS, Jain S, Bentrem DJ, et al. Accuracy of staging nodenegative pancreas cancer: a potential quality measure. Arch Surg 2007; 142: 767-23. ArticlePubMed
- 13. van der Valk P, Meijer CJ. The lymph nodes. In: Mills SE, ed. Histology for pathologists. 4th ed. Philadelphia: Lippincott Williams & Wilkins, 2012; 820-8.
- 14. Prenzel KL, Holscher AH, Vallbohmer D, et al. Lymph node size and metastatic infiltration in adenocarcinoma of the pancreatic head. Eur J Surg Oncol 2010; 36: 993-6. ArticlePubMed
- 15. Roche CJ, Hughes ML, Garvey CJ, et al. CT and pathologic assessment of prospective nodal staging in patients with ductal adenocarcinoma of the head of the pancreas. AJR Am J Roentgenol 2003; 180: 475-80. ArticlePubMed
- 16. Megibow AJ, Zhou XH, Rotterdam H, et al. Pancreatic adenocarcinoma: CT versus MR imaging in the evaluation of resectability: report of the Radiology Diagnostic Oncology Group. Radiology 1995; 195: 327-32. ArticlePubMed
- 17. Muller MF, Meyenberger C, Bertschinger P, Schaer R, Marincek B. Pancreatic tumors: evaluation with endoscopic US, CT, and MR imaging. Radiology 1994; 190: 745-51. ArticlePubMed
- 18. Midwinter MJ, Beveridge CJ, Wilsdon JB, Bennett MK, Baudouin CJ, Charnley RM. Correlation between spiral computed tomography, endoscopic ultrasonography and findings at operation in pancreatic and ampullary tumours. Br J Surg 1999; 86: 189-93. ArticlePubMedPDF
- 19. Palazzo L, Roseau G, Gayet B, et al. Endoscopic ultrasonography in the diagnosis and staging of pancreatic adenocarcinoma: results of a prospective study with comparison to ultrasonography and CT scan. Endoscopy 1993; 25: 143-50. ArticlePubMedPDF
- 20. Zeman RK, Cooper C, Zeiberg AS, et al. TNM staging of pancreatic carcinoma using helical CT. AJR Am J Roentgenol 1997; 169: 459-64. ArticlePubMed
- 21. Rosch T, Braig C, Gain T, et al. Staging of pancreatic and ampullary carcinoma by endoscopic ultrasonography. Comparison with conventional sonography, computed tomography, and angiography. Gastroenterology 1992; 102: 188-99. ArticlePubMed
- 22. Al-Hawary MM, Francis IR, Chari ST, et al. Pancreatic ductal adenocarcinoma radiology reporting template: consensus statement of the Society of Abdominal Radiology and the American Pancreatic Association. Radiology 2014; 270: 248-60. ArticlePubMed
- 23. Rosai J. Rosai and Ackerman’s surgical pathology. 10th ed. New York: Mosby Elsevier, 2011.
- 24. Tran T, Sundaram CP, Bahler CD, et al. Correcting the shrinkage effects of formalin fixation and tissue processing for renal tumors: toward standardization of pathological reporting of tumor size. J Cancer 2015; 6: 759-66. ArticlePubMedPMC
REFERENCES
Figure & Data
References
Citations
- Interpretable prediction of occult lymph node metastasis in pancreatic ductal adenocarcinoma using a model fusing habitat radiomics and deep learning
Jun Guan, Yuanqing Liu, Feiwen Feng, Can Chen, Dezhen Song, Wu Cai, Su Hu
Abdominal Radiology.2026;[Epub] CrossRef - Preoperative CT-based node-RADS scoring for risk stratification in pancreatic head cancer: diagnostic accuracy and survival implications
Cenk Parlatan, Şeyda Gökçe Turunç, Okan Dilek, Görkem Özdemir, Timuçin Çil
European Journal of Radiology.2026; 201: 112895. CrossRef - Advances in Radiomics for the Diagnosis and Treatment of Pancreatic Ductal Adenocarcinoma
炜枫 潘
Advances in Clinical Medicine.2025; 15(07): 432. CrossRef - Preoperative MRI and CA19-9 for predicting occult lymph node metastasis in small pancreatic ductal adenocarcinoma (≤ 2 cm)
Qiying Tang, Lei Li, Zhiwei Pan, Jianbo Li, Xiaolan Huang, Mengsu Zeng, Haitao Sun, Jianjun Zhou
BMC Medical Imaging.2025;[Epub] CrossRef - Dual-tracer fluorescence imaging and surgical resection of metastatic lymph nodes in breast cancer: sensitivity, specificity, and first-in-human results
Ziyang Wang, Bo Dai, Jian Zhang, Yang Wu, Yunlong Li, Ying Cao, Qi You, Wei Wang, Sunil Singhal, Shuming Nie, Christopher J. Butch, Huiming Cai, Yiqing Wang
Med-X.2025;[Epub] CrossRef - Clinicopathological Features of Cervical Lymphadenopathy of Children Less Than 15 Years Old: A Hospital-based Study
Ali Kosari, Shokouh Taghipour Zahir, Saadat Eslami
Journal of Head & Neck Physicians and Surgeons.2025; 13(2): 180. CrossRef - Long‐term outcomes of neoadjuvant gemcitabine, nab‐paclitaxel, and S1 (GAS) in borderline resectable pancreatic cancer with arterial contact: Results from a phase II trial
Kenichiro Uemura, Naru Kondo, Takeshi Sudo, Tatsuaki Sumiyoshi, Ryuta Shintakuya, Kenjiro Okada, Kenta Baba, Takumi Harada, Yoshiaki Murakami, Shinya Takahashi
Journal of Hepato-Biliary-Pancreatic Sciences.2024; 31(5): 351. CrossRef - Comparison of MRI and CT-based radiomics for preoperative prediction of lymph node metastasis in pancreatic ductal adenocarcinoma
Piaoe Zeng, Chao Qu, Jianfang Liu, Jingjing Cui, Xiaoming Liu, Dianrong Xiu, Huishu Yuan
Acta Radiologica.2023; 64(7): 2221. CrossRef - Prevalence of Adenopathy at Chest Computed Tomography After Vaccination for Severe Acute Respiratory Syndrome Coronavirus 2
Georgeann McGuinness, Jeffrey B. Alpert, Geraldine Brusca-Augello, Lea Azour, Jane P. Ko, Farah Tamizuddin, Elliott K. Gozansky, William H. Moore
Journal of Computer Assisted Tomography.2023; 47(1): 50. CrossRef - Predictive role of radiomics features extracted from preoperative cross-sectional imaging of pancreatic ductal adenocarcinoma in detecting lymph node metastasis: a systemic review and meta-analysis
Mohammad Mirza-Aghazadeh-Attari, Seyedeh Panid Madani, Haneyeh Shahbazian, Golnoosh Ansari, Alireza Mohseni, Ali Borhani, Shadi Afyouni, Ihab R. Kamel
Abdominal Radiology.2023; 48(8): 2570. CrossRef - Regional lymph node metastasis detected on preoperative CT and/or FDG-PET may predict early recurrence of pancreatic adenocarcinoma after curative resection
Ja Kyung Yoon, Mi-Suk Park, Seung-Seob Kim, Kyunghwa Han, Hee Seung Lee, Seungmin Bang, Ho Kyoung Hwang, Sang Hyun Hwang, Mijin Yun, Myeong-Jin Kim
Scientific Reports.2022;[Epub] CrossRef - Role of CA 19.9 in the Management of Resectable Pancreatic Cancer: State of the Art and Future Perspectives
Alessandro Coppola, Vincenzo La Vaccara, Tommaso Farolfi, Michele Fiore, Roberto Cammarata, Sara Ramella, Roberto Coppola, Damiano Caputo
Biomedicines.2022; 10(9): 2091. CrossRef - Evaluation of the 8th Edition AJCC Staging System for the Clinical Staging of Pancreatic Cancer
Huapyong Kang, Seung-seob Kim, Min Je Sung, Jung Hyun Jo, Hee Seung Lee, Moon Jae Chung, Jeong Youp Park, Seung Woo Park, Si Young Song, Mi-Suk Park, Seungmin Bang
Cancers.2022; 14(19): 4672. CrossRef - Does direct invasion of peripancreatic lymph nodes impact survival in patients with pancreatic ductal adenocarcinoma? A retrospective dual-center study
Daisuke Hashimoto, Sohei Satoi, Mitsuaki Ishida, Kenji Nakagawa, Masaya Kotsuka, Tadataka Takagi, Hironori Ryota, Taichi Terai, Tatsuma Sakaguchi, Minako Nagai, So Yamaki, Takahiro Akahori, Tomohisa Yamamoto, Mitsugu Sekimoto, Masayuki Sho
Pancreatology.2021; 21(5): 884. CrossRef - CA19.9 Serum Level Predicts Lymph-Nodes Status in Resectable Pancreatic Ductal Adenocarcinoma: A Retrospective Single-Center Analysis
Alessandro Coppola, Vincenzo La Vaccara, Michele Fiore, Tommaso Farolfi, Sara Ramella, Silvia Angeletti, Roberto Coppola, Damiano Caputo
Frontiers in Oncology.2021;[Epub] CrossRef
 PubReader
 ePub Link
-
 Cite this Article
- Cite this Article
-
- Close
- Download Citation
- Close
- Figure
-
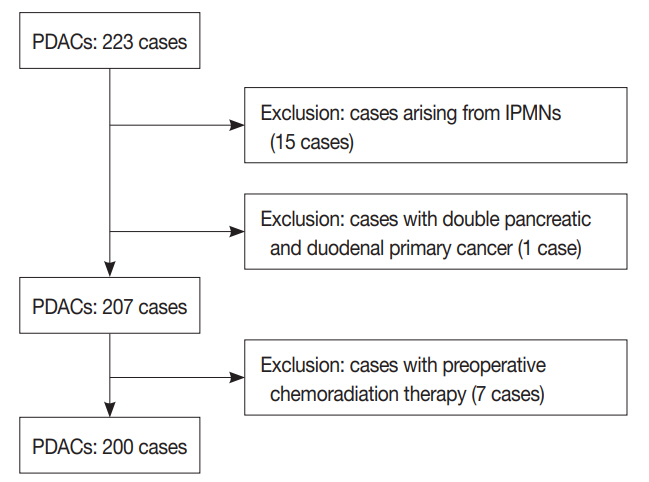

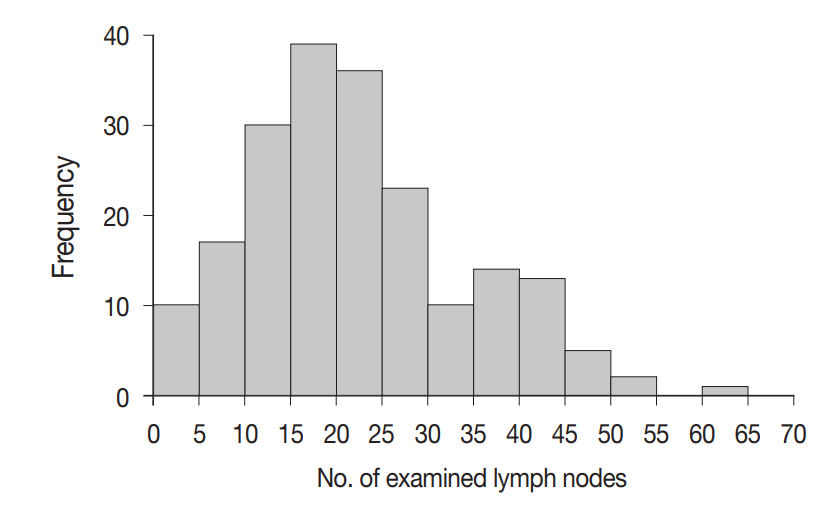
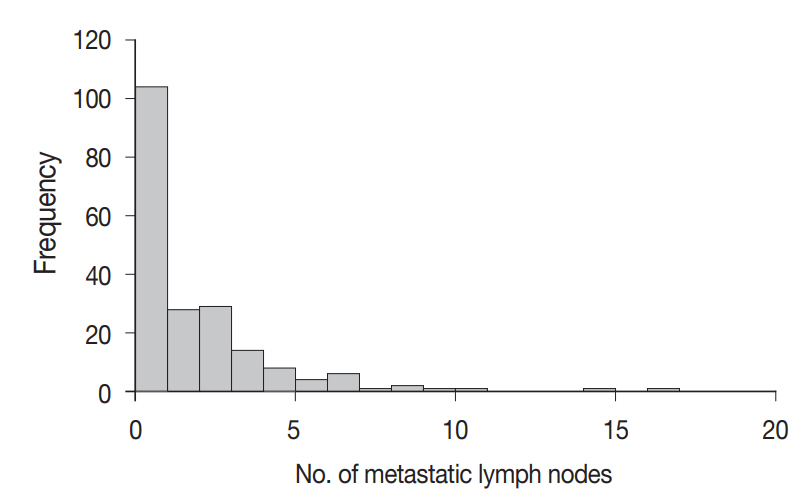

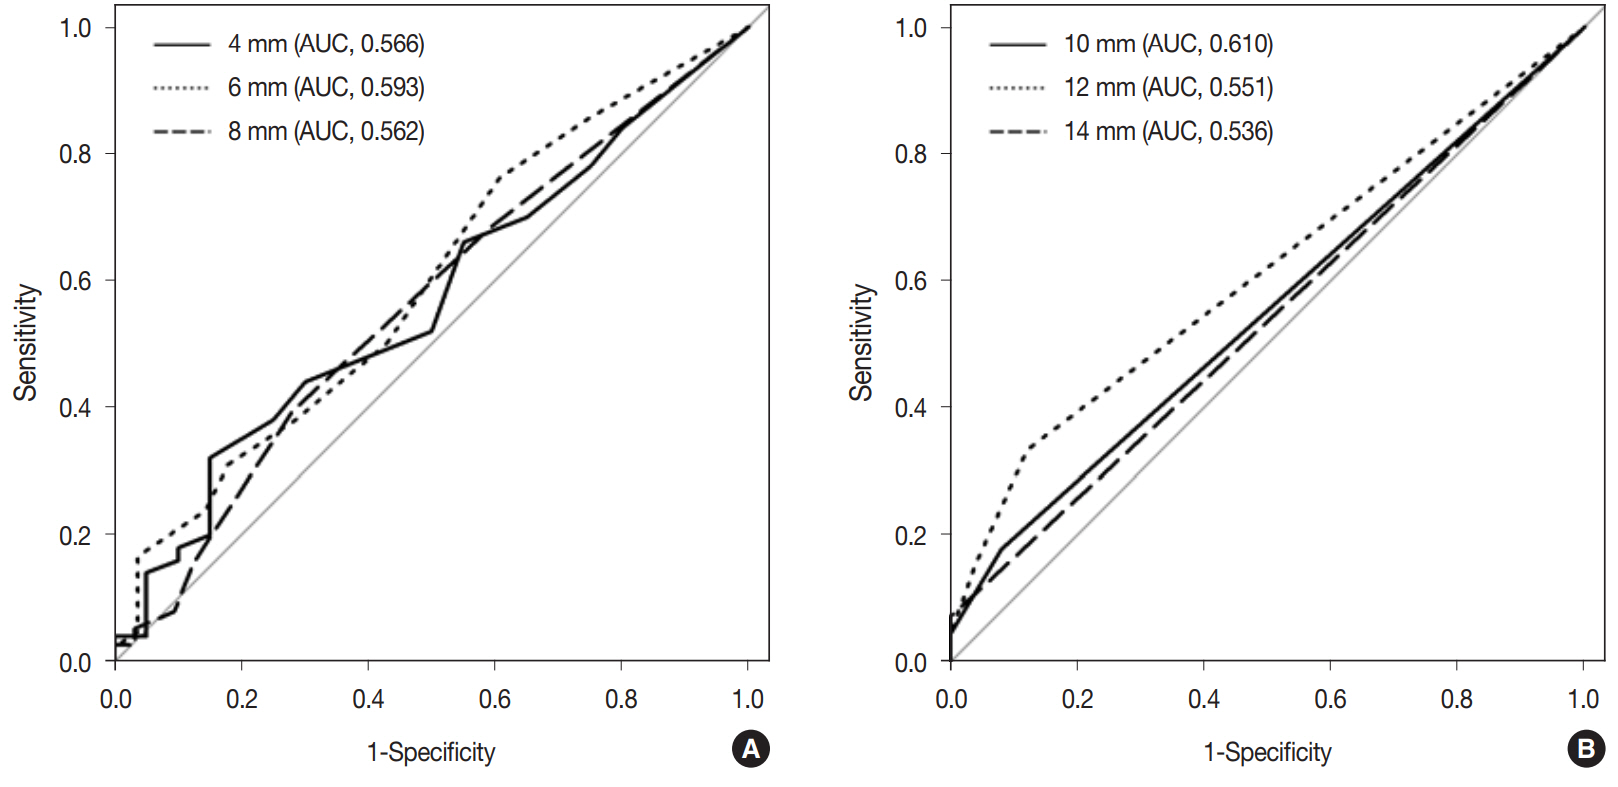


Fig. 1.
Fig. 2.
Fig. 3.
Fig. 4.
Fig. 5.
Fig. 6.
| Characteristic | Without lymph node metastasis | With lymph node metastasis | p-value |
|---|---|---|---|
| No. of patients | 76 | 124 | |
| Age (yr) | 62.7 ± 1.1 (43–81) | 61.8 ± 0.9 (35–82) | .544 |
| Sex | .986 | ||
| Male | 43 (56.6) | 70 (56.5) | |
| Female | 33 (43.4) | 54 (43.5) | |
| Peripancreatic soft tissue invasion | 71 (93.4) | 122 (98.4) | .107 |
| Common bile duct invasion | 32 (42.1) | 67 (54.0) | .102 |
| Duodenum invasion | 27 (35.5) | 57 (46.0) | .146 |
| Large vessel invasion | .007 | ||
| Absent | 65 (85.5) | 85 (68.5) | |
| Present | 11 (14.5) | 39 (31.5) | |
| Surgical margin status | .027 | ||
| Free | 57 (75.0) | 74 (59.7) | |
| Involved | 19 (25.0) | 50 (40.3) | |
| Tumor size (cm) | 3.0 ± 0.1 (0.6–7.0) | 3.4 ± 0.1 (1.3–8.8) | .015 |
| Tumor location | .338 | ||
| Head/uncinate/neck | 49 (64.5) | 81 (65.3) | |
| Body/tail | 23 (30.3) | 30 (24.2) | |
| Diffuse or multifocal | 4 (5.3) | 13 (10.5) | |
| T category | .008 | ||
| pT1 | 13 (17.1) | 9 (7.3) | |
| pT2 | 53 (69.7) | 80 (64.5) | |
| pT3 | 10 (13.2) | 27 (21.8) | |
| pT4 | 0 | 8 (6.5) | |
| Histologic grade | .188 | ||
| Well differentiated | 5 (6.6) | 2 (1.6) | |
| Moderately differentiated | 60 (78.9) | 102 (82.3) | |
| Poorly differentiated | 11 (14.5) | 20 (16.1) | |
| Lymphovascular invasion | < .001 | ||
| Absent | 34 (44.7) | 17 (13.7) | |
| Present | 42 (55.3) | 107 (86.3) | |
| Perineural invasion | .167 | ||
| Absent | 10 (13.2) | 9 (7.3) | |
| Present | 66 (86.8) | 115 (92.7) |
| Cutoff point (mm) | Sensitivity | Specificity | PPV | NPV | Accuracy |
|---|---|---|---|---|---|
| 6 | 200/412 (48.5) | 2,780/4,113 (67.6) | 200/1,533 (13.0) | 2,780/2,992 (92.9) | 2,980/4,525 (65.9) |
| 8 | 140/412 (34.0) | 3,332/4,113 (81.0) | 140/921 (15.2) | 3,332/3,604 (92.5) | 3,472/4,525 (76.7) |
| 10 | 102/412 (24.8) | 3,620/4,113 (88.0) | 102/595 (17.1) | 3,620/3,930 (92.1) | 3,722/4,525 (82.3) |
| 12 | 62/412 (15.0) | 3,809/4,113 (92.6) | 62/366 (16.9) | 3,809/4,159 (91.6) | 3,871/4,525 (85.5) |
| 15 | 27/412 (6.6) | 3,952/4,113 (96.1) | 27/188 (14.4) | 3,952/4,337 (91.1) | 3,979/4,525 (87.9) |
| 20 | 13/412 (3.2) | 4,075/4,113 (99.1) | 13/51 (25.5) | 4,075/4,474 (91.1) | 4,088/4,525 (90.3) |
| Cutoff point (mm) | Sensitivity | Specificity | PPV | NPV | Accuracy |
|---|---|---|---|---|---|
| 4 | 187/412 (45.4) | 2,980/4,113 (72.5) | 187/1,320 (14.2) | 2,980/3,205 (93.0) | 3,167/4,525 (70.0) |
| 6 | 101/412 (24.5) | 3,643/4,113 (88.6) | 101/571 (17.7) | 3,643/3,954 (92.1) | 3,744/4,525 (82.7) |
| 8 | 52/412 (12.6) | 3,929/4,113 (95.5) | 52/236 (22.0) | 3,929/4,289 (91.6) | 3,981/4,525 (88.0) |
| 10 | 29/412 (7.0) | 4,070/4,113 (99.0) | 29/72 (40.3) | 4,070/4,453 (91.4) | 4,099/4,525 (90.6) |
| 12 | 14/412 (3.4) | 4,097/4,113 (99.6) | 14/30 (46.7) | 4,097/4,495 (91.1) | 4,111/4,525 (90.9) |
| 14 | 8/412 (1.9) | 4,112/4,113 (99.9) | 8/9 (88.9) | 4,112/4,516 (91.1) | 4,120/4,525 (91.0) |
| Study | No. of patients | No. of lymph nodes | Measured axis | Cut off point (mm) | Sensitivity (%) | Specificity (%) | PPV (%) | NPV (%) | Accuracy (%) |
|---|---|---|---|---|---|---|---|---|---|
| Rosch et al. [21] | 40 | NA | Short | 10 | 36 | 80 | 7 | 42 | NA |
| Palazzo et al. [19] | 38 | NA | Short | 10 | 19 | 92 | 83 | 34 | 42 |
| Muller et al. [17] | 22 | NA | Short | 10 | 20 | 75 | NA | NA | 50 |
| Megibow et al. [16] | 95 | NA | Short | 10–15 | 37 | 60 | 47 | 56 | 53 |
| Zeman et al. [20] | 26 | NA | Short | 10 | NA | NA | NA | NA | 58 |
| Midwinter et al. [18] | 23 | NA | Short | 10 | 33 | 86 | 60 | 67 | NA |
| Roche et al. [15] | 9 | 40 | Short | 10 | 14 | 85 | 17 | 8 | 72.5 |
| Our study | 200 | 4,525 | Short and long | 10 | 7 | 99 | 40 | 91 | 91 |
Values are presented as number (%) or mean ± SD (range). PDAC, pancreatic ductal adenocarcinoma; SD, standard deviation.
Values are presented as number (%). PPV, positive predictive value; NPV, negative predictive value; PDAC, pancreatic ductal adenocarcinoma.
Values are presented as number (%). PPV, positive predictive value; NPV, negative predictive value; PDAC, pancreatic ductal adenocarcinoma.
PPV, positive predictive value; NPV, negative predictive value; NA, not applicable.

