 E-submission
Articles
- Page Path
- HOME > J Pathol Transl Med > Volume 53(5); 2019 > Article
-
Original Article
Clinicopathological Characterization and Prognostic Implication of SMAD4 Expression in Colorectal Carcinoma -
Seung-Yeon Yoo1,2
 , Ji-Ae Lee1,2, Yunjoo Shin2, Nam-Yun Cho2, Jeong Mo Bae1,2, Gyeong Hoon Kang1,2
 -
Journal of Pathology and Translational Medicine 2019;53(5):289-297.
DOI: https://doi.org/10.4132/jptm.2019.06.07
Published online: June 24, 2019
1Department of Pathology, Seoul National University Hospital, Seoul, Korea
2Laboratory of Epigenetics, Cancer Research Institute, Seoul National University College of Medicine, Seoul, Korea
-
Corresponding Author: Jeong Mo Bae, MD, Department of Pathology, Seoul National University College of Medicine, 103 Daehak-ro, Jongno-gu, Seoul 03080, Korea Tel: +82-2-2072-3374, Fax: +82-2-743-5530, E-mail: jeongmobae@gmail.com
Corresponding Author: Gyeong Hoon Kang, MD, Department of Pathology, Seoul National University College of Medicine, 103 Daehak-ro, Jongno-gu, Seoul 03080, Korea Tel: +82-2-740-8263, Fax: +82-2-765-5600, E-mail: ghkang@snu.ac.kr
© 2019 The Korean Society of Pathologists/The Korean Society for Cytopathology
This is an Open Access article distributed under the terms of the Creative Commons Attribution Non-Commercial License (http://creativecommons.org/licenses/by-nc/4.0) which permits unrestricted non-commercial use, distribution, and reproduction in any medium, provided the original work is properly cited.
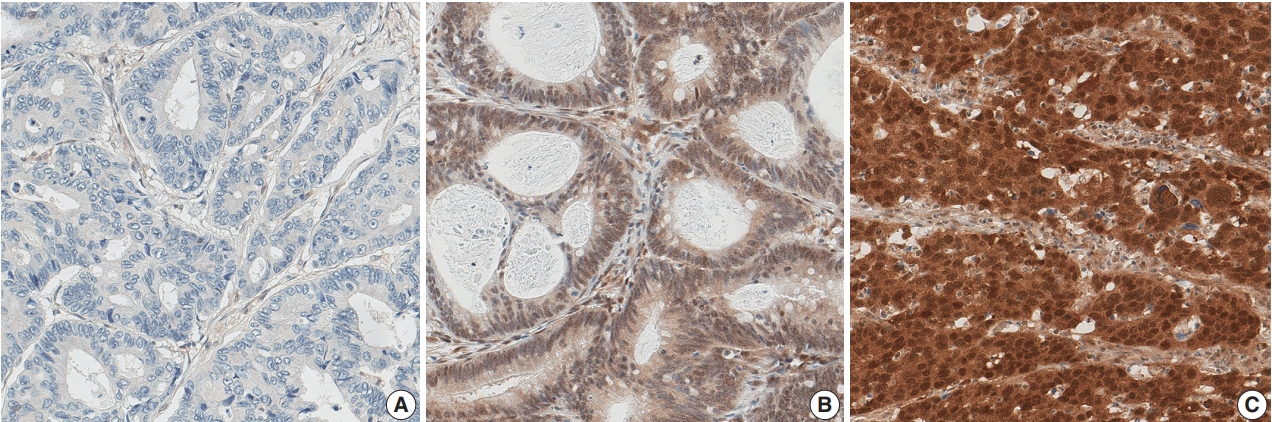

Figure & Data
References
Citations
- Механизмы резистентности к иммунотерапии при MSI фенотипе
М. Ю. Федянин
Malignant tumours.2025; 15(3s1): 11. CrossRef - A set cover algorithm identifies minimal circulating tumour DNA sequencing targets for colorectal cancer detection
Kit Moloney-Geany, Michael A. Black, Robert C. Day, Parry Guilford, Michael J. Dunnet
Scientific Reports.2025;[Epub] CrossRef - Association between the expression of epithelial–mesenchymal transition (EMT)-related markers and oncologic outcomes of colorectal cancer
Mona Hany Emile, Sameh Hany Emile, Amr Awad El-Karef, Mohamed Awad Ebrahim, Ibrahim Eldosoky Mohammed, Dina Abdallah Ibrahim
Updates in Surgery.2024; 76(6): 2181. CrossRef - TGF-β and SMAD2/4 Expression in Nonmetastatic and Metastatic Colorectal Cancer Patients
Ainul Mardiah, Hendra Susanto, Sri Rahayu Lestari, A. Taufiq, H. Susanto, H. Nur, M. Diantoro, M. Aziz, N.A.N.N. Malek
BIO Web of Conferences.2024; 117: 01001. CrossRef - Unraveling Resistance to Immunotherapy in MSI-High Colorectal Cancer
Ronald Heregger, Florian Huemer, Markus Steiner, Alejandra Gonzalez-Martinez, Richard Greil, Lukas Weiss
Cancers.2023; 15(20): 5090. CrossRef - Association of β-Catenin, APC, SMAD3/4, Tp53, and Cyclin D1 Genes in Colorectal Cancer: A Systematic Review and Meta-Analysis
Hongfeng Yan, Fuquan Jiang, Jianwu Yang, Ying-Kun Xu
Genetics Research.2022; 2022: 1. CrossRef - Comprehensive genetic features of gastric mixed adenoneuroendocrine carcinomas and pure neuroendocrine carcinomas
Jiwon Koh, Soo Kyung Nam, Yoonjin Kwak, Gilhyang Kim, Ka‐Kyung Kim, Byung‐Chul Lee, Sang‐Hoon Ahn, Do Joong Park, Hyung‐Ho Kim, Kyoung Un Park, Woo Ho Kim, Hye Seung Lee
The Journal of Pathology.2021; 253(1): 94. CrossRef - Alterations of PTEN and SMAD4 methylation in diagnosis of breast cancer: implications of methyl II PCR assay
Menha Swellam, Entsar A. Saad, Shimaa Sabry, Adel Denewer, Camelia Abdel Malak, Amr Abouzid
Journal of Genetic Engineering and Biotechnology.2021; 19(1): 54. CrossRef - Molecular Characterization and Functional Analysis of Two Steroidogenic Genes TSPO and SMAD4 in Yellow Catfish
Fang Chen, Chong-Chao Zhong, Chang-Chun Song, Shu-Wei Chen, Yang He, Xiao-Ying Tan
International Journal of Molecular Sciences.2021; 22(9): 4505. CrossRef - SMAD7 and SMAD4 expression in colorectal cancer progression and therapy response
Jovana Rosic, Sandra Dragicevic, Marko Miladinov, Jovana Despotovic, Aleksandar Bogdanovic, Zoran Krivokapic, Aleksandra Nikolic
Experimental and Molecular Pathology.2021; 123: 104714. CrossRef - Actionable Potentials of Less Frequently Mutated Genes in Colorectal Cancer and Their Roles in Precision Medicine
Ryia Illani Mohd Yunos, Nurul Syakima Ab Mutalib, Francis Yew Fu Tieng, Nadiah Abu, Rahman Jamal
Biomolecules.2020; 10(3): 476. CrossRef
 PubReader
 ePub Link
-
 Cite this Article
- Cite this Article
-
- Close
- Download Citation
- Close
- Figure
-

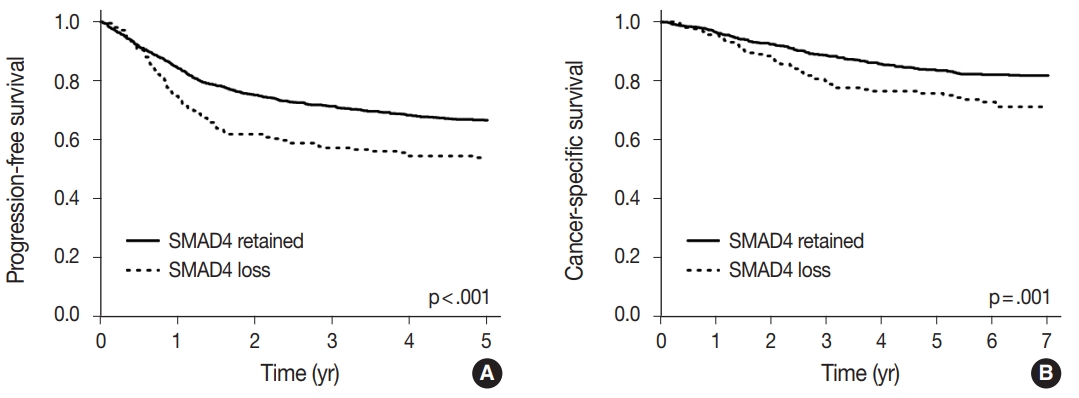


Fig. 1.
Fig. 2.
| SMAD4-loss (n = 210, 16.4%) | SMAD4-low (n = 942, 73.5%) | SMAD4-high (n = 129, 10.1%) | p for difference | p for trend | |
|---|---|---|---|---|---|
| Age (yr) | 64 (27–83) | 63 (20–90) | 61 (25–93) | .222 | |
| Sex | .225 | .105 | |||
| Male | 132 (62.9) | 566 (60.1) | 69 (53.5) | ||
| Female | 78 (37.1) | 376 (39.9) | 60 (46.5) | ||
| Location | < .001 | .222 | |||
| Proximal | 61 (29.1) | 216 (22.9) | 50 (38.8) | ||
| Distal/Rectum | 149 (70.9) | 726 (77.1) | 79 (61.2) | ||
| Gross type | .002 | < .001 | |||
| Fungating | 122 (58.1) | 624 (66.2) | 99 (76.7) | ||
| Infiltrative | 88 (41.9) | 318 (33.8) | 30 (23.3) | ||
| pT category | < .001 | < .001 | |||
| pT1-2 | 20 (9.5) | 176 (18.7) | 37 (28.7) | ||
| pT3-4 | 190 (90.5) | 766 (81.3) | 92 (71.3) | ||
| pN category | < .001 | < .001 | |||
| pN0 | 85 (40.5) | 471 (50.0) | 89 (69.0) | ||
| pN1-2 | 125 (59.5) | 471 (50.0) | 40 (31.0) | ||
| Distant metastasis | .001 | .001 | |||
| M0 | 167 (79.5) | 775 (82.3) | 122 (94.6) | ||
| M1 | 43 (20.5) | 167 (17.7) | 7 (5.4) | ||
| TNM stage | < .001 | < .001 | |||
| I, II | 76 (36.2) | 448 (47.6) | 87 (67.4) | ||
| III, IV | 134 (63.8) | 494 (52.4) | 42 (32.6) | ||
| Lymphovascular invasion | < .001 | < .001 | |||
| Absent | 97 (46.2) | 543 (57.6) | 96 (74.4) | ||
| Present | 113 (53.8) | 399 (42.4) | 33 (26.6) | ||
| Perineural invasion | <.001 | < .001 | |||
| Absent | 133 (63.3) | 730 (77.5) | 113 (87.6) | ||
| Present | 77 (36.7) | 212 (22.5) | 16 (12.4) | ||
| Differentiation (grade) | .612 | .923 | |||
| Differentiated (G1/2) | 200 (95.2) | 906 (94.2) | 122 (94.6) | ||
| Undifferentiated (G3/4) | 10 (4.8) | 36 (3.8) | 7 (5.4) | ||
| Tumor budding | < .001 | < .001 | |||
| Absent | 48 (22.9) | 256 (27.2) | 57 (44.2) | ||
| Present | 162 (77.1) | 686 (72.8) | 72 (55.8) | ||
| Tumor-infiltrating lymphocytes (400 × magnification) | < .001 | < .001 | |||
| Low (< 8) | 164 (78.1) | 739 (78.4) | 72 (55.8) | ||
| High (≥ 8) | 46 (21.9) | 203 (21.6) | 57 (44.2) | ||
| Mucin production | .002 | .581 | |||
| Absent | 176 (83.8) | 839 (89.1) | 102 (79.1) | ||
| Present | 34 (16.2) | 103 (10.9) | 27 (20.9) |
| SMAD4-loss (n = 210, 16.4%) | SMAD4-low (n = 942, 73.5%) | SMAD4-high (n = 129, 10.1%) | p for difference | p for trend | |
|---|---|---|---|---|---|
| KRAS mutation | .866 | .606 | |||
| Absent | 143 (68.1) | 657 (69.7) | 91 (70.5) | ||
| Present | 67 (31.9) | 285 (30.3) | 38 (29.5) | ||
| BRAF mutation (n = 1,278) | .094 | .330 | |||
| Absent | 196 (93.3) | 906 (96.5) | 122 (94.6) | ||
| Present | 14 (6.7) | 33 (3.5) | 7 (5.4) | ||
| MSI | < .001 | < .001 | |||
| MSS | 204 (97.1) | 889 (94.4) | 93 (72.1) | ||
| MSI | 6 (2.9) | 53 (5.6) | 36 (27.9) | ||
| CIMP | .229 |
.001 | |||
| CIMP-N, P1 | 209 (99.5) | 930 (98.7) | 122 (94.6) | ||
| CIMP-P2 | 1 (0.5) | 12 (1.3) | 7 (5.4) | ||
| MLH1 promoter methylation | < .001 | < .001 | |||
| Unmethylated | 205 (97.6) | 921 (97.8) | 112 (86.8) | ||
| Methylated | 5 (2.4) | 21 (2.2) | 17 (13.2) | ||
| CK7 expression (n = 1,277) | .273 | .120 | |||
| Absent | 186 (89.4) | 868 (92.3) | 121 (93.8) | ||
| Present | 22 (10.6) | 72 (7.7) | 8 (6.2) | ||
| CK20 expression (n = 1,271) | < .001 | < .001 | |||
| Retained | 183 (88.8) | 780 (83.3) | 90 (69.8) | ||
| Loss | 23 (11.2) | 156 (16.7) | 39 (30.2) | ||
| CDX2 expression (n = 1,262) | .001 | .001 | |||
| Retained | 166 (80.6) | 831 (89.4) | 116 (91.3) | ||
| Loss | 40 (19.4) | 98 (10.6) | 11 (8.7) |
| 5-Year PFS |
7-Year CSS |
|||
|---|---|---|---|---|
| HR (95% CI) | p-value | HR (95% CI) | p-value | |
| Stage (III, IV vs I, II) | 4.57 (3.47–6.00) | < .001 | 4.99 (3.38–7.37) | < .001 |
| Grade (G3/4 vs G1/2) | 1.80 (1.27–2.56) | .001 | 1.62 (0.95–2.75) | .077 |
| Post-operative chemotherapy (yes vs no) | 0.63 (0.49–0.81) | < .001 | 0.34 (0.25–0.47) | < .001 |
| Lymphovascular invasion (yes vs no) | 1.83 (1.48–2.26) | < .001 | 2.22 (1.63–3.03) | < .001 |
| SMAD4 expression (loss vs retained) | 1.27 (1.01–1.60) | .042 | 1.45 (1.06–1.99) | .022 |
Values are presented as median (range) or number (%).
Values are presented as median (range) or number (%). MSI, microsatellite instability; MSS, microsatellite stable; CIMP, CpG island methylator phenotype; CIMP-N, CIMP-negative; CIMP-P1, CIMP-positive 1; CIMPP2, CIMP-positive 2; CK, cytokeratin. p-value with Fisher exact test.
PFS, progression-free survival; CSS, cancer-specific survival; HR, hazard ratio; CI, confidence interval.

