 E-submission
Articles
- Page Path
- HOME > J Pathol Transl Med > Volume 59(4); 2025 > Article
-
Original Article
Pancreatic cancer in liquid-based cytology: cytological features and cell block utility from 254 fine-needle aspiration samples -
Jaeyong Min1,2
 , Wookjin Oh1,2, Baek-hui Kim1,2
 -
Journal of Pathology and Translational Medicine 2025;59(4):249-261.
DOI: https://doi.org/10.4132/jptm.2025.05.27
Published online: July 3, 2025
1Korea University College of Medicine, Seoul, Korea
2Department of Pathology, Korea University Guro Hospital, Seoul, Korea
- Correspondence to: Baek-hui Kim, MD, PhD Department of Pathology, Korea University Guro Hospital, 148 Gurodong-ro, Guro-gu, Seoul 08308, Korea Tel: +82-2-2626-1482, Fax: +82-2-2626-1486, E-mail: maelstrom@naver.com
© The Korean Society of Pathologists/The Korean Society for Cytopathology
This is an Open Access article distributed under the terms of the Creative Commons Attribution Non-Commercial License (http://creativecommons.org/licenses/by-nc/4.0) which permits unrestricted non-commercial use, distribution, and reproduction in any medium, provided the original work is properly cited.
Abstract
-
Background
- Despite the increasing use of liquid-based cytology (LBC) for pancreatic cancer diagnosis, relatively few studies have directly examined such research. This study analyzed the cytopathological features of pancreatic cancer in LBC and demonstrated the utility of cell blocks in diagnosing pancreatic lesions.
-
Methods
- A retrospective review identified LBC from 254 pancreatic fine-needle aspirations (FNAs) (221 patients). FNAs were categorized into five subgroups based on cytopathological, clinical, and histopathological findings. Two pathologists evaluated cytological features in LBC samples, cell blocks, and tissue slides. Comparative analysis assessed differences between groups.
-
Results
- Compared to benign lesions, LBC of pancreatic cancer more frequently showed a necrotic background, intermediate to high cellularity, mixed architecture, nuclear/cytoplasmic ratio >0.8, anisonucleosis >4:1, irregular and thick nuclear membranes, multinucleated tumor cells, hyperchromatic nuclei, coarse to clumped chromatin, and a prominent single nucleolus. In cases of conventional pancreatic ductal adenocarcinoma, the palliative treatment subgroup showed a higher incidence of necrotic background than the resection subgroup. In the cell block analysis, tumor cells not identified in LBC slides were detected in 16 FNAs. Additionally, 13 FNAs contributed to differential diagnosis: ancillary tests aided diagnosis in 12 FNAs, while histopathological evaluation of the cell block slide alone was helpful in one case.
-
Conclusions
- The cytological features of pancreatic cancer in LBC are similar to those observed in conventional smears, with a necrotic background suggesting advanced (unresectable) disease. The cell block methodology minimizes tumor cell loss and facilitates differential diagnosis by enabling ancillary testing.
- According to global statistics, pancreatic cancer ranks 11th in cancer incidence and seventh in cancer-related deaths, with a five-year survival rate of approximately 10% and is one of the most lethal malignant neoplasms. Although surgical resection is the only potentially curative treatment, most patients with pancreatic cancer are inoperable at the time of diagnosis [1,2]. Therefore, accurate pathological diagnosis is essential for success of (neoadjuvant) chemotherapy in the treatment of pancreatic cancer, for which the utility of cytopathological diagnosis through endoscopic ultrasound-guided fine-needle aspiration (FNA) has been demonstrated [3-5]. In addition, as approximately 90% of pancreatic neoplasms in adults are histopathologically classified as pancreatic ductal adenocarcinoma and its subtypes [6], the importance of cytopathological diagnosis of pancreatic ductal adenocarcinoma in diagnosing pancreatic malignancies can be easily inferred.
- Traditionally, FNA specimens are prepared as smear slides for cytopathological diagnosis. However, smear slides have several limitations, including difficulty in evenly spreading cellular material on the slide, a relatively high possibility of cellular degeneration/artifacts due to air-drying, and diagnostic challenges when tumor cells are obscured by necrotic debris or blood. To overcome these issues, liquid-based cytology (LBC) has been developed and is now widely used [7-9]. Several studies have compared the diagnostic rates of smear cytology and LBC for pancreatic FNA, demonstrating diagnostic value and providing evidence for the use of LBC in the cytopathological diagnosis of pancreatic lesions [10-12].
- Therefore, the number of institutions using LBC for cytopathological diagnosis of pancreatic lesions is increasing. However, compared to the relatively well-known cytological findings of pancreatic ductal adenocarcinoma in conventional smear cytology, there are fewer studies on the cytological features of LBC, especially those analyzing cell blocks [11,13-16]. Therefore, in this study, we investigated the cytological characteristics of pancreatic ductal adenocarcinoma in LBC through a review of FNA samples of pancreatic lesions. Additionally, we analyzed the cytological characteristics of pancreatic cancer at advanced stages, where surgical resection was not possible. Furthermore, we demonstrated the usefulness of cell blocks, an advantage of LBC, in diagnosis.
INTRODUCTION
- FNA selection and specimen processing
- Through a retrospective electronic medical record search, we collected a list of 273 FNA-LBC specimen (239 patients) who underwent FNA for pancreatic lesions at a single institution (Korea University Guro Hospital, Seoul, Republic of Korea) between January 2016 and June 2023. FNA samples were cytopathologically diagnosed in four categories: ‘malignant cell present (MCP),’ ‘suspicious for malignancy (SFM),’ ‘atypical cell present (ACP),’ or ‘negative for malignancy (NFM).’ Specimens inadequate for diagnosis were reported as ‘Insufficient for diagnosis.’ All diagnoses of NFM from this institution in this time period were included in the study. To minimize false positives, we excluded FNA samples that met all the following criteria: (1) diagnosed as ACP or higher, (2) no histopathological diagnosis, and (3) fewer than 6 months of follow-up. FNA samples from which there were damaged slides and those reported as ‘Insufficient for diagnosis’ were also excluded, resulting in analysis of 254 FNAs (221 patients) in the study. Among the 221 patients, 190 (86.0%) underwent FNA once, 29 (13.1%) underwent FNA twice on the same lesion, and two (0.9%) underwent FNA three times on the same lesion. LBC samples were prepared using the ThinPrep non-gynecological sample preparation protocol with a ThinPrep 2000 or 5000 processor (Hologic Inc., Marlborough, MA, USA) and were stained with Papanicolaou stain. Cell blocks for pancreatic FNA were prepared during routine diagnostic processing, following institutional protocols. Aspirated material was initially collected in a tube containing Cytolyt solution (Hologic Inc.). Upon receipt in the laboratory, the specimens were centrifuged at 3,000 rpm for 5 minutes. After centrifugation, the supernatant was discarded. If a visible pellet (cellular sediment) was present, a cell block was prepared; if no visible pellet was observed, cell block preparation was not possible due to insufficient cellular material. The pellets were processed similarly to surgical specimens: they were formalin-fixed, paraffin-embedded, sectioned, and stained with hematoxylin and eosin for histological evaluation.
- Classification of FNAs
- Cytopathological diagnoses of MCP or SFM were assigned to group 1 (161 FNA samples; 132 MCP and 29 SFM), and those of NFM or ACP were assigned to group 2 (93 FNA samples; 61 NFM and 32 ACP). Group 1 was further subdivided based on histopathological confirmation into three subgroups: group 1-1 (41 FNA samples; 33 MCP and 8 SFM), consisting of histopathologically confirmed conventional pancreatic ductal adenocarcinoma; group 1-2 (12 FNA samples; 10 MCP and 2 SFM), consisting of histologically confirmed malignant neoplasms other than conventional pancreatic ductal adenocarcinoma, such as adenosquamous carcinoma, squamous cell carcinoma, and sarcomatoid carcinoma, as well as neuroendocrine tumor and lymphoma; and group 1-3 (108 FNA samples; 89 MCP and 19 SFM), consisting of cases cytopathologically suspicious for pancreatic ductal adenocarcinoma without histopathological confirmation. FNA samples in group 2 were further divided into group 2-1 (benign, 17 FNAs), including cytopathological diagnoses of NFM with no neoplasm detected during at least 6 months of follow-up and group 2-2 (probable benign, 76 FNA samples; 44 NFM and 32 ACP) for the remaining (Fig. 1).
- Clinical information collection and slide review
- Clinical information of sex, age, radiological features of the lesion, FNA method, FNA site, and histopathological results was collected from an electronic medical record review. Two pathologists (BHK and JM) independently reviewed the LBC slides and compiled cytological features without considering the original diagnostic interpretations. The following cytological features were examined from each FNA-LBC: ‘background,’ ‘gastrointestinal contaminants,’ ‘cellularity,’ ‘architecture,’ ‘nuclear/cytoplasmic ratio,’ ‘cytoplasm,’ ‘anisonucleosis,’ ‘nuclear membrane irregularity,’ ‘nuclear membrane thickness,’ ‘multinucleated cells’ (not multinucleated histiocytic giant cells), ‘hyperchromatic nuclei,’ ‘chromatin pattern,’ ‘number of nucleoli,’ ‘prominent nucleoli,’ and ‘nuclear inclusion.’ For cytologic evaluation, the threshold of anisonucleosis >4:1 was adopted based on previously reported standards [13,14]. Large nuclei and macronucleoli have been frequently observed in malignant pancreatic cytology in previous studies [11,13,14,16]. To enhance reproducibility, we replaced the assessment of nuclear enlargement with a semi-quantitative evaluation of the nuclear/cytoplasmic ratio, categorized into three groups (<0.5, 0.5–0.8, and >0.8) based on visual estimation. Nucleolar prominence was assessed separately according to its visibility at different magnifications. When there were discrepancies in cytological findings, a consensus was reached through discussion between the two pathologists (BHK and JM). Cell block slides, tissue slides, and their respective immunohistochemical and special stain slides were reviewed when available. The following characteristics were compiled for the cell block slide review: ‘immunohistochemical/special stains,’ ‘molecular tests,’ ‘detection of malignant cells missed on the LBC slide,’ ‘aid in differential diagnosis,’ and ‘potential for standalone diagnosis.’
- Statistical analysis
- All statistical analyses were performed using SPSS ver. 27 (IBM Corp., Armonk, NY, USA). Clinical information was analyzed on a per-patient basis. Among them, age was analyzed using one-way analysis of variance, and post-hoc comparisons were conducted using Tukey’s honestly significant difference test. Other clinical variables, as well as cell block status, were summarized descriptively without statistical testing. Cytological and histological findings were collected as categorical data on a for each FNA sample. To assess differences in cytological features between groups, Pearson’s chi-square test, Fisher’s exact test, or Fisher-Freeman-Halton exact test were applied as appropriate. Statistical significance was defined as p < .05.
MATERIALS AND METHODS
- Characteristics of the study patients
- The clinical characteristics of the 221 patients included in the study are summarized in Table 1. Male patients accounted for a higher proportion (58.4%) than female patients (41.6%). Age differed significantly among diagnostic groups, with post-hoc analysis revealing a significantly lower mean age in group 2-1 than in group 1-1 (p = .001), group 1-2 (p = .022), group 1-3 (p < .001), and group 2-2 (p = .001). Among the total 221 patients, endoscopic ultrasound-guided FNA was performed in 219 (99.1%), ultrasound-guided percutaneous FNA in one patient, and intraoperative FNA in one patient. According to imaging findings, 87.3% of the lesions were solid, with this proportion being higher in group 1. In contrast, 12.7% of the lesions were cystic or solid-cystic, with a higher proportion in group 2. The cytopathological diagnoses of the 31 patients (64 FNAs) who underwent FNA two or more times are summarized in Supplementary Table S1. For 10 patients (32.3%), the cytopathological diagnosis was consistent between the first and subsequent FNA. However, 17 patients (54.8%) were diagnosed with a higher grade on a subsequent FNA than the initial cytopathological diagnosis, while the remaining four patients (12.9%) were diagnosed with a lower grade in subsequent FNA.
- Cytological features of pancreatic ductal adenocarcinoma in LBC
- The comparison of cytological characteristics between group 1 and group 2 is presented in Table 2. FNA samples assigned to group 1 showed a more frequent necrotic background and gastric contaminants than those in group 2. Additionally, the following cytological features were observed at significantly higher frequencies in group 1 than in group 2: intermediate to high cellularity; mixed architectural pattern; nuclear/cytoplasmic ratio of 0.8 or higher; anisonucleosis of 4:1 or greater; irregular, thick nuclear membrane; multinucleated cells other than histiocytic giant cells; hyperchromatic nuclei; coarse to clumped chromatin pattern; and prominent single nucleoli. Comparison of the features between group 1-1 and group 2-1 are summarized in Supplementary Table S2. They showed patterns similar to previous findings, but there were no significant differences between the groups in terms of background, architecture, and multinucleated cells. The presence of nuclear inclusions was also investigated for all FNA samples, but none were identified.
- Cytological features of advanced (unresectable) pancreatic cancer in LBC
- Group 1-1 contained five FNA samples (12.2%) from patients who underwent radical resection of a primary lesion without neoadjuvant chemotherapy, 14 FNA samples (34.1%) from patients who underwent radical resection after neoadjuvant chemotherapy, and 22 FNA samples (53.7%) from patients who received palliative chemotherapy/radiotherapy. To investigate the cytological characteristics of advanced pancreatic cancer, a comparative analysis was conducted between the findings from the 19 samples from patients who underwent radical resection and the findings from the 22 FNA samples from patients who received palliative chemo/radiotherapy (Table 3). A necrotic background was observed at a significantly higher frequency in the subgroup that received palliative treatment than in the subgroup that underwent radical resection (p = .004), whereas no significant differences were observed for other cytological features. Additionally, the 161 FNA samples assigned to group 1 were divided into a ‘pure solid subgroup’ of 152 (94.4%) without cystic components observed on imaging and a ‘non-pure solid subgroup’ of nine (5.6%) with cystic components. Comparison of the cytological features between these subgroups showed no significant differences (Supplementary Table S3).
- Utility of cell block in LBC for pancreatic lesions
- Cell blocks were successfully prepared in 230 of the 254 FNA samples (90.6%). By subgroup, cell blocks were produced in 40 of 41 FNA samples in group 1-1 (97.6%), 12 of 12 in group 1-2 (100%), 102 of 108 in group 1-3 (94.4%), 13 of 17 in group 2-1 (76.5%), and 63 of 76 in group 2-2 (82.9%). Among these, five cell blocks could not be reviewed due to poor slide quality or insufficient material, resulting in 225 evaluable cell blocks. The use of cell blocks for cytopathological diagnosis is summarized in Table 4. In group 1, 112 FNA samples (74.2%) allowed a cytopathological diagnosis using cell block slides alone. Also, for 16 FNA samples (10.6%), malignant cells were identified only in the cell block slides, leading to a diagnosis of SFM or higher. Among the 225 cell blocks, special stains and immunohistochemical stains were performed in 14 cases (6.2%), and molecular tests in three cases (1.3%). Overall, differential diagnosis was aided by cell block analysis in 13 FNA samples (5.8%): 12 benefited from ancillary staining or molecular testing and one from histopathological evaluation of the cell block slide alone (nine from group 1-2, three from group 1-3, and one from group 2-1). These analyses led to the diagnoses of neuroendocrine tumors, lymphomas, metastatic carcinomas, and Mycobacterium tuberculosis infection, in addition to rare histologic subtypes of pancreatic ductal adenocarcinoma. The detailed results are provided in Supplementary Table S4.
RESULTS
- In this study, we evaluated the cytological characteristics of pancreatic cancer in LBC by extensively reviewing the slides obtained from pancreatic FNA samples. Furthermore, by correlating cytological findings with clinical information, we present the cytological features of advanced pancreatic cancer in LBC. Additionally, we compiled and reported our single-institution experience with the use of cell blocks in the diagnosis of pancreatic lesions. Although cell blocks are an advantage of LBC, there have been few studies on their application in pancreatic lesions [17-19].
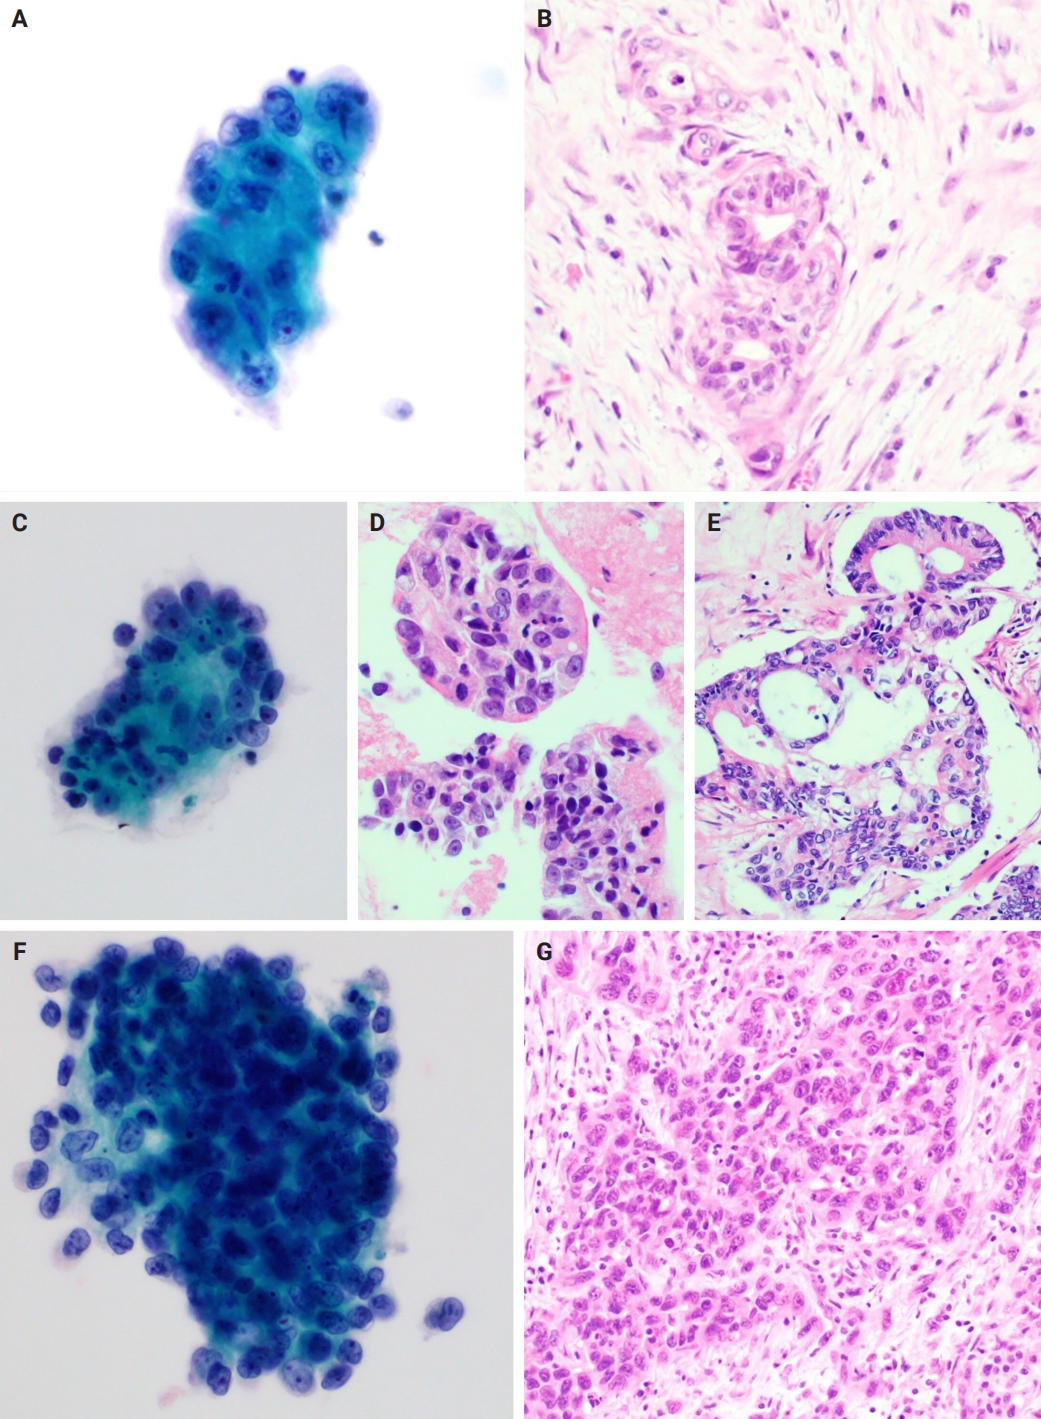
- The cytological characteristics of pancreatic ductal adenocarcinoma in LBC identified in this study (Table 2, Fig. 2) generally aligned with the features observed on the smear slides and those reported in other LBC studies [11,13-16]. Supplementary Table S2 further supports these findings by directly comparing cytological features between histologically confirmed conventional pancreatic ductal adenocarcinoma and definitively benign lesions. In this analysis, the malignant group consistently exhibited features such as high nuclear/cytoplasmic ratio, hyperchromatic nuclei, nuclear pleomorphism, and coarse chromatin—characteristics that have also been repeatedly reported in previous studies. This concordance reinforces the diagnostic value of these features in differentiating pancreatic malignancy from benign conditions in LBC preparations.
- Beyond these diagnostic markers, compared to smear cytology, LBC is significantly less affected by background interference. In this study, 99 FNAs (61.5%) in group 1, which primarily consisted of pancreatic ductal adenocarcinomas (with a small number of lymphomas, neuroendocrine neoplasms, and metastatic carcinomas), showed a clear background. In contrast, a mucinous background was observed in the slides from only four FNAs (2.5%), and no bloody background was observed. Considering all 254 FNAs, the percentage of slides with clear backgrounds increased to 67.7%. This pattern was also confirmed in a study by Chun et al. [11], who directly compared smear cytology and LBC of the pancreas. In their study, a bloody background was observed in 85.2% of the smear slides; only 1.8% of our LBC slides showed this feature. Similarly, the percentage with a mucinous background was significantly reduced in LBC slides. This is due to the use of hemolytic preservative solutions during specimen processing in LBC, along with rotation/vortex processes that separate mucus, blood, and other debris from the cells of interest and the use of a density gradient or filters to separate these components. These features are advantages of LBC [7].
- While one report suggests that background necrosis is not common in FNA cytology of well-differentiated pancreatic ductal adenocarcinoma [13], it is generally recognized as a cytological feature indicative of pancreatic ductal adenocarcinoma in both smear and LBC preparations [14,16]. In our study, necrosis was significantly more frequent in group 1 than in group 2 (p < .001), with necrotic debris typically measuring several to dozens of tumor cells (Fig. 2J). Comparing group 1-1 and group 2-1, although necrosis was more frequently identified in group 1-1 (26.8%) than in group 2-1 (11.8%), the difference was not significant (p = .307), likely due to the small number of FNA samples, particularly in group 2-1.
- Further analysis within group 1-1 revealed that necrosis was more frequent in the palliative subgroup than in those who underwent radical resection (p = .004). Notably, all 41 FNA samples in group 1-1 were derived from different patients, ensuring that no clinical information was duplicated across cases. Among the five FNAs from patients who underwent resection without neoadjuvant chemotherapy, histopathological grading revealed one well-differentiated, two moderately differentiated, and two poorly differentiated adenocarcinomas (Fig. 3). In the 14 patients who underwent resection following neoadjuvant chemotherapy, there were four well-differentiated, eight moderately differentiated, and two poorly differentiated cases. In other words, since moderately and poorly differentiated tumors accounted for 73.7% of the resection (curative treatment) subgroup, the low incidence of necrosis in this group is unlikely to be explained by a predominance of well-differentiated cancers. However, this counterargument has limitations, as histomorphological changes induced by neoadjuvant therapy cannot be excluded [20,21]. In addition, the number of FNAs in each subgroup was relatively small, and the data originated from a single institution. Taken together, these findings suggest that the presence of necrosis in FNA-LBC is a cytological indicator of advanced or unresectable pancreatic cancer. Nonetheless, this feature should be interpreted cautiously, as it also might be influenced by other clinical factors such as tumor size.
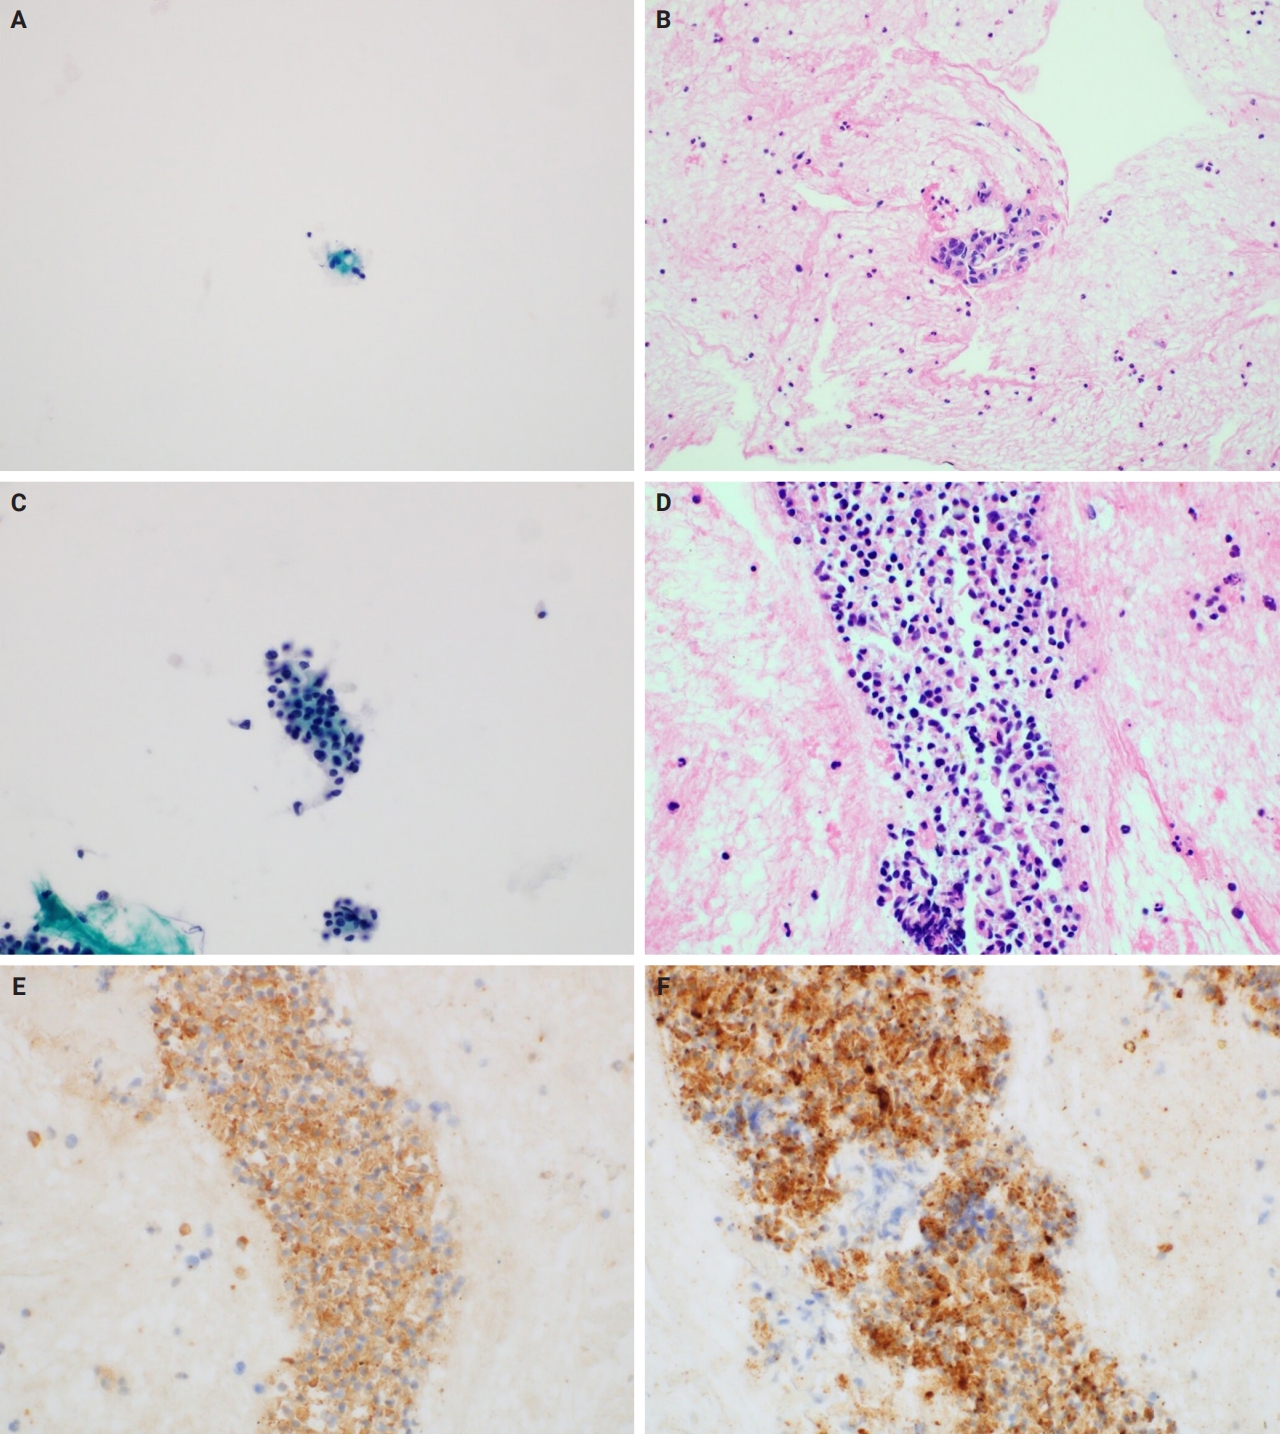
- In the analysis of cell blocks, 16 FNA samples (10.6%) were identified in malignant cell clusters, not observed in LBC slides, on cell block slides. This suggests that LBC allows more efficient and diagnostically useful slide preparation than the somewhat wasteful sample preparation for smear cytology. Additionally, the findings from the cell block slides, along with immunohistochemical and special stains, aided in the differential diagnoses. In particular, cell blocks have been found to be helpful in the diagnosis of neuroendocrine tumors and lymphomas in the pancreas, which require immunostains for accurate diagnosis (Fig. 4). For these reasons, we recommend that, if possible, cell blocks be routinely prepared in FNA-LBC of pancreatic lesions. However, immunostaining in cell blocks might show differences in staining quality compared to immunostaining in formalin-fixed paraffin-embedded tissue. Additionally, there are limitations in evaluating immunoarchitecture owing to the random distribution of tumor cells within the cell block [22,23].
- As shown in Table 4, molecular tests were performed using cell blocks from three FNAs (1.3%). These included a peptide nucleic acid-clamping real-time polymerase chain reaction test for KRAS mutation detection (group 1-1), an Epstein-Barr virus–encoded RNA 1 in situ hybridization test (group 1-2), and a real-time polymerase chain reaction test for detecting Mycobacterium tuberculosis/nontuberculous mycobacteria (group 2-1). These tests confirmed the KRAS codon 12 mutations and Mycobacterium tuberculosis infection, respectively. The utility of molecular testing using cell blocks has been reported previously [24-26]. Particularly in the current landscape, with ongoing studies into drugs targeting KRAS-mutated pancreatic cancers [27-30], the necessity for LBC and cell blocks in the diagnosis of pancreatic cancer is expected to increase further.
- While each LBC and cell block preparations offer distinct advantages in cytological evaluation, certain differences and limitations must be considered during interpretation. LBC slides generally provide clearer nuclear detail due to a cleaner background with minimal blood or necrotic debris, facilitating the evaluation of nuclear features. However, they often lack the architectural context necessary for assessing glandular formation or stromal invasion, which is better preserved in surgical tissue sections. Although cell blocks can retain architectural features and provide material for ancillary testing, differences in specimen characteristics—such as smaller, fragmented cellular aggregates rather than intact tissue structures—can lead to processing artifacts. As a result, cytologic atypia, such as nuclear hyperchromasia and pleomorphism, can appear exaggerated compared to formalin-fixed tissue sections. Therefore, cautious interpretation of cell block slides is required to avoid overestimation of atypia.
- As a limitation of this study, owing to its retrospective nature, there is a possibility of potential bias in the interpretation of results. Additionally, as this was a single-institution study, there was a shortage of FNAs, particularly those with benign findings. Consequently, even if the results of multiple FNAs in the same patient were contradictory, all were included in the study. To overcome these limitations, an independent slide review was conducted separate from the existing cytopathological diagnoses. Furthermore, to address the limited number of FNAs, subgroups were systematically divided, and 17 FNAs confirmed as negative (group 2-1) were used in the analysis.
- In conclusion, the cytological features of pancreatic ductal adenocarcinoma in LBC were similar to those in conventional smear cytology, but with a dramatic reduction in the masking effect caused by blood and mucin. In addition, scattered necrotic debris was indicative of advanced (unresectable) pancreatic cancer. Moreover, cell blocks enabled the identification of tumor cells not included in LBC slides; special stains, immunohistochemical stains, and molecular tests on these blocks aided in differential diagnosis and are expected to play a role in future targeted therapies for pancreatic cancer.
DISCUSSION
Supplementary Information
Ethics Statement
This study was conducted in accordance with the Declaration of Helsinki and was approved by the Institutional Review Board of Korea University Guro Hospital (approval number: 2024GR0120; date of approval: March 28, 2024) and formal written informed consent was not required with a waiver from the Institutional Review Board of Korea University Guro Hospital.
Availability of Data and Material
The data that support the findings of this study are available from the corresponding author upon reasonable request.
Code Availability
Not applicable.
Author Contributions
Conceptualization: JM, BHK. Formal analysis: JM, WO, BHK. Investigation: JM, BHK. Methodology: JM, BHK. Supervision: BHK. Visualization: JM, BHK. Writing—original draft: JM, BHK. Writing—review and editing: JM, WO, BHK. Approval of final manuscript: all authors.
Conflicts of Interest
The authors declare that they have no potential conflicts of interest to disclose.
Funding Statement
No funding to declare.


| Variable | Total (n = 221) |
Group 1 (n = 159) |
Group 2 (n = 62) |
|||
|---|---|---|---|---|---|---|
| Group 1-1 (n = 41) | Group 1-2 (n = 12) | Group 1-3 (n = 106) | Group 2-1 (n = 13) | Group 2-2 (n = 49) | ||
| Sex (male/female) | 129 (58.4)/92 (41.6) | 19 (46.3)/22 (53.7) | 6 (50.0)/6 (50.0) | 66 (62.3)/40 (37.7) | 11 (84.6)/2 (15.4) | 27 (55.1)/22 (44.9) |
| Age (yr) | 67.0 ± 11.8 | 66.6 ± 10.7 | 66.0 ± 13.8 | 69.6 ± 9.8 | 52.4 ± 15.5 | 65.8 ± 12.5 |
| Radiologic featureb | ||||||
| Solid | 193 (87.3) | 39 (95.1) | 12 (100) | 99 (93.4) | 7 (53.8) | 36 (73.5) |
| Solid-cystic | 12 (5.4) | 2 (4.9) | 0 | 4 (3.8) | 1 (7.7) | 5 (10.2) |
| Cystic | 16 (7.3) | 0 | 0 | 3 (2.8) | 5 (38.5) | 8 (16.3) |
| Specimen collection (EUS-guided/other)c | 219 (99.1)/2 (0.9) | 41 (100)/0 (0) | 12 (100)/0 (0) | 106 (100)/0 (0) | 11 (84.6)/2 (15.4) | 49 (100)/0 (0) |
| Site of FNA | ||||||
| Head and neck (including uncinate process) | 101 (45.7) | 16 (39.0) | 6 (50.0) | 43 (40.6) | 6 (46.1) | 30 (61.2) |
| Body | 82 (37.1) | 18 (43.9) | 5 (41.7) | 42 (39.6) | 2 (15.4) | 15 (30.6) |
| Tail | 38 (17.2) | 7 (17.1) | 1 (8.3) | 21 (19.8) | 5 (38.5) | 4 (8.2) |
Values are presented as number (%) or mean ± standard deviation.
EUS, endoscopic ultrasound; FNA, fine-needle aspiration.
aTo prevent duplication of clinical information, data were analyzed per patient; for those with multiple FNAs assigned to different groups, classification was based on the group with the most severe cytological diagnosis;
bBased on the findings of computed tomography scan and/or magnetic resonance imaging;
c1 percutaneous ultrasound-guided and 1 intraoperative.
| Cytological feature | Group 1 (n = 161) | Group 2 (n = 93) | p-value |
|---|---|---|---|
| Background | <.001 | ||
| Non-necrotica | 126 (78.3) | 89 (95.7) | |
| Necrotic | 35 (21.7) | 4 (4.3) | |
| Gastrointestinal contaminants | .045 | ||
| Not identified | 59 (36.7) | 45 (48.4) | |
| Gastric | 54 (33.5) | 17 (18.3) | |
| Duodenal | 48 (29.8) | 31 (33.3) | |
| Cellularity | <.001 | ||
| No pancreatic ductal componentb | 0 | 20 (21.5) | |
| Low cellularity | 61 (37.9) | 56 (60.2) | |
| Intermediate cellularity | 46 (28.6) | 13 (14.0) | |
| High cellularity | 54 (33.5) | 4 (4.3) | |
| Architecturec | <.001 | ||
| Mixed pattern | 76 (47.2) | 15 (20.5) | |
| Mainly single cells | 14 (8.7) | 2 (2.7) | |
| Mainly small clusters | 66 (41.0) | 51 (69.9) | |
| Mainly large sheets | 5 (3.1) | 5 (6.9) | |
| Nuclear/cytoplasmic ratioc | <.001 | ||
| <0.5 | 0 | 4 (5.5) | |
| 0.5–0.8 | 53 (32.9) | 50 (68.5) | |
| >0.8 | 108 (67.1) | 19 (26.0) | |
| Cytoplasmc | .127 | ||
| Fine | 150 (93.2) | 71 (97.2) | |
| Clear | 1 (0.6) | 0 | |
| Foamy | 0 | 1 (1.4) | |
| Bubbly | 10 (6.2) | 1 (1.4) | |
| Anisonucleosisc | <.001 | ||
| <2:1 | 7 (4.3) | 55 (75.3) | |
| 2:1–4:1 | 33 (20.5) | 14 (19.2) | |
| >4:1 | 121 (75.2) | 4 (5.5) | |
| Nuclear membrane irregularityc | <.001 | ||
| Smooth | 7 (4.3) | 42 (57.5) | |
| Irregular | 147 (91.4) | 31 (42.5) | |
| Spiculate | 7 (4.3) | 0 | |
| Nuclear membrane thicknessc | <.001 | ||
| Inconspicuous | 3 (1.9) | 17 (23.3) | |
| Thin | 75 (46.6) | 53 (72.6) | |
| Thick and prominent | 83 (51.5) | 3 (4.1) | |
| Multinucleated cellsc,d | <.001 | ||
| Not identified | 129 (80.1) | 72 (98.6) | |
| Present | 32 (19.9) | 1 (1.4) | |
| Hyperchromatic nucleic | <.001 | ||
| Not identified | 16 (9.9) | 43 (58.9) | |
| Present | 145 (90.1) | 30 (41.1) | |
| Chromatin patternc | <.001 | ||
| Fine | 8 (5.0) | 45 (61.7) | |
| Coarse | 72 (44.7) | 22 (30.1) | |
| Clumped | 76 (47.2) | 3 (4.1) | |
| Smudged | 5 (3.1) | 3 (4.1) | |
| No. of nucleolic | <.001 | ||
| No visible nucleoli | 58 (36.0) | 53 (72.6) | |
| Single | 93 (57.8) | 20 (27.4) | |
| Multiple | 10 (6.2) | 0 | |
| Prominent nucleolic | <.001 | ||
| No visible nucleoli | 58 (36.0) | 53 (72.6) | |
| Visible at 400× magnification | 9 (5.6) | 7 (9.6) | |
| Visible at 200× or 100× magnification | 93 (57.8) | 13 (17.8) | |
| Visible at 40× or lower magnification | 1 (0.6) | 0 |
Values are presented as number (%).
aGroup 1 (99 clear, 23 inflammatory, 4 mucinous and no bloody background); group 2 (73 clear, 14 inflammatory, 2 mucinous and no bloody background);
bThis category encompasses fine-needle aspirations (FNAs) where no cellular components were observed and FNAs where only inflammatory cells were observed;
cThe 20 FNAs in which a pancreatic ductal component is not observed are excluded from the analysis;
dMultinucleated histiocytic giant cells are excluded.
| Cytological feature | Curative (n = 19) | Palliative (n = 22) | p-value |
|---|---|---|---|
| Background | .004 | ||
| Non-necrotica | 18 (94.7) | 12 (54.5) | |
| Necrotic | 1 (5.3) | 10 (45.5) | |
| Gastrointestinal contaminants | .211 | ||
| Not identified | 6 (31.6) | 11 (50.0) | |
| Gastric | 7 (36.8) | 9 (40.9) | |
| Duodenal | 6 (31.6) | 2 (9.1) | |
| Cellularity | .785 | ||
| Low cellularity | 10 (52.6) | 9 (40.9) | |
| Intermediate cellularity | 5 (26.3) | 8 (36.4) | |
| High cellularity | 4 (21.1) | 5 (22.7) | |
| Architecture | .214 | ||
| Mixed pattern | 11 (57.9) | 10 (45.5) | |
| Mainly single cells | 2 (10.5) | 0 | |
| Mainly small clusters | 6 (31.6) | 11 (50.0) | |
| Mainly large sheets | 0 | 1 (4.5) | |
| Nuclear/cytoplasmic ratio | .138 | ||
| 0.5–0.8 | 3 (15.8) | 8 (36.4) | |
| >0.8 | 16 (84.2) | 14 (63.6) | |
| Cytoplasm | .463 | ||
| Fine | 18 (94.7) | 22 (100) | |
| Clear | 0 | 0 | |
| Foamy | 0 | 0 | |
| Bubbly | 1 (5.3) | 0 | |
| Anisonucleosis | .592 | ||
| <2:1 | 1 (5.3) | 0 | |
| 2:1–4:1 | 5 (26.3) | 5 (22.7) | |
| >4:1 | 13 (68.4) | 17 (77.3) | |
| Nuclear membrane irregularity | .490 | ||
| Smooth | 0 | 2 (9.1) | |
| Irregular | 19 (100) | 20 (90.9) | |
| Spiculate | 0 | 0 | |
| Nuclear membrane thickness | .177 | ||
| Inconspicuous | 0 | 0 | |
| Thin | 9 (47.4) | 15 (68.2) | |
| Thick and prominent | 10 (52.6) | 7 (31.8) | |
| Multinucleated cellsb | .588 | ||
| Not identified | 17 (89.5) | 21 (95.5) | |
| Present | 2 (10.5) | 1 (4.5) | |
| Hyperchromatic nuclei | >.999 | ||
| Not identified | 4 (21.1) | 4 (18.2) | |
| Present | 15 (78.9) | 18 (81.8) | |
| Chromatin pattern | .869 | ||
| Fine | 1 (5.3) | 1 (4.5) | |
| Coarse | 6 (31.6) | 9 (40.9) | |
| Clumped | 12 (63.1) | 12 (54.6) | |
| Smudged | 0 | 0 | |
| No. of nucleoli | .737 | ||
| No visible nucleoli | 6 (31.6) | 8 (36.4) | |
| Single | 12 (63.1) | 14 (63.6) | |
| Multiple | 1 (5.3) | 0 | |
| Prominent nucleoli | >.999 | ||
| No visible nucleoli | 6 (31.6) | 8 (36.4) | |
| Visible at 400× magnification | 1 (5.3) | 1 (4.5) | |
| Visible at 200× or 100× magnification | 12 (63.1) | 13 (59.1) | |
| Visible at 40× or lower magnification | 0 | 0 |
| Variable | Total (n = 225a) |
Group 1 (n = 151) |
Group 2 (n = 74) |
|||
|---|---|---|---|---|---|---|
| Group 1-1 (n = 40) | Group 1-2 (n = 11) | Group 1-3 (n = 100) | Group 2-1 (n = 13) | Group 2-2 (n = 61) | ||
| Assistance in diagnosis | ||||||
| Cytopathological diagnosis can be made without a cell block | 123 (81.5c) | 37 (92.5) | 2 (18.2) | 84 (84.0) | N/A | N/A |
| Cell block helps in determining the presence of malignant cellsb | 16 (10.6c) | 3 (7.5) | 0 (0.0) | 13 (13.0) | N/A | N/A |
| Cell block helps in differential histopathological diagnosis | 13 (5.8) | 0 (0.0) | 9 (81.8) | 3 (3.0) | 1 (7.7) | 0 |
| With the cell block alone | ||||||
| Cytopathological diagnosis can be made | 112 (74.2c) | 27 (67.5) | 1 (9.1) | 84 (84.0) | N/A | N/A |
| Cytopathological diagnosis cannot be made | 39 (25.8c) | 13 (32.5) | 10 (90.9) | 16 (16.0) | N/A | N/A |
| IHC/Special staining | ||||||
| Neither was performed | 211 (93.8) | 39 (97.5) | 3 (27.3) | 96 (96.0) | 12 (92.3) | 61 (100) |
| Only IHC performed | 7 (3.1) | 0 | 5 (45.4) | 2 (2.0) | 0 | 0 |
| Only special staining performed | 2 (0.9) | 1 (2.5) | 0 | 0 | 1 (7.7) | 0 |
| Both were performed | 5 (2.2) | 0 | 3 (27.3) | 2 (2.0) | 0 | 0 |
| Molecular testing | ||||||
| Not performed | 222 (98.7) | 39 (97.5) | 10 (90.9) | 100 (100) | 12 (92.3) | 61 (100) |
| Performed | 3 (1.3) | 1 (2.5) | 1 (9.1) | 0 | 1 (7.7) | 0 |
Values are presented as number (%).
IHC, immunohistochemistry; N/A, not applicable.
aOf the 254 fine-needle aspirations (FNAs), 24 FNAs where cell blocks were not produced and five FNAs that could not be reviewed were excluded from the analysis;
bWith only the liquid-based cytology slide, a diagnosis is equivalent to or below ‘atypical cell present’. However, when considering the cell block slide, a diagnosis of ‘suspicious for malignancy’ or higher can be made;
cThese are the percentages calculated based on the 151 FNAs of group 1.
- 1. Rawla P, Sunkara T, Gaduputi V. Epidemiology of pancreatic cancer: global trends, etiology and risk factors. World J Oncol 2019; 10: 10-27. ArticlePubMedPMC
- 2. Strobel O, Neoptolemos J, Jager D, Buchler MW. Optimizing the outcomes of pancreatic cancer surgery. Nat Rev Clin Oncol 2019; 16: 11-26. ArticlePubMedPDF
- 3. Brugge W, Dewitt J, Klapman JB, et al. Techniques for cytologic sampling of pancreatic and bile duct lesions. Diagn Cytopathol 2014; 42: 333-7. ArticlePubMed
- 4. Micames C, Jowell PS, White R, et al. Lower frequency of peritoneal carcinomatosis in patients with pancreatic cancer diagnosed by EUS-guided FNA vs. percutaneous FNA. Gastrointest Endosc 2003; 58: 690-5. ArticlePubMed
- 5. Okasha HH, Naga MI, Esmat S, et al. Endoscopic ultrasound-guided fine needle aspiration versus percutaneous ultrasound-guided fine needle aspiration in diagnosis of focal pancreatic masses. Endosc Ultrasound 2013; 2: 190-3. ArticlePubMedPMC
- 6. Klimstra DS, Gill AJ, Washington MK. Tumours of the pancreas: introduction. In: WHO Classification of Tumours Editorial Board, ed. World Health Organization classification of tumours, digestive system tumours. 5th ed. Lyon: International Agency for Research on Cancer, 2019; 298-9.
- 7. Hoda RS, VandenBussche C, Hoda SA. Diagnostic liquid-based cytology. Berlin: Springer, 2017; 1-12.
- 8. Arbyn M, Bergeron C, Klinkhamer P, Martin-Hirsch P, Siebers AG, Bulten J. Liquid compared with conventional cervical cytology: a systematic review and meta-analysis. Obstet Gynecol 2008; 111: 167-77. ArticlePubMed
- 9. Fadda G, Rossi ED. Liquid-based cytology in fine-needle aspiration biopsies of the thyroid gland. Acta Cytol 2011; 55: 389-400. ArticlePubMedPDF
- 10. Ko SH, Pyo JS, Son BK, Lee HY, Oh IW, Chung KH. Comparison between conventional smear and liquid-based preparation in endoscopic ultrasonography-fine needle aspiration cytology of pancreatic lesions. Diagnostics (Basel) 2020; 10: 293.ArticlePubMedPMC
- 11. Chun JW, Lee K, Lee SH, et al. Comparison of liquid-based cytology with conventional smear cytology for EUS-guided FNA of solid pancreatic masses: a prospective randomized noninferiority study. Gastrointest Endosc 2020; 91: 837-46. ArticlePubMed
- 12. Itonaga M, Murata SI, Hatamaru K, et al. Diagnostic efficacy of smear plus liquid-based cytology for EUS-FNA of solid pancreatic lesions: a propensity-matched study. Medicine (Baltimore) 2019; 98: e15575. ArticlePubMedPMC
- 13. Lin F, Staerkel G. Cytologic criteria for well differentiated adenocarcinoma of the pancreas in fine-needle aspiration biopsy specimens. Cancer 2003; 99: 44-50. ArticlePubMed
- 14. Layfield LJ, Jarboe EA. Cytopathology of the pancreas: neoplastic and nonneoplastic entities. Ann Diagn Pathol 2010; 14: 140-51. ArticlePubMed
- 15. Taira T, Kawahara A, Yamaguchi T, et al. Morphometric image analysis of pancreatic disease by ThinPrep liquid-based cytology. Diagn Cytopathol 2012; 40: 970-5. ArticlePubMed
- 16. Kiso Y, Matsuda Y, Esaka S, et al. Cytological scoring for pancreatic specimens obtained by endoscopic ultrasound-guided fine needle aspiration. Cytopathology 2022; 33: 206-15. ArticlePubMedPDF
- 17. Kopelman Y, Marmor S, Ashkenazi I, Fireman Z. Value of EUS-FNA cytological preparations compared with cell block sections in the diagnosis of pancreatic solid tumours. Cytopathology 2011; 22: 174-8. ArticlePubMed
- 18. Ardengh JC, Lopes CV, Venco FE, Machado MA. Diagnosis of pancreatic solid pseudopapillary neoplasms using cell-blocks and immunohistochemical evaluation of endoscopic ultrasound-guided fine needle aspiration biopsy specimens. Cytopathology 2021; 32: 50-6. ArticlePubMedPDF
- 19. Singh P, Kumar P, Rohilla M, et al. Fine needle aspiration cytology with the aid of immunocytochemistry on cell-block confirms the diagnosis of solid pseudopapillary neoplasm of the pancreas. Cytopathology 2021; 32: 57-64. ArticlePubMedPDF
- 20. Sethi D, Sen R, Parshad S, Khetarpal S, Garg M, Sen J. Histopathologic changes following neoadjuvant chemotherapy in various malignancies. Int J Appl Basic Med Res 2012; 2: 111-6. ArticlePubMedPMC
- 21. Vazzano J, Frankel WL, Wolfe AR, Williams TM, Chen W. Morphologic changes associated with neoadjuvant-treated pancreatic ductal adenocarcinoma and comparison of two tumor regression grading systems. Hum Pathol 2021; 109: 1-11. ArticlePubMed
- 22. Shidham VB. CellBlockistry: chemistry and art of cell-block making: a detailed review of various historical options with recent advances. Cytojournal 2019; 16: 12.ArticlePubMedPMC
- 23. Shidham VB, Layfield LJ. Cell-blocks and immunohistochemistry. Cytojournal 2021; 18: 2.ArticlePubMedPMC
- 24. Billah S, Stewart J, Staerkel G, Chen S, Gong Y, Guo M. EGFR and KRAS mutations in lung carcinoma: molecular testing by using cytology specimens. Cancer Cytopathol 2011; 119: 111-7. ArticlePubMed
- 25. Heymann JJ, Bulman WA, Maxfield RA, et al. Molecular testing guidelines for lung adenocarcinoma: utility of cell blocks and concordance between fine-needle aspiration cytology and histology samples. Cytojournal 2014; 11: 12.ArticlePubMedPMC
- 26. Shidham VB. Cell-blocks and other ancillary studies (including molecular genetic tests and proteomics). Cytojournal 2021; 18: 4.ArticlePubMedPMC
- 27. Hong DS, Fakih MG, Strickler JH, et al. KRAS(G12C) inhibition with sotorasib in advanced solid tumors. N Engl J Med 2020; 383: 1207-17. ArticlePubMedPMC
- 28. Luo J. KRAS mutation in pancreatic cancer. Semin Oncol 2021; 48: 10-8. ArticlePubMedPMC
- 29. Bannoura SF, Uddin MH, Nagasaka M, et al. Targeting KRAS in pancreatic cancer: new drugs on the horizon. Cancer Metastasis Rev 2021; 40: 819-35. ArticlePubMedPMCPDF
- 30. Strickler JH, Satake H, George TJ, et al. Sotorasib in KRAS p.G12C-mutated advanced pancreatic cancer. N Engl J Med 2023; 388: 33-43. ArticlePubMed
REFERENCES
Figure & Data
References
Citations
- Cytology and small biopsy diagnosis of pancreatic ductal adenocarcinoma
Maria Pimenova, Matthew W. Rosenbaum
Seminars in Diagnostic Pathology.2026; 43(2): 150992. CrossRef
 PubReader
 ePub Link
-
 Cite this Article
- Cite this Article
-
- Close
- Download Citation
- Close
- Figure
-
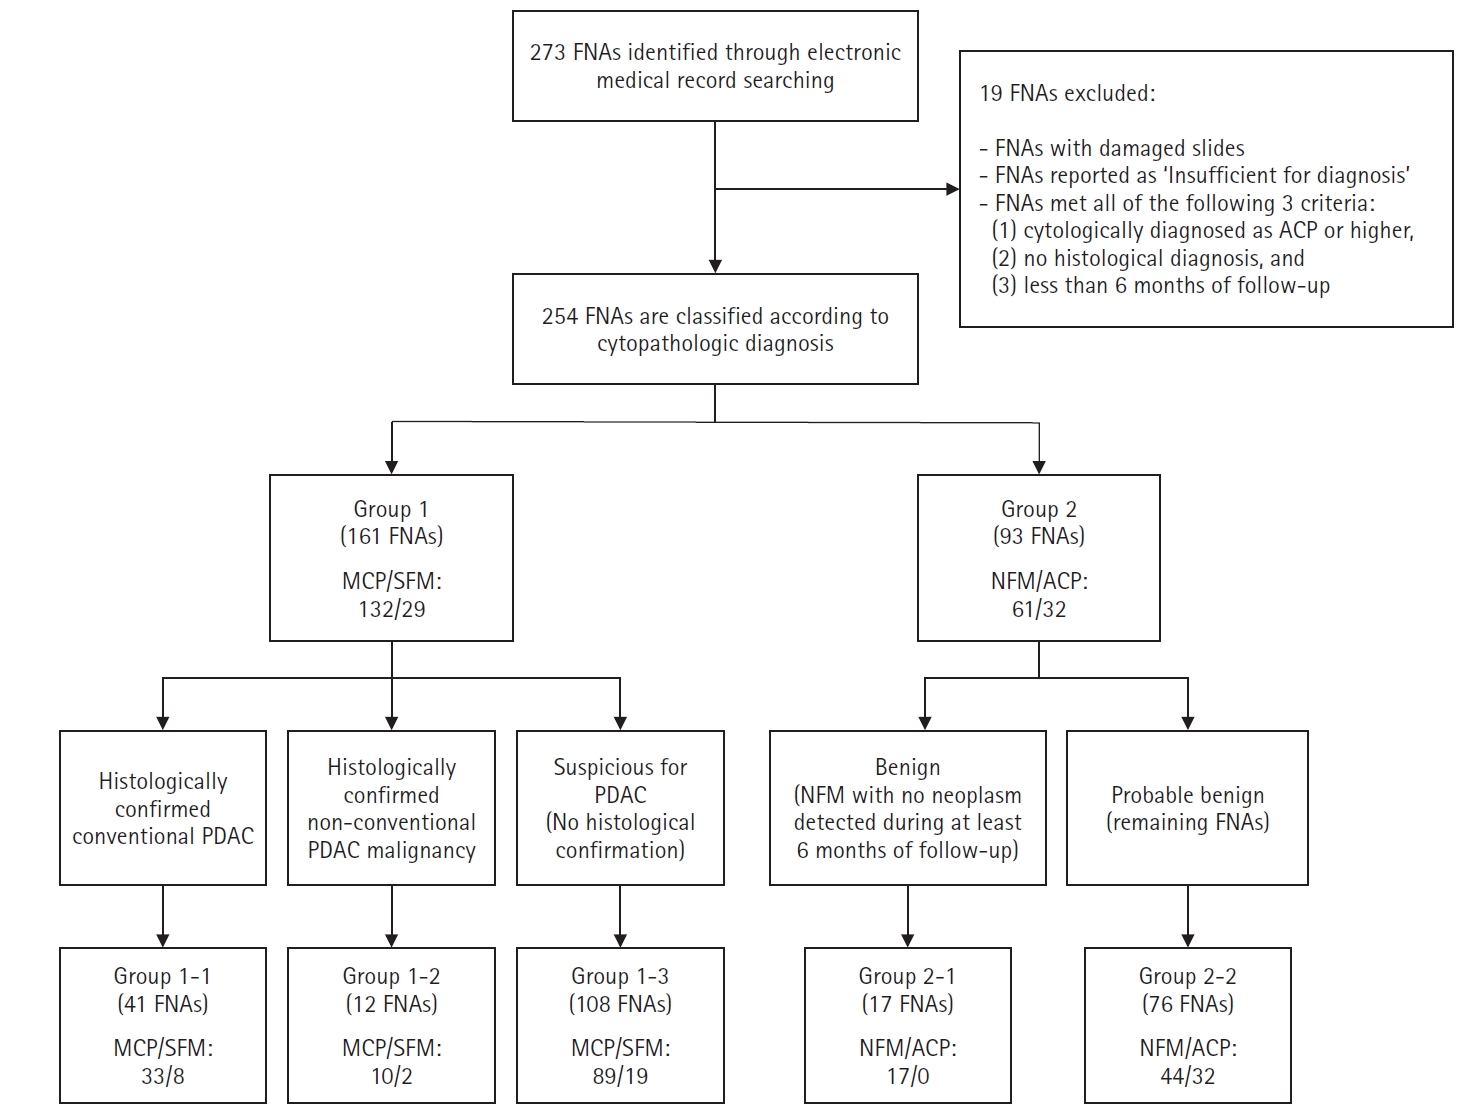
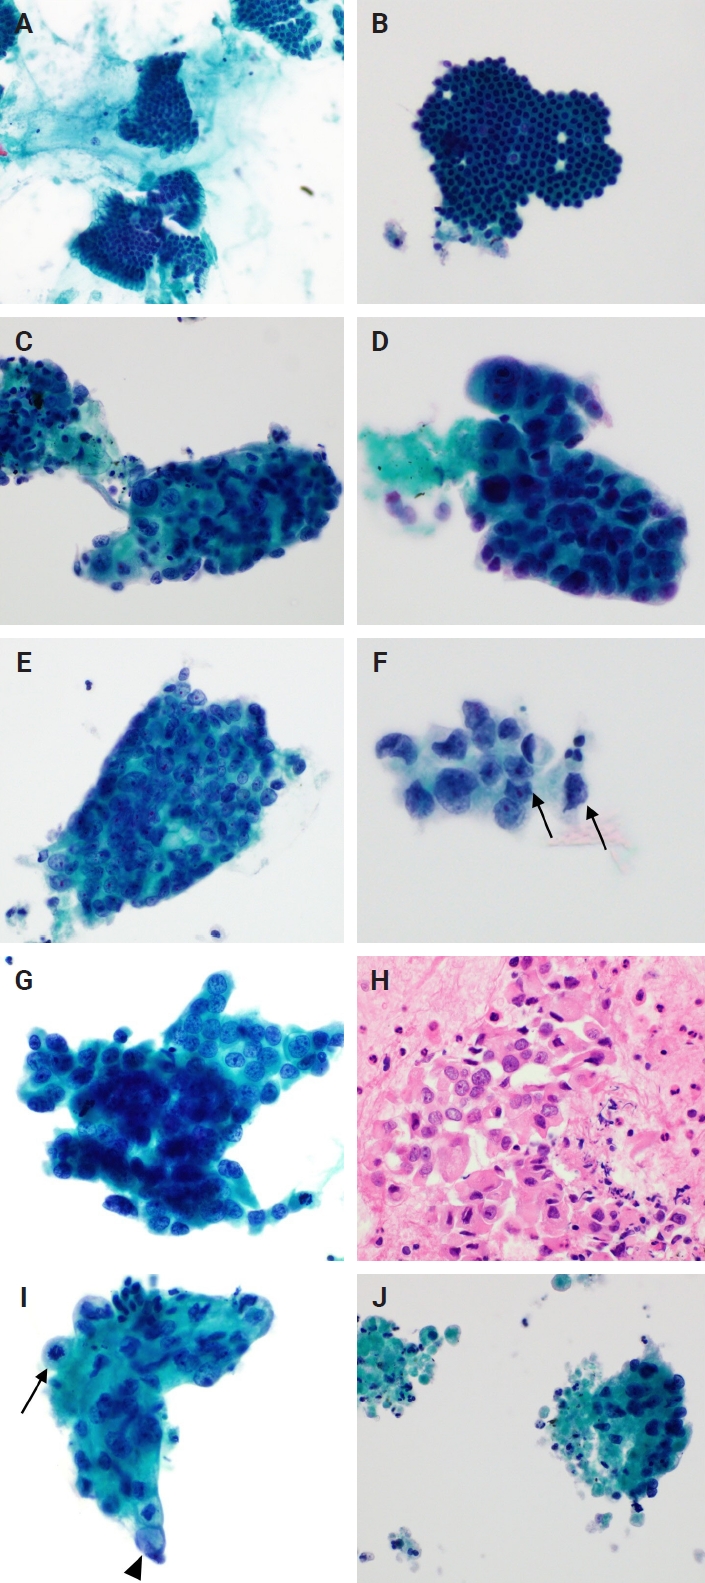


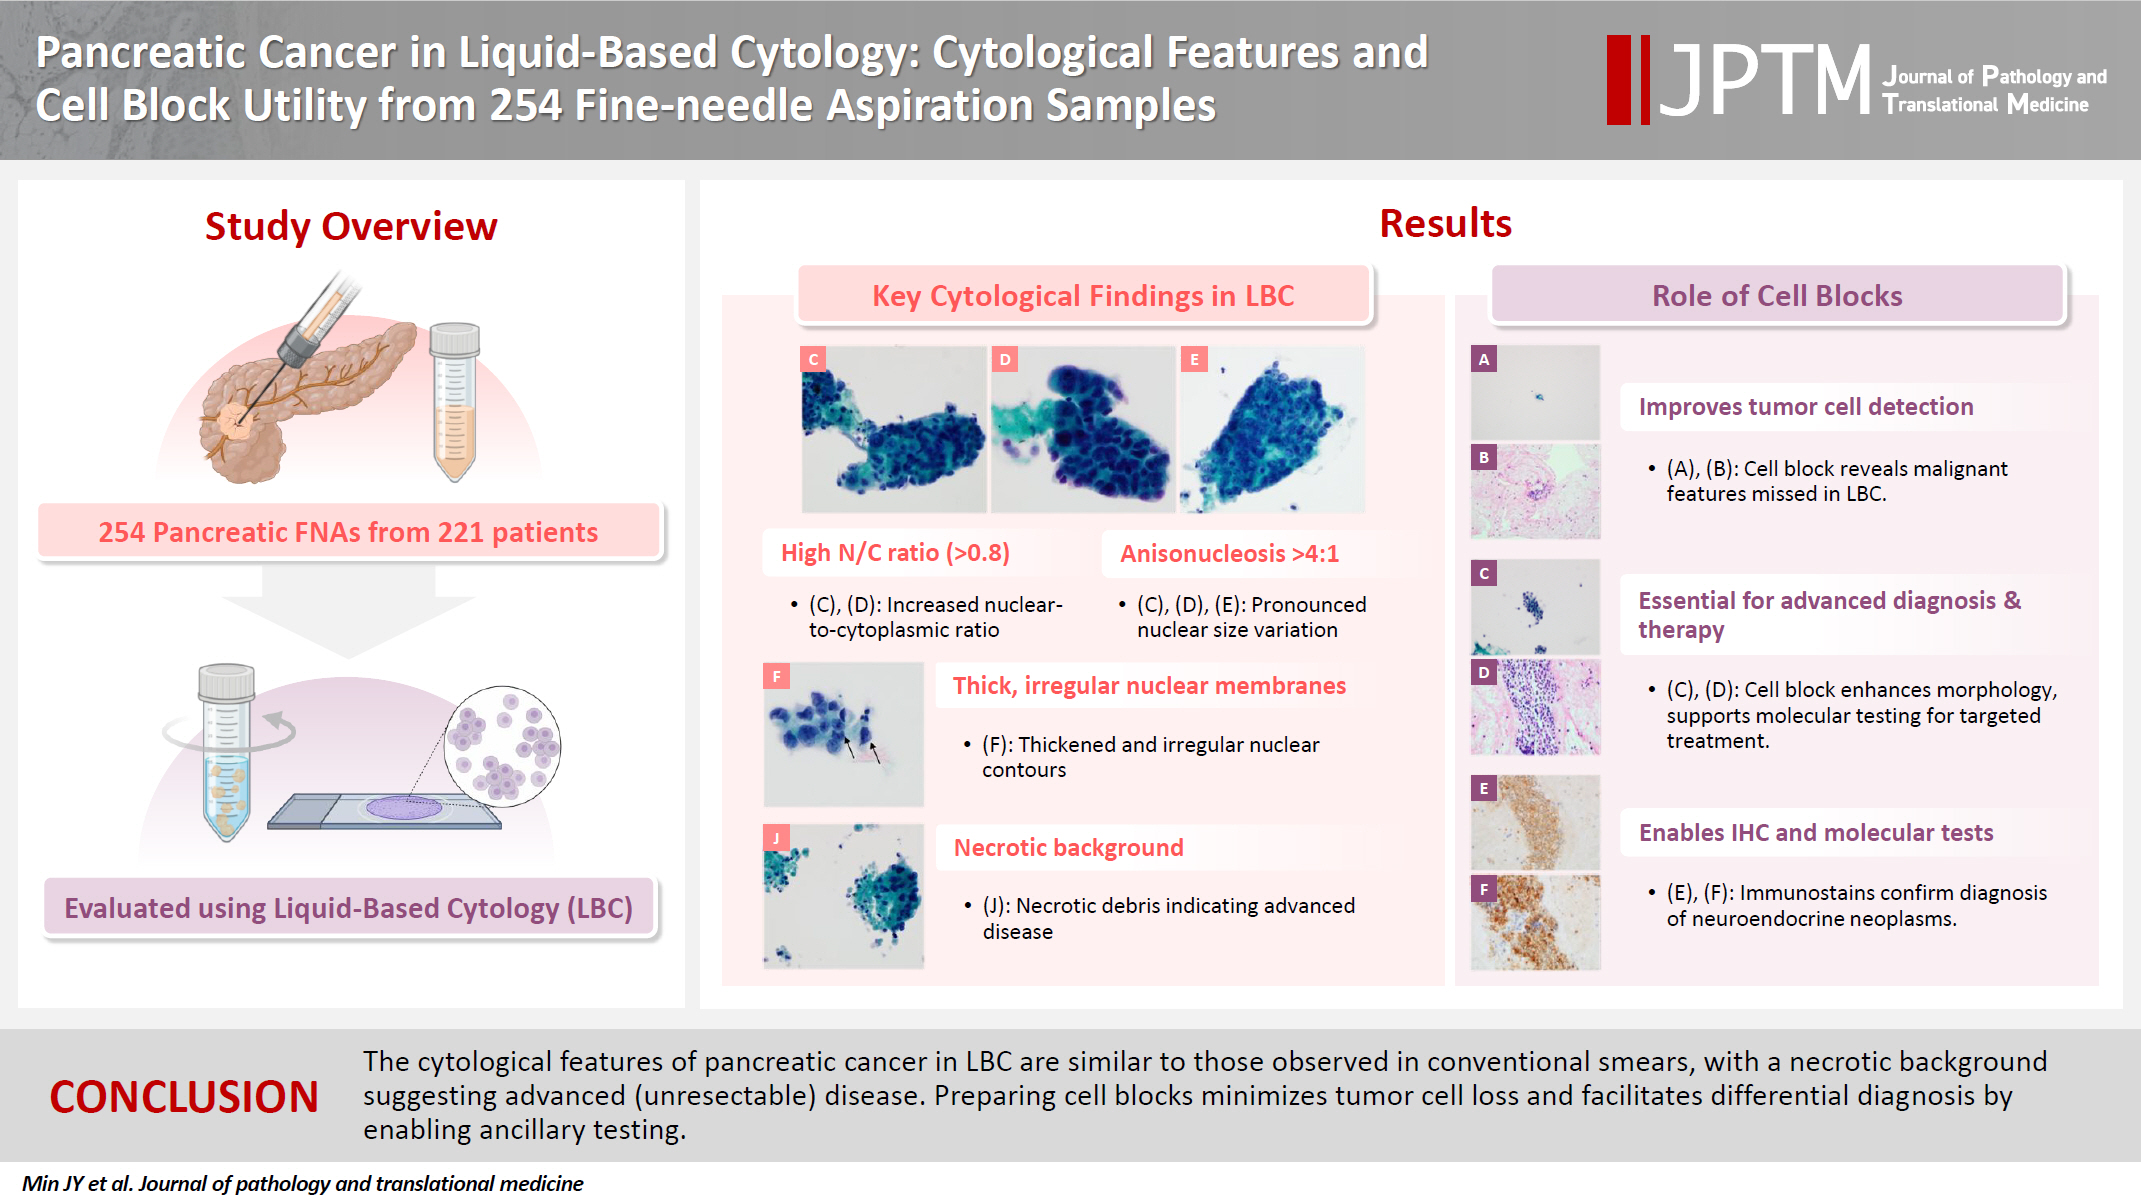


Fig. 1.
Fig. 2.
Fig. 3.
Fig. 4.
Graphical abstract
| Variable | Total (n = 221) | Group 1 (n = 159) |
Group 2 (n = 62) |
|||
|---|---|---|---|---|---|---|
| Group 1-1 (n = 41) | Group 1-2 (n = 12) | Group 1-3 (n = 106) | Group 2-1 (n = 13) | Group 2-2 (n = 49) | ||
| Sex (male/female) | 129 (58.4)/92 (41.6) | 19 (46.3)/22 (53.7) | 6 (50.0)/6 (50.0) | 66 (62.3)/40 (37.7) | 11 (84.6)/2 (15.4) | 27 (55.1)/22 (44.9) |
| Age (yr) | 67.0 ± 11.8 | 66.6 ± 10.7 | 66.0 ± 13.8 | 69.6 ± 9.8 | 52.4 ± 15.5 | 65.8 ± 12.5 |
| Radiologic feature |
||||||
| Solid | 193 (87.3) | 39 (95.1) | 12 (100) | 99 (93.4) | 7 (53.8) | 36 (73.5) |
| Solid-cystic | 12 (5.4) | 2 (4.9) | 0 | 4 (3.8) | 1 (7.7) | 5 (10.2) |
| Cystic | 16 (7.3) | 0 | 0 | 3 (2.8) | 5 (38.5) | 8 (16.3) |
| Specimen collection (EUS-guided/other) |
219 (99.1)/2 (0.9) | 41 (100)/0 (0) | 12 (100)/0 (0) | 106 (100)/0 (0) | 11 (84.6)/2 (15.4) | 49 (100)/0 (0) |
| Site of FNA | ||||||
| Head and neck (including uncinate process) | 101 (45.7) | 16 (39.0) | 6 (50.0) | 43 (40.6) | 6 (46.1) | 30 (61.2) |
| Body | 82 (37.1) | 18 (43.9) | 5 (41.7) | 42 (39.6) | 2 (15.4) | 15 (30.6) |
| Tail | 38 (17.2) | 7 (17.1) | 1 (8.3) | 21 (19.8) | 5 (38.5) | 4 (8.2) |
| Cytological feature | Group 1 (n = 161) | Group 2 (n = 93) | p-value |
|---|---|---|---|
| Background | <.001 | ||
| Non-necrotic |
126 (78.3) | 89 (95.7) | |
| Necrotic | 35 (21.7) | 4 (4.3) | |
| Gastrointestinal contaminants | .045 | ||
| Not identified | 59 (36.7) | 45 (48.4) | |
| Gastric | 54 (33.5) | 17 (18.3) | |
| Duodenal | 48 (29.8) | 31 (33.3) | |
| Cellularity | <.001 | ||
| No pancreatic ductal component |
0 | 20 (21.5) | |
| Low cellularity | 61 (37.9) | 56 (60.2) | |
| Intermediate cellularity | 46 (28.6) | 13 (14.0) | |
| High cellularity | 54 (33.5) | 4 (4.3) | |
| Architecture |
<.001 | ||
| Mixed pattern | 76 (47.2) | 15 (20.5) | |
| Mainly single cells | 14 (8.7) | 2 (2.7) | |
| Mainly small clusters | 66 (41.0) | 51 (69.9) | |
| Mainly large sheets | 5 (3.1) | 5 (6.9) | |
| Nuclear/cytoplasmic ratio |
<.001 | ||
| <0.5 | 0 | 4 (5.5) | |
| 0.5–0.8 | 53 (32.9) | 50 (68.5) | |
| >0.8 | 108 (67.1) | 19 (26.0) | |
| Cytoplasm |
.127 | ||
| Fine | 150 (93.2) | 71 (97.2) | |
| Clear | 1 (0.6) | 0 | |
| Foamy | 0 | 1 (1.4) | |
| Bubbly | 10 (6.2) | 1 (1.4) | |
| Anisonucleosis |
<.001 | ||
| <2:1 | 7 (4.3) | 55 (75.3) | |
| 2:1–4:1 | 33 (20.5) | 14 (19.2) | |
| >4:1 | 121 (75.2) | 4 (5.5) | |
| Nuclear membrane irregularity |
<.001 | ||
| Smooth | 7 (4.3) | 42 (57.5) | |
| Irregular | 147 (91.4) | 31 (42.5) | |
| Spiculate | 7 (4.3) | 0 | |
| Nuclear membrane thickness |
<.001 | ||
| Inconspicuous | 3 (1.9) | 17 (23.3) | |
| Thin | 75 (46.6) | 53 (72.6) | |
| Thick and prominent | 83 (51.5) | 3 (4.1) | |
| Multinucleated cells |
<.001 | ||
| Not identified | 129 (80.1) | 72 (98.6) | |
| Present | 32 (19.9) | 1 (1.4) | |
| Hyperchromatic nuclei |
<.001 | ||
| Not identified | 16 (9.9) | 43 (58.9) | |
| Present | 145 (90.1) | 30 (41.1) | |
| Chromatin pattern |
<.001 | ||
| Fine | 8 (5.0) | 45 (61.7) | |
| Coarse | 72 (44.7) | 22 (30.1) | |
| Clumped | 76 (47.2) | 3 (4.1) | |
| Smudged | 5 (3.1) | 3 (4.1) | |
| No. of nucleoli |
<.001 | ||
| No visible nucleoli | 58 (36.0) | 53 (72.6) | |
| Single | 93 (57.8) | 20 (27.4) | |
| Multiple | 10 (6.2) | 0 | |
| Prominent nucleoli |
<.001 | ||
| No visible nucleoli | 58 (36.0) | 53 (72.6) | |
| Visible at 400× magnification | 9 (5.6) | 7 (9.6) | |
| Visible at 200× or 100× magnification | 93 (57.8) | 13 (17.8) | |
| Visible at 40× or lower magnification | 1 (0.6) | 0 |
| Cytological feature | Curative (n = 19) | Palliative (n = 22) | p-value |
|---|---|---|---|
| Background | .004 | ||
| Non-necrotic |
18 (94.7) | 12 (54.5) | |
| Necrotic | 1 (5.3) | 10 (45.5) | |
| Gastrointestinal contaminants | .211 | ||
| Not identified | 6 (31.6) | 11 (50.0) | |
| Gastric | 7 (36.8) | 9 (40.9) | |
| Duodenal | 6 (31.6) | 2 (9.1) | |
| Cellularity | .785 | ||
| Low cellularity | 10 (52.6) | 9 (40.9) | |
| Intermediate cellularity | 5 (26.3) | 8 (36.4) | |
| High cellularity | 4 (21.1) | 5 (22.7) | |
| Architecture | .214 | ||
| Mixed pattern | 11 (57.9) | 10 (45.5) | |
| Mainly single cells | 2 (10.5) | 0 | |
| Mainly small clusters | 6 (31.6) | 11 (50.0) | |
| Mainly large sheets | 0 | 1 (4.5) | |
| Nuclear/cytoplasmic ratio | .138 | ||
| 0.5–0.8 | 3 (15.8) | 8 (36.4) | |
| >0.8 | 16 (84.2) | 14 (63.6) | |
| Cytoplasm | .463 | ||
| Fine | 18 (94.7) | 22 (100) | |
| Clear | 0 | 0 | |
| Foamy | 0 | 0 | |
| Bubbly | 1 (5.3) | 0 | |
| Anisonucleosis | .592 | ||
| <2:1 | 1 (5.3) | 0 | |
| 2:1–4:1 | 5 (26.3) | 5 (22.7) | |
| >4:1 | 13 (68.4) | 17 (77.3) | |
| Nuclear membrane irregularity | .490 | ||
| Smooth | 0 | 2 (9.1) | |
| Irregular | 19 (100) | 20 (90.9) | |
| Spiculate | 0 | 0 | |
| Nuclear membrane thickness | .177 | ||
| Inconspicuous | 0 | 0 | |
| Thin | 9 (47.4) | 15 (68.2) | |
| Thick and prominent | 10 (52.6) | 7 (31.8) | |
| Multinucleated cells |
.588 | ||
| Not identified | 17 (89.5) | 21 (95.5) | |
| Present | 2 (10.5) | 1 (4.5) | |
| Hyperchromatic nuclei | >.999 | ||
| Not identified | 4 (21.1) | 4 (18.2) | |
| Present | 15 (78.9) | 18 (81.8) | |
| Chromatin pattern | .869 | ||
| Fine | 1 (5.3) | 1 (4.5) | |
| Coarse | 6 (31.6) | 9 (40.9) | |
| Clumped | 12 (63.1) | 12 (54.6) | |
| Smudged | 0 | 0 | |
| No. of nucleoli | .737 | ||
| No visible nucleoli | 6 (31.6) | 8 (36.4) | |
| Single | 12 (63.1) | 14 (63.6) | |
| Multiple | 1 (5.3) | 0 | |
| Prominent nucleoli | >.999 | ||
| No visible nucleoli | 6 (31.6) | 8 (36.4) | |
| Visible at 400× magnification | 1 (5.3) | 1 (4.5) | |
| Visible at 200× or 100× magnification | 12 (63.1) | 13 (59.1) | |
| Visible at 40× or lower magnification | 0 | 0 |
| Variable | Total (n = 225 |
Group 1 (n = 151) |
Group 2 (n = 74) |
|||
|---|---|---|---|---|---|---|
| Group 1-1 (n = 40) | Group 1-2 (n = 11) | Group 1-3 (n = 100) | Group 2-1 (n = 13) | Group 2-2 (n = 61) | ||
| Assistance in diagnosis | ||||||
| Cytopathological diagnosis can be made without a cell block | 123 (81.5 |
37 (92.5) | 2 (18.2) | 84 (84.0) | N/A | N/A |
| Cell block helps in determining the presence of malignant cells |
16 (10.6 |
3 (7.5) | 0 (0.0) | 13 (13.0) | N/A | N/A |
| Cell block helps in differential histopathological diagnosis | 13 (5.8) | 0 (0.0) | 9 (81.8) | 3 (3.0) | 1 (7.7) | 0 |
| With the cell block alone | ||||||
| Cytopathological diagnosis can be made | 112 (74.2 |
27 (67.5) | 1 (9.1) | 84 (84.0) | N/A | N/A |
| Cytopathological diagnosis cannot be made | 39 (25.8 |
13 (32.5) | 10 (90.9) | 16 (16.0) | N/A | N/A |
| IHC/Special staining | ||||||
| Neither was performed | 211 (93.8) | 39 (97.5) | 3 (27.3) | 96 (96.0) | 12 (92.3) | 61 (100) |
| Only IHC performed | 7 (3.1) | 0 | 5 (45.4) | 2 (2.0) | 0 | 0 |
| Only special staining performed | 2 (0.9) | 1 (2.5) | 0 | 0 | 1 (7.7) | 0 |
| Both were performed | 5 (2.2) | 0 | 3 (27.3) | 2 (2.0) | 0 | 0 |
| Molecular testing | ||||||
| Not performed | 222 (98.7) | 39 (97.5) | 10 (90.9) | 100 (100) | 12 (92.3) | 61 (100) |
| Performed | 3 (1.3) | 1 (2.5) | 1 (9.1) | 0 | 1 (7.7) | 0 |
Values are presented as number (%) or mean ± standard deviation. EUS, endoscopic ultrasound; FNA, fine-needle aspiration. To prevent duplication of clinical information, data were analyzed per patient; for those with multiple FNAs assigned to different groups, classification was based on the group with the most severe cytological diagnosis; Based on the findings of computed tomography scan and/or magnetic resonance imaging; 1 percutaneous ultrasound-guided and 1 intraoperative.
Values are presented as number (%). Group 1 (99 clear, 23 inflammatory, 4 mucinous and no bloody background); group 2 (73 clear, 14 inflammatory, 2 mucinous and no bloody background); This category encompasses fine-needle aspirations (FNAs) where no cellular components were observed and FNAs where only inflammatory cells were observed; The 20 FNAs in which a pancreatic ductal component is not observed are excluded from the analysis; Multinucleated histiocytic giant cells are excluded.
Values are presented as number (%). Curative treatment subgroup (15 clear, 2 inflammatory, 1 mucinous and no bloody background); Palliative treatment subgroup (9 clear, 3 inflammatory, no mucinous and no bloody background); Multinucleated histiocytic giant cells are excluded.
Values are presented as number (%). IHC, immunohistochemistry; N/A, not applicable. Of the 254 fine-needle aspirations (FNAs), 24 FNAs where cell blocks were not produced and five FNAs that could not be reviewed were excluded from the analysis; With only the liquid-based cytology slide, a diagnosis is equivalent to or below ‘atypical cell present’. However, when considering the cell block slide, a diagnosis of ‘suspicious for malignancy’ or higher can be made; These are the percentages calculated based on the 151 FNAs of group 1.

