 E-submission
Articles
- Page Path
- HOME > J Pathol Transl Med > Volume 59(2); 2025 > Article
-
Original Article
Association study of TYMS gene expression with TYMS and ENOSF1 genetic variants in neoadjuvant chemotherapy response of gastric cancer -
Khadijeh Arjmandi1
 , Iman Salahshourifar1, Shiva Irani1, Fereshteh Ameli2, Mohsen Esfandbod3
 -
Journal of Pathology and Translational Medicine 2025;59(2):105-114.
DOI: https://doi.org/10.4132/jptm.2024.11.05
Published online: December 10, 2024
1Department of Biology, Science and Research Branch, Islamic Azad University, Tehran, Iran
2Pathology Department, Cancer Institute, Imam Khomeini Hospital Complex, Tehran University of Medical Sciences, Tehran, Iran
3Department of Hematology and Oncology, Imam Khomeini Hospital Complex, Tehran University of Medical Sciences, Tehran, Iran
- Corresponding Author Iman Salahshourifar, PhD Department of Biology, Science and Research Branch, Islamic Azad University, Tehran 1416753955, Iran Tel: +98-9199300923, Fax: +98-21-66911705, E-mail: isalahshouri@gmail.com
© The Korean Society of Pathologists/The Korean Society for Cytopathology
This is an Open Access article distributed under the terms of the Creative Commons Attribution Non-Commercial License (http://creativecommons.org/licenses/by-nc/4.0) which permits unrestricted non-commercial use, distribution, and reproduction in any medium, provided the original work is properly cited.


Figure & Data
References
Citations
- Innovative biomaterial strategies for mitigating radiotherapy toxicity: multidimensional mechanistic interventions of nano-microscale materials and hydrogels
Yifan Liu, Fengdi Jiang, Jie Song, Huaijin Qiao, Junlong Dai, Hao Bai, Shuyu Zhang
Coordination Chemistry Reviews.2026; 549: 217313. CrossRef - Mebendazole impairs the expression and function of enzymes in nucleotide metabolism pathways, leading to Selective Cytotoxicity, Cell Cycle Arrest, and Damage to Cell Morphology in Gastric Cancer
Emerson Lucena da Silva, Felipe Pantoja Mesquita, Pedro Victor da Rocha Lima, José Hélio de Araújo Filho, Francisco Laio de Oliveira, Ana Beatriz da Lima, Pedro Filho Noronha Souza, Raquel Carvalho Montenegro
Chemico-Biological Interactions.2026; 430: 111973. CrossRef - Multi‐Omics Analysis of TYMS as a Prognostic Biomarker and Therapeutic Target for Lung Adenocarcinoma
Hansen Shi, Peijun Zhang, Jiayi Chen, Hua Li, Xiaohuai Zhang, Biyun zeng, Tiancai Liu, Tao Zeng
Cancer Medicine.2026;[Epub] CrossRef
 PubReader
 ePub Link
-
 Cite this Article
- Cite this Article
-
- Close
- Download Citation
- Close
- Figure
-


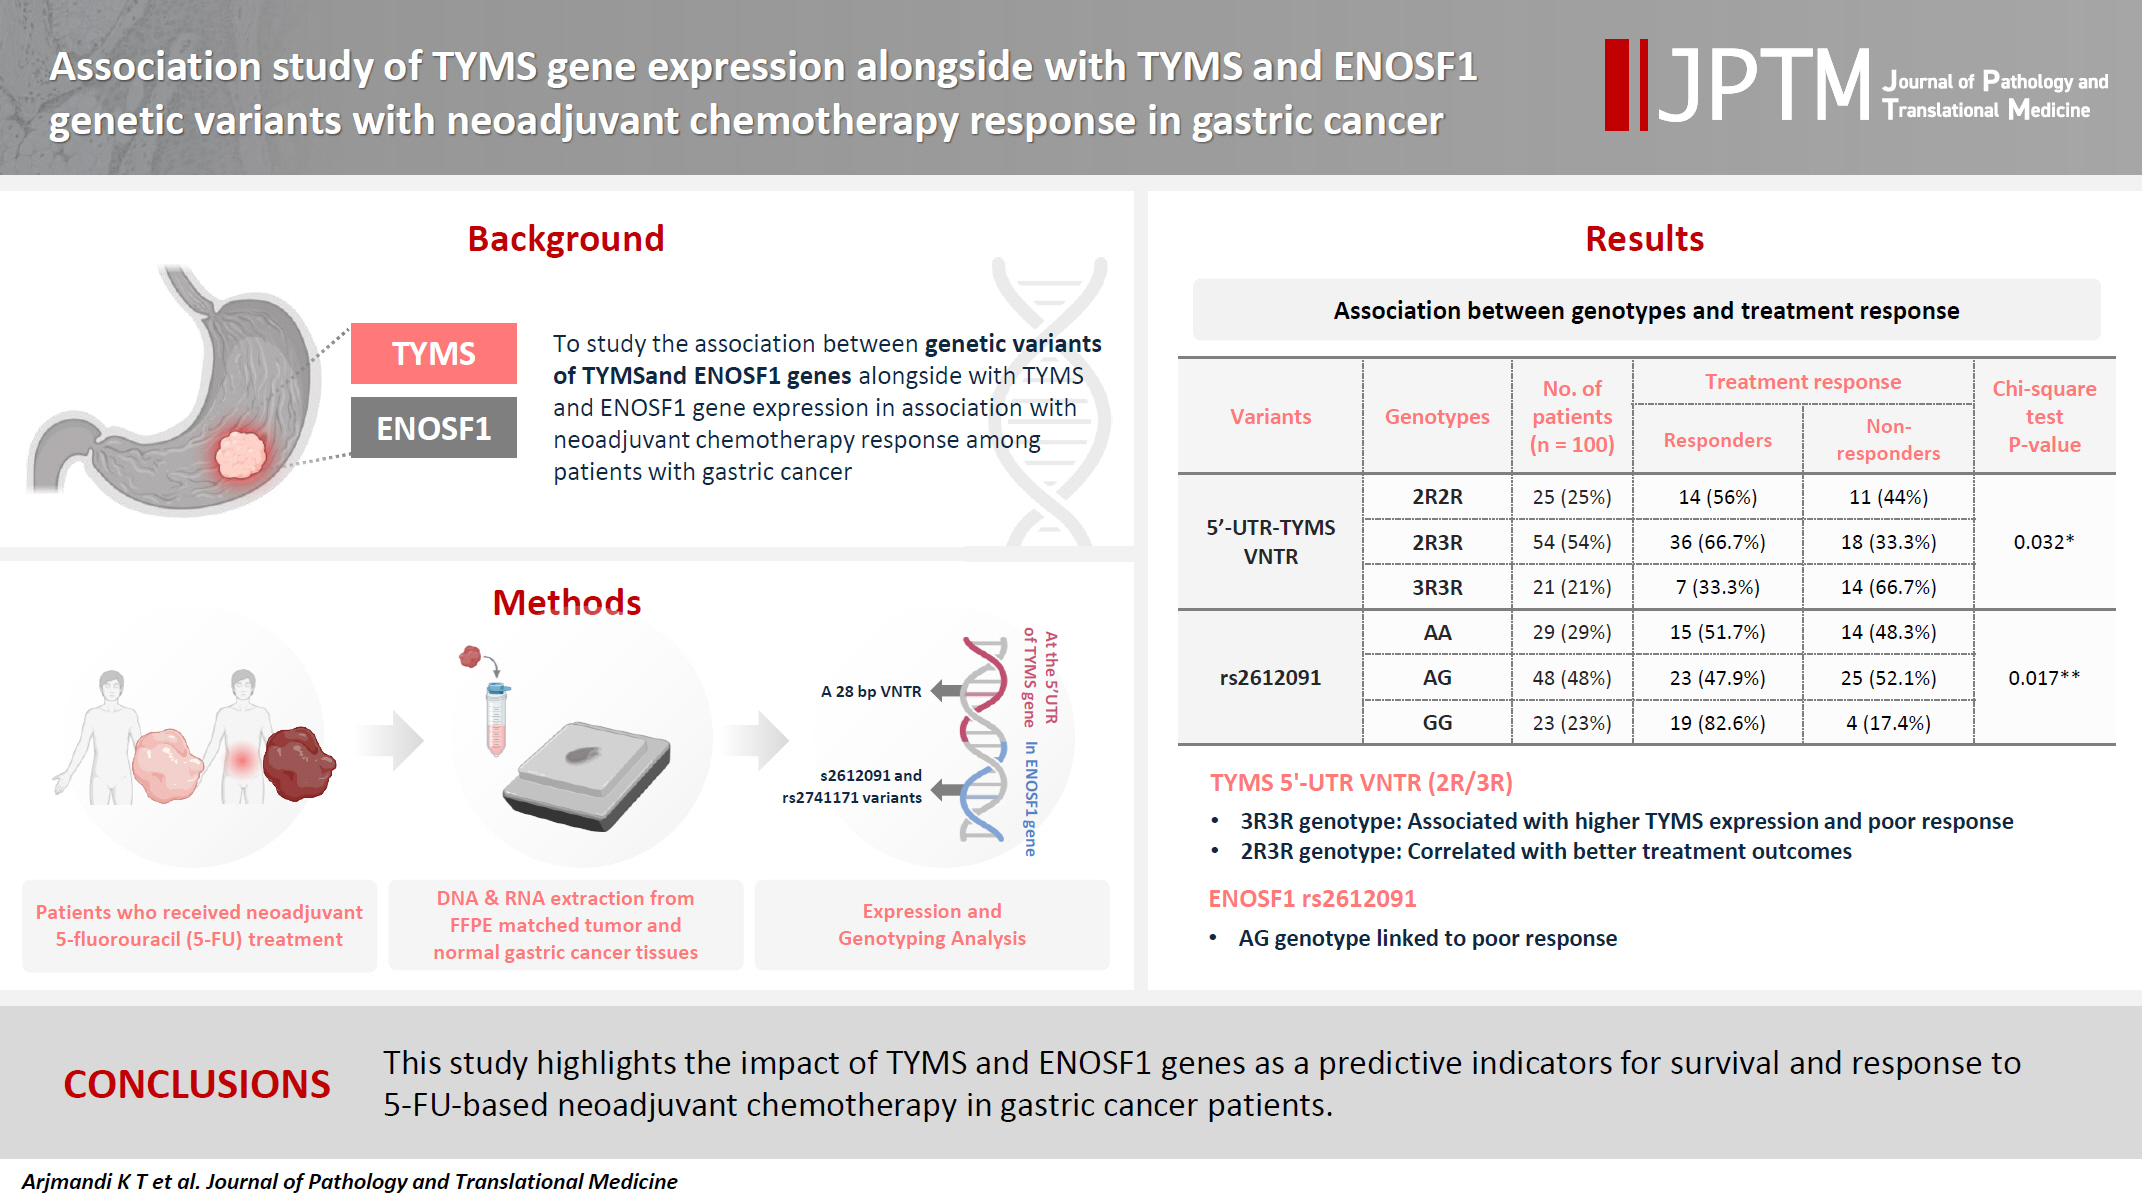


Fig. 1.
Fig. 2.
Graphical abstract
| Gene | Variant | Primer | Product size (bp) | |
|---|---|---|---|---|
| ENOSF1 | rs2612091 | Forward inner primer (A allele) | CTGGACATCCAGTGGCTCCTCAATCA | 247 |
| Reverse inner primer (G allele) | GGTACAGTCTTTAGGAGGAGCCGTGCAC | 197 | ||
| Forward outer primer | TGTGCATGATTCAGAATGTGACAAAATGG | 390 | ||
| Reverse outer primer | AAAAGAGACTCTTCACAGGGAGGTCAGCC | |||
| rs2741171 | Forward inner primer (A allele) | GGGTTTCACCATGTTGATCAGGTGGA | 222 | |
| Reverse inner primer (G allele) | GCGGATCACCTGAGGTCAGGAGTATGATAC | 288 | ||
| Forward outer primer | CAATTTCCTGCCACAGCCAAAATTTCTC | 454 | ||
| Reverse outer primer | TGACTCTCAGAGTGCACAAGCAGCACTT | |||
| TYMS | TYMS 28-bp VNTR | Forward primer | CGTGGCTCCTGCGTTTCC | 210 (2R) |
| Reverse primer | GAGCCGGCCACAGGCAT | 238 (3R) | ||
| Gene | Variant | Genotype | Frequency, n (%) |
|---|---|---|---|
| TYMS | 5′-UTR–TYMS VNTR | 2R3R | 54 (54.0) |
| 2R2R | 25 (25.0) | ||
| 3R3R | 21 (21.0) | ||
| ENOSF1 | rs2612091 | GG | 23 (23.0) |
| AG | 48 (48.0) | ||
| AA | 29 (29.0) | ||
| rs2741171 | GG | 48 (48.0) | |
| AA | 16 (16.0) | ||
| AG | 36 (36.0) |
| Variant | Genotype | No. of patients (n = 100) | Treatment response |
Chi-square test p-value | |
|---|---|---|---|---|---|
| Responder | Nonresponder | ||||
| 5′-UTR–TYMS VNTR | 2R2R | 25 (25.0) | 14 (56.0) | 11 (44.0) | .032 |
| 2R3R | 54 (54.0) | 36 (66.7) | 18 (33.3) | ||
| 3R3R | 21 (21.0) | 7 (33.3) | 14 (66.7) | ||
| rs2612091 | AA | 29 (29.0) | 15 (51.7) | 14 (48.3) | .017 |
| AG | 48 (48.0) | 23 (47.9) | 25 (52.1) | ||
| GG | 23 (23.0) | 19 (82.6) | 4 (17.4) | ||
| rs2741171 | AA | 16 (16.0) | 11 (68.8) | 5 (31.3) | .065 |
| AG | 36 (36.0) | 15 (41.7) | 21 (58.3) | ||
| GG | 48 (48.0) | 31 (64.6) | 17 (35.4) | ||
| Variant | Genotype | Survival time (mo) |
HR (95% CI) | p-value | |
|---|---|---|---|---|---|
| Mean (95% CI) | p-value | ||||
| 5′-UTR-TYMS VNTR | 2R2R | 23.44 (13.84–33.04) | .003 |
1 (reference group) | - |
| 2R3R | 39.36 (32.62–46.1) | 0.47 (0.25–0.87) | .020 | ||
| 3R3R | 47.17 (37.3–57.04) | 0.24 (0.09–0.64) | .005 | ||
| rs2612091 | AA | 30.71 (21.37–40.04) | .170 | 1 (reference group) | |
| AG | 36.39 (28.97–43.8) | 0.73 (0.39–1.37) | .320 | ||
| GG | 45.80 (36.17–55.44) | 0.47 (0.2–1.08) | .080 | ||
| rs2741171 | AA | 36.84 (24.62–49.07) | .970 | 1 (reference group) | |
| AG | 37.41 (28.93–45.88) | 0.92 (0.39–2.16) | .850 | ||
| GG | 36.79 (29.31–44.28) | 1 (0.45–2.23) | .990 | ||
| Variant | Genotype | ENOSF1 expression, n (%) |
p-value | |
|---|---|---|---|---|
| Low | High | |||
| 5′-UTR–TYMS VNTR | 2R2R | 25 (100) | 0 | <.001 |
| 2R3R | 36 (66.7) | 18 (33.3) | ||
| 3R3R | 0 | 21 (21) | ||
| ENOSF1 rs2612091 | GG | 17 (73.9) | 6 (26.1) | .160 |
| AG | 36 (75.0) | 12 (25.0) | ||
| AA | 16 (25.2) | 13 (44.8) | ||
| ENOSF1 rs2741171 | GG | 36 (75.0) | 12 (25.0) | .310 |
| AG | 21 (58.3) | 15 (41.7) | ||
| AA | 12 (75.0) | 4 (25.0) | ||
| Gene | Variant expression | Survival time (mo) |
HR (95% CI) | p-value | |
|---|---|---|---|---|---|
| Mean (95% CI) | p-value | ||||
| TYMS | Low | 1.553 (0.828–2.908) | .218 | 0.633 (0.344–1.167) | .165 |
| High | 0.644 (0.343–1.207) | ||||
| ENOSF1 | Low | 1.063 (0.540–2.087) | .810 | 1.353 (0.601–3.042) | .464 |
| High | 0.941 (0.479–1.849) | ||||
| OR | 95% CI for OR |
p-value | ||
|---|---|---|---|---|
| Lower | Upper | |||
| ENOSF1 | 5.95 | 2.36 | 15.01 | <.001 |
The tetra-ARMS polymerase chain reaction (PCR) method was used for
The 2R3R genotype was the most frequent (54.0%) among all cases with 5′-UTR–
Values are presented as number (%). 5′-UTR, 5′ untranslated region; Among the studied genotypes, a significant correlation was found between VNTR genotype and treatment response (p = .032). The 2R3R genotype was more common in responders, and the 3R3R genotype was more common among non-responders; bGenotypes of rs2612091 showed a significant association (p = .017), patients who did not respond to treatment showed more frequent AG genotype.
HR, hazard ratio; CI, confidence interval; 5′-UTR, 5′ untranslated region; The highest and lowest average survival times of people after 5-FU treatment were in patients with 3R3R and 2R2R genotypes, respectively, and the observed difference was significant (p = .003). Such a different also was observed in the Cox model, where the risk of death in those with 3R3R and 2R3R variants was lower than in those with 2R2R variants (reference group) at 0.24 and 0.47, respectively. The overall survival of patients with rs2612091 or rs2741171 after 5-FU treatment was not significant (p = .170 and p = .970, respectively). In the Cox model, the risk ratio of death in patients with different genotypes of rs2612091 or rs2741171 variants compared to the reference group was not significant (p > .05).
There was a significant relationship between
No significant relationship was observed between expression of these genes and the survival time of patients (p = .218 and p = .810, respectively). HR, hazard ratio;
Data analysis showed increased expression of

