 E-submission
Articles
- Page Path
- HOME > J Pathol Transl Med > Volume 59(2); 2025 > Article
-
Original Article
Association study of TYMS gene expression with TYMS and ENOSF1 genetic variants in neoadjuvant chemotherapy response of gastric cancer -
Khadijeh Arjmandi1
 , Iman Salahshourifar1, Shiva Irani1, Fereshteh Ameli2, Mohsen Esfandbod3
 -
Journal of Pathology and Translational Medicine 2025;59(2):105-114.
DOI: https://doi.org/10.4132/jptm.2024.11.05
Published online: December 10, 2024
1Department of Biology, Science and Research Branch, Islamic Azad University, Tehran, Iran
2Pathology Department, Cancer Institute, Imam Khomeini Hospital Complex, Tehran University of Medical Sciences, Tehran, Iran
3Department of Hematology and Oncology, Imam Khomeini Hospital Complex, Tehran University of Medical Sciences, Tehran, Iran
- Corresponding Author Iman Salahshourifar, PhD Department of Biology, Science and Research Branch, Islamic Azad University, Tehran 1416753955, Iran Tel: +98-9199300923, Fax: +98-21-66911705, E-mail: isalahshouri@gmail.com
© The Korean Society of Pathologists/The Korean Society for Cytopathology
This is an Open Access article distributed under the terms of the Creative Commons Attribution Non-Commercial License (http://creativecommons.org/licenses/by-nc/4.0) which permits unrestricted non-commercial use, distribution, and reproduction in any medium, provided the original work is properly cited.
Abstract
-
Background
- The present research was designed to study the associations between genetic variants of TYMS and ENOSF1 genes with TYMS and ENOSF1 gene expression in neoadjuvant chemotherapy response among patients with gastric cancer.
-
Methods
- Formalin-embedded and paraffin-fixed matched tumor and normal gastric cancer tissue samples from patients who received neoadjuvant 5-fluorouracil (5-FU) treatment were obtained. DNA and RNA were extracted for all samples. A 28-bp variable number tandem repeat (VNTR) at the 5' untranslated region of TYMS gene and rs2612091 and rs2741171 variants in the ENOSF1 gene were genotyped for normal tissue samples. The real-time polymerase chain reaction method was used to study the expression of ENOSF1 and TYMS genes in both normal and tumor tissues. Data were analyzed using REST 2000 and SPSS ver. 26.0 software programs.
-
Results
- A significant association between TYMS 2R3R VNTR genotypes and 5-FU therapy was found (p = .032). The 3R3R and 2R2R genotypes were significantly associated with increased and decreased survival time, respectively (p = .003). The 3R3R genotype was significantly associated with TYMS overexpression (p < .001). Moreover, a significant association was found between the rs2612091 genotype and treatment outcome (p = .017).
-
Conclusions
- This study highlights the impact of TYMS and ENOSF1 genes as predictive indicators for survival and response to 5-FU–based neoadjuvant chemotherapy in gastric cancer patients.
- Gastric cancer is the fifth most prevalent malignancy in the world and the fourth most lethal cancer type, with a 5-year survival rate less than 20.0% [1,2]. Nonmetastatic gastric and gastroesophageal adenocarcinomas in randomized clinical trials have shown a positive response to combinational treatments [3]. Advanced gastric malignancies can be treated with different cytotoxic substances, including platinum-based compounds, taxanes, fluoropyrimidines (FPs), and irinotecan [3]. The efficacy of chemotherapy, which plays a key role in treatment of both locally advanced and metastatic gastric cancers, is often hampered by the development of chemoresistance. Complex mechanisms are involved in chemoresistance in gastric cancer [4].
- 5-Fluorouracil (5-FU) is a frequently used FP in various malignancies [5]. The principal target of FPs is the thymidylate synthase (TS) enzyme, which plays a vital role in DNA synthesis. There are opposing associations between TS expression level and tumor vulnerability to FPs [5-7]. Genetic variants in the thymidylate synthetase (TYMS) gene, encoding the TS protein, have been used to predict drug toxicity risk [8]. Variations in the 5′ untranslated regions (5′-UTRs) of the TYMS gene have gained notable attention for their unique ability to affect the stability of TYMS mRNA and gene expression and TS levels [9]. In particular, there are significant associations of change in gene expression, response to 5-FU treatment, and toxic effects with a 28-bp variable number tandem repeat (VNTR) in the TYMS 5′-UTR [6,10-12]. Studies have revealed distinct connections between the 2R and 3R alleles of this VNTR in TYMS expression, 5-FU reactivity, and toxicity [10,13]. The 3R allele is associated with a significant increase in TYMS expression, potentially necessitating higher doses of 5-FU for effective treatment, resulting in a less favorable prognosis and reduced drug efficacy [10,12]. Specifically, the 3R/3R genotype displays greater TYMS expression than the 2R/2R genotype [10,12,14]. In contrast, the 2R/2R genotype has been linked with increased toxicity in patients receiving FP-based chemotherapy, resulting in significant adverse reactions [8,11,15].
- Adjacent to the TYMS gene, the enolase superfamily member 1 (ENOSF1) gene seems to have dual roles as a protein-coding gene and an antisense transcript that modulates TYMS mRNA expression and protein levels [10,16-19]. The rs2612091 variant influences the expression of ENOSF1 mRNA and is associated with an increased risk of toxicity induced by capecitabine treatment [16,17].
- The rs2741171 variant (located downstream of TYMS and in the intronic region of ENOSF1) has been implicated in the development of hand-foot syndrome (HFS) [13]. Hence, we designed the current study to investigate associations of the 28-bp VNTR in the TYMS gene and of the rs2612091 and rs2741171 variants in the ENOSF1 gene and TYMS gene expression with 5-FU therapy in patients with gastric cancer.
INTRODUCTION
- Participants
- We recruited 100 matched tumor and normal formalin-fixed, paraffin-embedded (FFPE) samples from patients with gastric cancer who underwent gastrectomy at Imam Khomeini Hospital, Tehran, Iran, from 2012 to 2018. The cohort consisted of 70 male and 30 female participants, with an average age of 58.10 ± 11.43 years. All patients were treated with 5-FU before surgery. The FFPE blocks of all patients were examined by a pathologist, and matched tumor and normal tissues were punched. The evaluation of chemotherapy effectiveness was categorized based on the standards established by the College of American Pathologists [20]. This guideline classifies the treatment responses into four groups: comprehensive response (with a score of 0), nearly comprehensive response (with a score of 1), partial response (with a score of 2), and minimal or nonexistent response (with a score of 3). Patients were then classified into two groups of positive treatment response (with scores 0 to 2) and inadequate or absent response (with a score of 3).
- DNA extraction and genotyping revisions
- DNA of matched normal and tumor tissues were extracted using QIAamp DNA FFPE Tissue kit (Qiagen, Hilden, Germany). Genotyping of the 5'-UTR–TYMS VNTR variant was performed using previously reported primers [6,21]. Polymerase chain reaction (PCR) was conducted with a total volume of 22 μL as follows: 50 ng of genomic DNA, 5.0% dimethyl sulfoxide, 10 picomoles of each primer, and the 12 µl of 2× Hot Start PCR mix (Amplicon Co., Copenhagen, Denmark).
- The PCR program was carried out with an initial denaturation at 95°C for 15 minutes, followed by 37 cycles of denaturation at 95°C for 1 minute, annealing at 64°C for 45 seconds, and extension at 72°C for 45 seconds and then a final extension step at 72°C for 10 minutes.
- Genotyping
- Specific primers were designed for genotyping of the VNTR at the 5′-UTR of the TYMS gene (Table 1). The 2R allele with a size of 210 bp and 3R allele with a size of 238 bp were identified using agarose gel electrophoresis. Tetra-ARMS PCR was used for genotyping of rs2612091 and rs2741171 variants in the ENOSF1 gene (Table 1). Tetra-ARMS PCR primers were designed using the Primer 1 online program (primer1.soton.ac.uk/primer1.html).
- The PCR mixture reaction for tetra-ARMS PCR comprised between 50 and 100 ng of genomic DNA, 2× Hot start PCR Master Mix Blue (Amplicon Co.), and 5 pmol of each primer. The PCR conditions were 95ºC for 10 minutes; 40 cycles of 95ºC for 1 minute, 62ºC for 1 minute, and 72ºC for 1 minute; and a final extension for 10 minutes at 72ºC. Amplification products were examined, and genotypes were identified on a 3.0% agarose gel.
- RNA extraction and gene expression analysis
- The total RNA from FFPE matched tumor and normal tissues of 100 patients was extracted using the Hybrid-R GeneAll Kit (GeneAll Co., Seoul, Korea). cDNA was synthesized using a commercial kit (Yekta Tajhiz Azma, Tehran, Iran). Then, quantitative real-time PCR (qPCR) analysis was performed using the Cyber Green method with previously published primers for TYMS gene expression [22]. In addition, specific primers were designed for the ENOSF1 gene expression analysis as follows: forward primer (5'-ACAGGCACTTCCAATTCCGA-3') and reverse primer (5'-AGAGCTGCTTCAACGTGTCA-3'). The GAPDH gene was used as the reference control with the following primer sequences: forward primer (5′-TCACCAGGGCTGCTTTTAAC-3′) and reverse primer (5′-GACAAGCTTCCCGTTCTCAG-3′).
- For each assay, the total volume of the PCR reaction was 20 μL comprised of 2 μL of cDNA, 10 pmol of each primer, and 10 μL of Cyber Green 2× master mix (Amplicon Co.). The qPCR was performed using an initial denaturation step at 95°C for 15 minutes. This was followed by 40 cycles of denaturation at 95°C for 30 seconds, annealing at 60°C for 60 seconds, and extension at 72°C for 30 seconds. To ensure the robustness and reliability of the results, each sample underwent analysis in triplicate.
- Statistical analysis
- Data analysis was conducted using REST 2000 and SPSS ver. 26.0 software (IBM Corp., Armonk, NY, USA). The chi-square test, a two-sided independent t-test, and one-way ANOVA were applied to examine the relationships between variables. A significant difference was established at .05. Patient survival times were estimated using the log-rank test and Kaplan-Meier survival analysis. The Cox regression semi-parametric model assessed the mortality risk ratio across variant states. Changes in expression levels were measured using the 2-ΔΔCT method.
MATERIALS AND METHODS
- Patient characteristics
- In this study of 100 patients with gastric cancer, 43 experienced resistance to chemotherapy. The average age of the patients was 58.10 ± 11.43 years 22 had grade 1 disease, 35 had grade 2, and 43 had grade 3. The stage of disease was 1 in 22 cases, 2 in 34, 3 in 39 cases, and 4 in five cases. Among the 57 patients who responded to treatment, 13 experienced complete remission (rated as score 0), 15 achieved near-complete remission (score 1), and 29 demonstrated a partial response (score 2). Over a maximum follow-up period of 5 years, 24 patients showed disease progression, 47 patients died, and 29 patients maintained a favorable condition.
- Genotypic variations and chemotherapeutic response
- A significant association was observed between VNTR genotype and the effectiveness of neoadjuvant chemotherapy (p = .032) (Tables 2, 3). The 2R3R genotype was found more frequently in patients with a positive response to the treatment (66.7%), followed by the 2R2R genotype. Conversely, the 3R3R genotype was more common in those who did not respond to the treatment.
- Additionally, a significant association was found between the rs2612091 variant and the efficacy of treatment (p = .017), with the AG genotype more frequent in non-responders. However, no significant association was found between rs2741171 genotype and treatment outcome (p < .05).
- Variant impact on survival outcomes
- A significant association between overall survival and TYMS VNTR genotype was identified (p = .003). Those with the 3R3R genotype had longer survival times in contrast to those with the 2R3R genotype, who had the shortest survival time (Table 4, Fig. 1A). Mortality risk analysis using the Cox model showed that patients with the 3R3R or 2R3R genotype had reduced hazard ratio (HR) of 0.24 and 0.47, respectively, compared to those with the 2R2R genotype. Despite the lack of significance (p = .170), individuals carrying the GG or AA genotype of the rs2612091 variant showed longer and shorter survival, respectively, after treatment with 5-FU (Table 4, Fig. 1B).
- Similarly, the Cox model analysis showed no significant difference in HR for mortality among patients with GG or AG genotype compared to those with the AA genotype (p > .05). For the rs2741171 variant, patients with AG genotype were associated with the longest survival after 5-FU treatment, whereas those with GG genotype had the shortest (Table 4, Fig. 1C). However, this observation was not statistically significant (p = .970).
- Gene expression analysis
- The TYMS gene was overexpressed in 61 tumor samples, while the remaining 39 did not reveal significant variations in gene expression. An association between TYMS gene expression and the 28-bp allele of the VNTR variant was found (p = .001). The TYMS gene expression was downregulated among samples with the 2R2R genotype and overexpressed among samples with the 3R3R genotype (Table 5). No statistical significance was found between TYMS gene expression and treatment response (p = .206).
- Even though this result was not significant, the ENOSF1 gene was downregulated in most tumor tissue samples (69%) compared to adjacent normal tissue samples that showed overexpression (31.0%) (Table 5).
- TYMS and ENOSF1 gene expression analysis
- No significant association was found between survival time and TYMS or ENOSF1 gene expression (Table 6, Fig. 2). Furthermore, no significant association was detected between TYMS or ENOSF1 gene expression and mortality risk (Table 6, Fig. 2).
- As shown in Table 7, there was an adverse significant association between TYMS and ENOSF1 gene expression (p = .001; odds ratio, 5.95; 95% confidence interval, 2.36 to 15.01), as sample tissues with overexpression of the TYMS gene showed reduced expression of the ENOSF1 gene in tumor tissues.
RESULTS
- Genetic variants have a critical impact on gene expression in anti-tumor drug reactions, with a particular emphasis on FPs and their impact on gastric cancer [10,13,23-25].
- TS, a key target of FPs, plays a crucial role in DNA synthesis and repair. Variations in the TYMS gene encoding the TS protein are linked with survival rates and toxicity levels in patients treated with 5-FU chemotherapy [26,27]. The ENOSF1 gene, closely related to and overlapping the TYMS, has also been identified as a potential factor in chemotherapy resistance, especially in 5-FU treatment [28,29]. This study meticulously investigated the 28-bp VNTR in the 5'-UTR of TYMS, along with the rs2612091 and rs2741171 variants in ENOSF1, in 100 gastric cancer patients undergoing 5-FU–based neoadjuvant chemotherapy. In addition, TYMS and ENOSF1 gene expression was measured on matched tumor and normal tissue samples.
- A significant association was found between the TYMS 28-bp VNTR variant and neoadjuvant chemotherapy response (p = .032). The 2R3R genotype was more common in patients responding well to treatment than was the 3R3R genotype. In gastric cancer, TYMS overexpression has been detected in association with reduced 5-FU efficacy [11]. In addition, the 3R3R genotype is associated with TYMS overexpression and a poor response to 5-FU [11,30]. Similar patterns were observed in rectal cancer, where the 2R3R genotype is associated with better treatment outcomes [31]. In contrast, the 2R2R genotype may indicate a higher toxicity risk with FP treatment [8,11,15,26,32].
- We also found a relationship between heightened toxicity and improved response to treatment in patients possessing the 2R2R genotype. Although the connection between the TYMS gene variant and treatment effectiveness is well-established, its association with survival time is uncertain. A previous study has reported significant disparity in survival time following 5-FU treatment between patients with the 3R3R and 2R2R genotypes (p = .003). However, other studies have reported that patients with the 3R2R genotype have a longer survival time than those with the 3R3R and 2R2R genotypes [33], with similar findings observed in lung cancer [34]. Nevertheless, some research did not identify noteworthy variations in survival time linked to TYMS 5'-UTR variants [32,34-38]. A significant relationship has been established between TYMS gene expression and the 28-bp VNTR variant (p < .001). The 2R2R genotype is associated with reduced TYMS expression, while the 3R3R genotype is linked to increased expression. This indicates the interaction between TYMS gene expression and VNTR alleles [11,32,39,40], emphasizing the predictive role of the 3R allele in intratumoral TYMS expression and 5-FU response. Patients with the 2R2R genotype, exhibiting lower levels of TYMS mRNA, tend to demonstrate a more favorable response to 5-FU [39]. However, reduced TYMS expression in normal tissues, particularly in lung and gastrointestinal cancers, increases the risk of 5-FU toxicity [11,32,40]. Nonetheless, the correlation between the 28-bp VNTR and TYMS expression remained inconclusive in certain studies [11,23,41]. Rosmarin et al. [17] underscored the influence of ENOSF1 on cell sensitivity to FPs, where the ENOSF1 rs2612091 G/G genotype in colorectal cancer is linked to shorter survival. That investigation also assessed the impact of the ENOSF1 rs2612091 variant on survival in advanced gastric cancer, indicating poorer outcomes with each additional G allele [42]. Furthermore, the G allele has been associated with increased capecitabine-related toxicity [17]. Different studies have explored adverse reactions to capecitabine, yielding mixed findings of the significance of these associations [9,28,43]. The involvement of the ENOSF1 c.742-227G>A variant in the development of FP-dependent HFS has also been acknowledged [44]. Palles et al. [45] have suggested modifying HFS management based on rs2612091 testing. The research has revealed a notable correlation between rs2612091 genotypes and the efficacy of 5-FU–based therapies (p = .017), with a greater frequency of non-responsiveness in individuals carrying the AG genotype. Nonetheless, the variance in survival duration following 5-FU treatment among genotypes was not significant (p = .170).
- The rs2741171 variant downstream of TYMS and within ENOSF1 has shown no significant association with treatment response, patient survival, or ENOSF1 expression. Yang et al. reported that gastric cancer tumors exhibited twice the ENOSF1 expression levels of controls, identifying two peptide regions as potential diagnostic biomarkers [46,47]. In the present study, no substantial relationship was observed between the expression of ENOSF1 and either the response to treatment or the mean survival duration (p = .810).
- Furthermore, the Cox model did not reveal a significant risk for mortality based on ENOSF1 expression levels. Previous research has supported the notion that ENOSF1 overexpression, functioning as a reverse TYMS, reduces TYMS expression through antisense RNA production and rTS-β protein synthesis to influence TYMS activity at post-transcriptional and post-translational levels [48,49].
- In summary, we revealed a substantial association between the 28-bp TYMS VNTR and TYMS gene expression in the efficacy of neoadjuvant chemotherapy employing 5-FU in patients with gastric cancer. Those harboring the 2R3R genotype of TYMS showed superior treatment outcomes. Conversely, individuals bearing the 3R3R genotype showed elevated TYMS gene expression when juxtaposed with their counterparts possessing the 2R2R genotype. Nevertheless, an augmented response was discerned among subjects exhibiting a mixture of 3R and 2R alleles. This implies that the complex interaction between these two genetic repeats may be an unrecognized determinant influencing the response to 5-FU in the cohort under investigation. These findings suggest the need for analysis of interactions of other TYMS genetic variations with the 28-bp VNTR.
- In addition, individuals with the AG genotype of the rs2612091 variant displayed a weaker response to neoadjuvant chemotherapy. However, this genetic variant did not demonstrate a significant correlation with overall survival rate or the expression level of the ENOSF1 gene.
- The rs2741171 variant showed no apparent correlation with survival rate, neoadjuvant chemotherapy efficacy, or gene expression pattern in patients with gastric cancer. However, several limitations in this study should be considered. One major limitation is that a multivariate analysis was not performed but is crucial to adjust for confounding variables, such as age, sex, and other clinical factors, which may independently influence the outcomes. Without this analysis, it is difficult to assess the true relationships between the genetic variants and neoadjuvant chemotherapy response.
- Additionally, the sample size in our study was relatively small, which can limit the statistical power and increase the risk of type II errors, and real associations might not be detected. Another limitation is that the study focused on a specific patient population, which may limit the generalizability of the findings to broader or more diverse groups. Moreover, environmental and lifestyle factors that were not considered may have impacted the observed outcomes. Therefore, future studies should include larger and more diverse populations, perform multivariate analyses, and consider additional factors such as gene-environment interactions to provide a more comprehensive understanding of the role of TYMS and ENOSF1 genetic variants in neoadjuvant chemotherapy response.
DISCUSSION
Ethics Statement
This study was approved by the ethics committee (ID IR.IAU.SRB.REC.1397.110 on October 23, 2017). A consent form was obtained from patients before using their samples in this study.
Availability of Data and Material
The datasets generated or analyzed during the study are available from the corresponding author on reasonable request.
Code Availability
Not applicable.
Author Contributions
Conceptualization: KA, IS, SI, FA, ME. Data curation: KA, IS, SI, FA, ME. Formal analysis: KA, IS, SI, FA, ME. Writing—original draft: KA. Writing—review & editing: KA, IS, SI, FA, ME. Approval of final manuscript: all authors.
Conflicts of Interest
The authors declare that they have no potential conflicts of interest.
Funding Statement
No funding to declare.


The 2R3R genotype was the most frequent (54.0%) among all cases with 5′-UTR–TYMS VNTR, followed by the 2R2R (25.0%) and 3R3R (21.0%) genotypes. In rs2612091, the highest frequency was related to the AG genotype at 48.0%, and the frequencies of AA and GG genotypes were 29.0% and 23.0%, respectively. Genotypes with rs2741171 were 48.0% GG, 16.0% AA, and 36.0% AG.
TYMS, thymidylate synthetase; 5′-UTR, 5′ untranslated region; VNTR, variable number tandem repeat; ENOSF1, enolase superfamily member 1.
| Variant | Genotype | No. of patients (n = 100) |
Treatment response |
Chi-square test p-value | |
|---|---|---|---|---|---|
| Responder | Nonresponder | ||||
| 5′-UTR–TYMS VNTR | 2R2R | 25 (25.0) | 14 (56.0) | 11 (44.0) | .032a |
| 2R3R | 54 (54.0) | 36 (66.7) | 18 (33.3) | ||
| 3R3R | 21 (21.0) | 7 (33.3) | 14 (66.7) | ||
| rs2612091 | AA | 29 (29.0) | 15 (51.7) | 14 (48.3) | .017b |
| AG | 48 (48.0) | 23 (47.9) | 25 (52.1) | ||
| GG | 23 (23.0) | 19 (82.6) | 4 (17.4) | ||
| rs2741171 | AA | 16 (16.0) | 11 (68.8) | 5 (31.3) | .065 |
| AG | 36 (36.0) | 15 (41.7) | 21 (58.3) | ||
| GG | 48 (48.0) | 31 (64.6) | 17 (35.4) | ||
Values are presented as number (%).
5′-UTR, 5′ untranslated region; TYMS, thymidylate synthetase; VNTR, variable number tandem repeat.
aAmong the studied genotypes, a significant correlation was found between VNTR genotype and treatment response (p = .032). The 2R3R genotype was more common in responders, and the 3R3R genotype was more common among non-responders; bGenotypes of rs2612091 showed a significant association (p = .017), patients who did not respond to treatment showed more frequent AG genotype.
| Variant | Genotype |
Survival time (mo) |
HR (95% CI) | p-value | |
|---|---|---|---|---|---|
| Mean (95% CI) | p-value | ||||
| 5′-UTR-TYMS VNTR | 2R2R | 23.44 (13.84–33.04) | .003a | 1 (reference group) | - |
| 2R3R | 39.36 (32.62–46.1) | 0.47 (0.25–0.87) | .020 | ||
| 3R3R | 47.17 (37.3–57.04) | 0.24 (0.09–0.64) | .005 | ||
| rs2612091 | AA | 30.71 (21.37–40.04) | .170 | 1 (reference group) | |
| AG | 36.39 (28.97–43.8) | 0.73 (0.39–1.37) | .320 | ||
| GG | 45.80 (36.17–55.44) | 0.47 (0.2–1.08) | .080 | ||
| rs2741171 | AA | 36.84 (24.62–49.07) | .970 | 1 (reference group) | |
| AG | 37.41 (28.93–45.88) | 0.92 (0.39–2.16) | .850 | ||
| GG | 36.79 (29.31–44.28) | 1 (0.45–2.23) | .990 | ||
HR, hazard ratio; CI, confidence interval; 5′-UTR, 5′ untranslated region; TYMS, thymidylate synthetase; VNTR, variable number tandem repeat; 5-FU, 5-fluorouracil.
aThe highest and lowest average survival times of people after 5-FU treatment were in patients with 3R3R and 2R2R genotypes, respectively, and the observed difference was significant (p = .003). Such a different also was observed in the Cox model, where the risk of death in those with 3R3R and 2R3R variants was lower than in those with 2R2R variants (reference group) at 0.24 and 0.47, respectively. The overall survival of patients with rs2612091 or rs2741171 after 5-FU treatment was not significant (p = .170 and p = .970, respectively). In the Cox model, the risk ratio of death in patients with different genotypes of rs2612091 or rs2741171 variants compared to the reference group was not significant (p > .05).
| Variant | Genotype |
ENOSF1 expression, n (%) |
p-value | |
|---|---|---|---|---|
| Low | High | |||
| 5′-UTR–TYMS VNTR | 2R2R | 25 (100) | 0 | <.001a |
| 2R3R | 36 (66.7) | 18 (33.3) | ||
| 3R3R | 0 | 21 (21) | ||
| ENOSF1 rs2612091 | GG | 17 (73.9) | 6 (26.1) | .160 |
| AG | 36 (75.0) | 12 (25.0) | ||
| AA | 16 (25.2) | 13 (44.8) | ||
| ENOSF1 rs2741171 | GG | 36 (75.0) | 12 (25.0) | .310 |
| AG | 21 (58.3) | 15 (41.7) | ||
| AA | 12 (75.0) | 4 (25.0) | ||
TYMS, thymidylate synthetase; ENOSF1, enolase superfamily member 1; 5′-UTR, 5′ untranslated region; VNTR, variable number tandem repeat.
aThere was a significant relationship between TYMS gene expression and the VNTR variant (p < .001). The 2R2R genotype of the VNTR TYMS variant was associated with low TYMS expression, and the 3R3R genotype of the VNTR TYMS variant was associated with high TYMS expression. There was no significant association between ENOSF1 expression and the investigated genotypes.
| OR |
95% CI for OR |
p-value | ||
|---|---|---|---|---|
| Lower | Upper | |||
| ENOSF1 | 5.95 | 2.36 | 15.01 | <.001 |
- 1. Ilic M, Ilic I. Epidemiology of stomach cancer. World J Gastroenterol 2022; 28: 1187-203. ArticlePubMedPMC
- 2. Sung H, Ferlay J, Siegel RL, et al. Global cancer statistics 2020: GLOBOCAN estimates of incidence and mortality worldwide for 36 cancers in 185 countries. CA Cancer J Clin 2021; 71: 209-49. ArticlePubMedPDF
- 3. Joshi SS, Badgwell BD. Current treatment and recent progress in gastric cancer. CA Cancer J Clin 2021; 71: 264-79. ArticlePubMedPMCPDF
- 4. Shi WJ, Gao JB. Molecular mechanisms of chemoresistance in gastric cancer. World J Gastrointest Oncol 2016; 8: 673-81. ArticlePubMedPMC
- 5. Biagioni A, Staderini F, Peri S, et al. 5-Fluorouracil conversion pathway mutations in gastric cancer. Biology (Basel) 2020; 9: 265.ArticlePubMedPMC
- 6. De Mattia E, Roncato R, Palazzari E, Toffoli G, Cecchin E. Germline and somatic pharmacogenomics to refine rectal cancer patients selection for neo-adjuvant chemoradiotherapy. Front Pharmacol 2020; 11: 897.ArticlePubMedPMC
- 7. Hernando-Cubero J, Matos-Garcia I, Alonso-Orduna V, Capdevila J. The role of fluoropirimidines in gastrointestinal tumours: from the bench to the bed. J Gastrointest Cancer 2017; 48: 135-47. ArticlePubMedPDF
- 8. Castro-Rojas CA, Esparza-Mota AR, Hernandez-Cabrera F, et al. Thymidylate synthase gene variants as predictors of clinical response and toxicity to fluoropyrimidine-based chemotherapy for colorectal cancer. Drug Metab Pers Ther 2017; 32: 209-18. ArticlePubMed
- 9. De Mattia E, Roncato R, Dalle Fratte C, Ecca F, Toffoli G, Cecchin E. The use of pharmacogenetics to increase the safety of colorectal cancer patients treated with fluoropyrimidines. Cancer Drug Resist 2019; 2: 116-30. ArticlePubMedPMC
- 10. Ab Mutalib NS, Md Yusof NF, Abdul SN, Jamal R. Pharmacogenomics DNA biomarkers in colorectal cancer: Current Update. Front Pharmacol 2017; 8: 736.ArticlePubMedPMC
- 11. Romiti A, Roberto M, D'Antonio C, et al. The TYMS-TSER polymorphism is associated with toxicity of low-dose capecitabine in patients with advanced gastrointestinal cancer. Anticancer Drugs 2016; 27: 1044-9. ArticlePubMed
- 12. Vazquez C, Orlova M, Angriman F, et al. Prediction of severe toxicity in adult patients under treatment with 5-fluorouracil: a prospective cohort study. Anticancer Drugs 2017; 28: 1039-46. ArticlePubMed
- 13. Matsusaka S, Lenz HJ. Pharmacogenomics of fluorouracil -based chemotherapy toxicity. Expert Opin Drug Metab Toxicol 2015; 11: 811-21. ArticlePubMed
- 14. Lima A, Azevedo R, Sousa H, Seabra V, Medeiros R. Current approaches for TYMS polymorphisms and their importance in molecular epidemiology and pharmacogenetics. Pharmacogenomics 2013; 14: 1337-51. ArticlePubMed
- 15. Gallegos-Arreola MP, Zuniga-Gonzalez GM, Sanchez-Lopez JY, et al. TYMS 2R3R polymorphism and DPYD [IVS]14+1G>A gene mutation in Mexican colorectal cancer patients. Acta Biochim Pol 2018; 65: 227-34. ArticlePubMed
- 16. Meulendijks D, Rozeman EA, Cats A, et al. Pharmacogenetic variants associated with outcome in patients with advanced gastric cancer treated with fluoropyrimidine and platinum-based triplet combinations: a pooled analysis of three prospective studies. Pharmacogenomics J 2017; 17: 441-51. ArticlePubMedPDF
- 17. Rosmarin D, Palles C, Pagnamenta A, et al. A candidate gene study of capecitabine-related toxicity in colorectal cancer identifies new toxicity variants at DPYD and a putative role for ENOSF1 rather than TYMS. Gut 2015; 64: 111-20. ArticlePubMed
- 18. Liang P, Nair JR, Song L, McGuire JJ, Dolnick BJ. Comparative genomic analysis reveals a novel mitochondrial isoform of human rTS protein and unusual phylogenetic distribution of the rTS gene. BMC Genomics 2005; 6: 125.ArticlePubMedPMCPDF
- 19. Dolnick BJ, Angelino NJ, Dolnick R, Sufrin JR. A novel function for the rTS gene. Cancer Biol Ther 2003; 2: 364-9. ArticlePubMed
- 20. Shi C, Berlin J, Branton P, et al. Protocol for the examination of specimens from patients with carcinoma of the stomach. Northfield: College of American Pathologists, 2020.
- 21. Mandola MV, Stoehlmacher J, Muller-Weeks S, et al. A novel single nucleotide polymorphism within the 5' tandem repeat polymorphism of the thymidylate synthase gene abolishes USF-1 binding and alters transcriptional activity. Cancer Res 2003; 63: 2898-904. PubMed
- 22. Jiang H, Li B, Wang F, Ma C, Hao T. Expression of ERCC1 and TYMS in colorectal cancer patients and the predictive value of chemotherapy efficacy. Oncol Lett 2019; 18: 1157-62. ArticlePubMedPMC
- 23. Shitara K, Muro K, Ito S, et al. Folate intake along with genetic polymorphisms in methylenetetrahydrofolate reductase and thymidylate synthase in patients with advanced gastric cancer. Cancer Epidemiol Biomarkers Prev 2010; 19: 1311-9. ArticlePubMedPDF
- 24. Li SC, Ma R, Wu JZ, et al. Delineation of gastric cancer subtypes by co-regulated expression of receptor tyrosine kinases and chemosensitivity genes. Am J Transl Res 2015; 7: 1429-39. PubMedPMC
- 25. Meulendijks D, Jacobs BA, Aliev A, et al. Increased risk of severe fluoropyrimidine-associated toxicity in patients carrying a G to C substitution in the first 28-bp tandem repeat of the thymidylate synthase 2R allele. Int J Cancer 2016; 138: 245-53. ArticlePubMed
- 26. Smyth E, Zhang S, Cunningham D, et al. Pharmacogenetic analysis of the UK MRC (Medical Research Council) MAGIC Trial: association of polymorphisms with toxicity and survival in patients treated with perioperative epirubicin, cisplatin, and 5-fluorouracil (ECF) chemotherapy. Clin Cancer Res 2017; 23: 7543-9. ArticlePubMedPMCPDF
- 27. Wu J, Li S, Ma R, et al. Tumor profiling of co-regulated receptor tyrosine kinase and chemoresistant genes reveal different targeting options for lung and gastroesophageal cancers. Am J Transl Res 2016; 8: 5729-40. PubMedPMC
- 28. Garcia-Gonzalez X, Cortejoso L, Garcia MI, et al. Variants in CDA and ABCB1 are predictors of capecitabine-related adverse reactions in colorectal cancer. Oncotarget 2015; 6: 6422-30. ArticlePubMedPMC
- 29. Garcia-Gonzalez X, Lopez-Fernandez LA. Using pharmacogenetics to prevent severe adverse reactions to capecitabine. Pharmacogenomics 2017; 18: 1199-213. ArticlePMC
- 30. Kawakami K, Graziano F, Watanabe G, et al. Prognostic role of thymidylate synthase polymorphisms in gastric cancer patients treated with surgery and adjuvant chemotherapy. Clin Cancer Res 2005; 11: 3778-83. ArticlePubMedPDF
- 31. Yang YC, Wu GC, Jin L, et al. Association of thymidylate synthase polymorphisms with the tumor response to preoperative chemoradiotherapy in rectal cancer: a systematic review and meta-analysis. Pharmacogenomics J 2017; 17: 265-73. ArticlePubMedPDF
- 32. Lecomte T, Ferraz JM, Zinzindohoue F, et al. Thymidylate synthase gene polymorphism predicts toxicity in colorectal cancer patients receiving 5-fluorouracil-based chemotherapy. Clin Cancer Res 2004; 10: 5880-8. ArticlePubMedPDF
- 33. Chen J, Ying X, Zhang L, Xiang X, Xiong J. Influence of TS and ABCB1 gene polymorphisms on survival outcomes of 5‑FU-based chemotherapy in a Chinese population of advanced gastric cancer patients. Wien Klin Wochenschr 2017; 129: 420-6. ArticlePubMedPDF
- 34. Arevalo E, Castanon E, Lopez I, et al. Thymidylate synthase polymorphisms in genomic DNA as clinical outcome predictors in a European population of advanced non-small cell lung cancer patients receiving pemetrexed. J Transl Med 2014; 12: 98.ArticlePubMedPMC
- 35. Gao J, He Q, Hua D, Mao Y, Li Y, Shen L. Polymorphism of TS 3'-UTR predicts survival of Chinese advanced gastric cancer patients receiving first-line capecitabine plus paclitaxel. Clin Transl Oncol 2013; 15: 619-25. ArticlePubMedPDF
- 36. Gusella M, Frigo AC, Bolzonella C, et al. Predictors of survival and toxicity in patients on adjuvant therapy with 5-fluorouracil for colorectal cancer. Br J Cancer 2009; 100: 1549-57. ArticlePubMedPMCPDF
- 37. Martinez-Balibrea E, Abad A, Martinez-Cardus A, et al. UGT1A and TYMS genetic variants predict toxicity and response of colorectal cancer patients treated with first-line irinotecan and fluorouracil combination therapy. Br J Cancer 2010; 103: 581-9. ArticlePubMedPMCPDF
- 38. Seo BG, Kwon HC, Oh SY, et al. Comprehensive analysis of excision repair complementation group 1, glutathione S-transferase, thymidylate synthase and uridine diphosphate glucuronosyl transferase 1A1 polymorphisms predictive for treatment outcome in patients with advanced gastric cancer treated with FOLFOX or FOLFIRI. Oncol Rep 2009; 22: 127-36. ArticlePubMed
- 39. Pullarkat ST, Stoehlmacher J, Ghaderi V, et al. Thymidylate synthase gene polymorphism determines response and toxicity of 5-FU chemotherapy. Pharmacogenomics J 2001; 1: 65-70. ArticlePubMedPDF
- 40. Shintani Y, Ohta M, Hirabayashi H, et al. New prognostic indicator for non-small-cell lung cancer, quantitation of thymidylate synthase by real-time reverse transcription polymerase chain reaction. Int J Cancer 2003; 104: 790-5. ArticlePubMed
- 41. Lima A, Seabra V, Martins S, Coelho A, Araujo A, Medeiros R. Thymidylate synthase polymorphisms are associated to therapeutic outcome of advanced non-small cell lung cancer patients treated with platinum-based chemotherapy. Mol Biol Rep 2014; 41: 3349-57. ArticlePubMedPDF
- 42. Taddia L, D'Arca D, Ferrari S, et al. Inside the biochemical pathways of thymidylate synthase perturbed by anticancer drugs: novel strategies to overcome cancer chemoresistance. Drug Resist Updat 2015; 23: 20-54. ArticlePubMed
- 43. Lam SW, Guchelaar HJ, Boven E. The role of pharmacogenetics in capecitabine efficacy and toxicity. Cancer Treat Rev 2016; 50: 9-22. ArticlePubMed
- 44. Hamzic S, Kummer D, Froehlich TK, et al. Evaluating the role of ENOSF1 and TYMS variants as predictors in fluoropyrimidine-related toxicities: an IPD meta-analysis. Pharmacol Res 2020; 152: 104594.ArticlePubMed
- 45. Palles C, Fotheringham S, Chegwidden L, et al. An evaluation of the diagnostic accuracy of a panel of variants in DPYD and a single variant in ENOSF1 for predicting common capecitabine related toxicities. Cancers (Basel) 2021; 13: 1497.ArticlePubMedPMC
- 46. He QY, Cheung YH, Leung SY, Yuen ST, Chu KM, Chiu JF. Diverse proteomic alterations in gastric adenocarcinoma. Proteomics 2004; 4: 3276-87. ArticlePubMed
- 47. Yang J, Xiong X, Wang X, Guo B, He K, Huang C. Identification of peptide regions of SERPINA1 and ENOSF1 and their protein expression as potential serum biomarkers for gastric cancer. Tumour Biol 2015; 36: 5109-18. ArticlePubMedPDF
- 48. Dolnick BJ. The rTS signaling pathway as a target for drug development. Clin Colorectal Cancer 2005; 5: 57-60. ArticlePubMed
- 49. Chu E, Koeller DM, Casey JL, et al. Autoregulation of human thymidylate synthase messenger RNA translation by thymidylate synthase. Proc Natl Acad Sci U S A 1991; 88: 8977-81. ArticlePubMedPMC
REFERENCES
Figure & Data
References
Citations
- Innovative biomaterial strategies for mitigating radiotherapy toxicity: multidimensional mechanistic interventions of nano-microscale materials and hydrogels
Yifan Liu, Fengdi Jiang, Jie Song, Huaijin Qiao, Junlong Dai, Hao Bai, Shuyu Zhang
Coordination Chemistry Reviews.2026; 549: 217313. CrossRef - Mebendazole impairs the expression and function of enzymes in nucleotide metabolism pathways, leading to Selective Cytotoxicity, Cell Cycle Arrest, and Damage to Cell Morphology in Gastric Cancer
Emerson Lucena da Silva, Felipe Pantoja Mesquita, Pedro Victor da Rocha Lima, José Hélio de Araújo Filho, Francisco Laio de Oliveira, Ana Beatriz da Lima, Pedro Filho Noronha Souza, Raquel Carvalho Montenegro
Chemico-Biological Interactions.2026; 430: 111973. CrossRef - Multi‐Omics Analysis of TYMS as a Prognostic Biomarker and Therapeutic Target for Lung Adenocarcinoma
Hansen Shi, Peijun Zhang, Jiayi Chen, Hua Li, Xiaohuai Zhang, Biyun zeng, Tiancai Liu, Tao Zeng
Cancer Medicine.2026;[Epub] CrossRef
 PubReader
 ePub Link
-
 Cite this Article
- Cite this Article
-
- Close
- Download Citation
- Close
- Figure
-


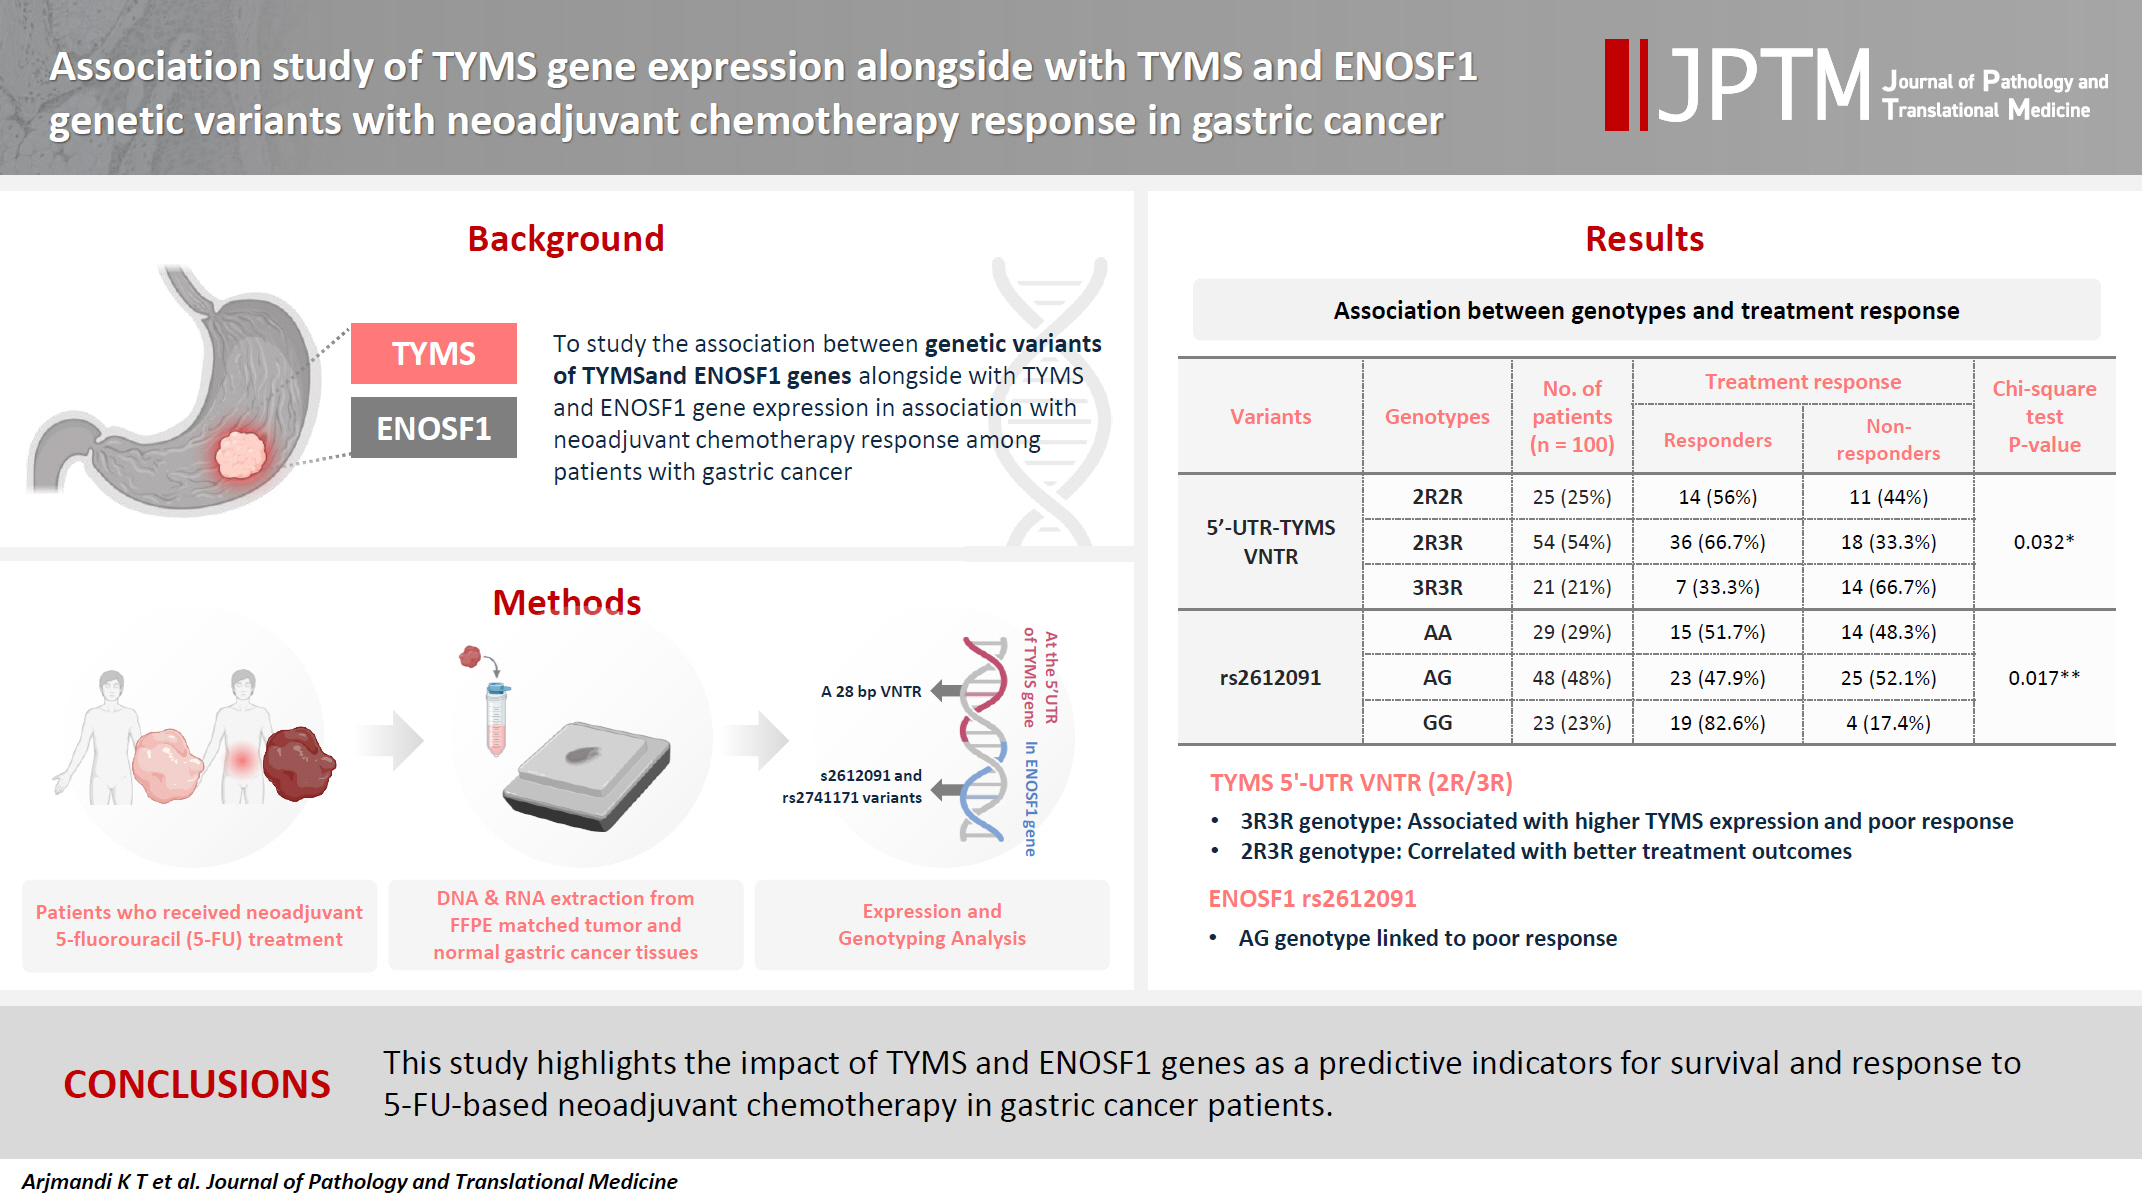


Fig. 1.
Fig. 2.
Graphical abstract
| Gene | Variant | Primer | Product size (bp) | |
|---|---|---|---|---|
| ENOSF1 | rs2612091 | Forward inner primer (A allele) | CTGGACATCCAGTGGCTCCTCAATCA | 247 |
| Reverse inner primer (G allele) | GGTACAGTCTTTAGGAGGAGCCGTGCAC | 197 | ||
| Forward outer primer | TGTGCATGATTCAGAATGTGACAAAATGG | 390 | ||
| Reverse outer primer | AAAAGAGACTCTTCACAGGGAGGTCAGCC | |||
| rs2741171 | Forward inner primer (A allele) | GGGTTTCACCATGTTGATCAGGTGGA | 222 | |
| Reverse inner primer (G allele) | GCGGATCACCTGAGGTCAGGAGTATGATAC | 288 | ||
| Forward outer primer | CAATTTCCTGCCACAGCCAAAATTTCTC | 454 | ||
| Reverse outer primer | TGACTCTCAGAGTGCACAAGCAGCACTT | |||
| TYMS | TYMS 28-bp VNTR | Forward primer | CGTGGCTCCTGCGTTTCC | 210 (2R) |
| Reverse primer | GAGCCGGCCACAGGCAT | 238 (3R) | ||
| Gene | Variant | Genotype | Frequency, n (%) |
|---|---|---|---|
| TYMS | 5′-UTR–TYMS VNTR | 2R3R | 54 (54.0) |
| 2R2R | 25 (25.0) | ||
| 3R3R | 21 (21.0) | ||
| ENOSF1 | rs2612091 | GG | 23 (23.0) |
| AG | 48 (48.0) | ||
| AA | 29 (29.0) | ||
| rs2741171 | GG | 48 (48.0) | |
| AA | 16 (16.0) | ||
| AG | 36 (36.0) |
| Variant | Genotype | No. of patients (n = 100) | Treatment response |
Chi-square test p-value | |
|---|---|---|---|---|---|
| Responder | Nonresponder | ||||
| 5′-UTR–TYMS VNTR | 2R2R | 25 (25.0) | 14 (56.0) | 11 (44.0) | .032 |
| 2R3R | 54 (54.0) | 36 (66.7) | 18 (33.3) | ||
| 3R3R | 21 (21.0) | 7 (33.3) | 14 (66.7) | ||
| rs2612091 | AA | 29 (29.0) | 15 (51.7) | 14 (48.3) | .017 |
| AG | 48 (48.0) | 23 (47.9) | 25 (52.1) | ||
| GG | 23 (23.0) | 19 (82.6) | 4 (17.4) | ||
| rs2741171 | AA | 16 (16.0) | 11 (68.8) | 5 (31.3) | .065 |
| AG | 36 (36.0) | 15 (41.7) | 21 (58.3) | ||
| GG | 48 (48.0) | 31 (64.6) | 17 (35.4) | ||
| Variant | Genotype | Survival time (mo) |
HR (95% CI) | p-value | |
|---|---|---|---|---|---|
| Mean (95% CI) | p-value | ||||
| 5′-UTR-TYMS VNTR | 2R2R | 23.44 (13.84–33.04) | .003 |
1 (reference group) | - |
| 2R3R | 39.36 (32.62–46.1) | 0.47 (0.25–0.87) | .020 | ||
| 3R3R | 47.17 (37.3–57.04) | 0.24 (0.09–0.64) | .005 | ||
| rs2612091 | AA | 30.71 (21.37–40.04) | .170 | 1 (reference group) | |
| AG | 36.39 (28.97–43.8) | 0.73 (0.39–1.37) | .320 | ||
| GG | 45.80 (36.17–55.44) | 0.47 (0.2–1.08) | .080 | ||
| rs2741171 | AA | 36.84 (24.62–49.07) | .970 | 1 (reference group) | |
| AG | 37.41 (28.93–45.88) | 0.92 (0.39–2.16) | .850 | ||
| GG | 36.79 (29.31–44.28) | 1 (0.45–2.23) | .990 | ||
| Variant | Genotype | ENOSF1 expression, n (%) |
p-value | |
|---|---|---|---|---|
| Low | High | |||
| 5′-UTR–TYMS VNTR | 2R2R | 25 (100) | 0 | <.001 |
| 2R3R | 36 (66.7) | 18 (33.3) | ||
| 3R3R | 0 | 21 (21) | ||
| ENOSF1 rs2612091 | GG | 17 (73.9) | 6 (26.1) | .160 |
| AG | 36 (75.0) | 12 (25.0) | ||
| AA | 16 (25.2) | 13 (44.8) | ||
| ENOSF1 rs2741171 | GG | 36 (75.0) | 12 (25.0) | .310 |
| AG | 21 (58.3) | 15 (41.7) | ||
| AA | 12 (75.0) | 4 (25.0) | ||
| Gene | Variant expression | Survival time (mo) |
HR (95% CI) | p-value | |
|---|---|---|---|---|---|
| Mean (95% CI) | p-value | ||||
| TYMS | Low | 1.553 (0.828–2.908) | .218 | 0.633 (0.344–1.167) | .165 |
| High | 0.644 (0.343–1.207) | ||||
| ENOSF1 | Low | 1.063 (0.540–2.087) | .810 | 1.353 (0.601–3.042) | .464 |
| High | 0.941 (0.479–1.849) | ||||
| OR | 95% CI for OR |
p-value | ||
|---|---|---|---|---|
| Lower | Upper | |||
| ENOSF1 | 5.95 | 2.36 | 15.01 | <.001 |
The tetra-ARMS polymerase chain reaction (PCR) method was used for
The 2R3R genotype was the most frequent (54.0%) among all cases with 5′-UTR–
Values are presented as number (%). 5′-UTR, 5′ untranslated region; Among the studied genotypes, a significant correlation was found between VNTR genotype and treatment response (p = .032). The 2R3R genotype was more common in responders, and the 3R3R genotype was more common among non-responders; bGenotypes of rs2612091 showed a significant association (p = .017), patients who did not respond to treatment showed more frequent AG genotype.
HR, hazard ratio; CI, confidence interval; 5′-UTR, 5′ untranslated region; The highest and lowest average survival times of people after 5-FU treatment were in patients with 3R3R and 2R2R genotypes, respectively, and the observed difference was significant (p = .003). Such a different also was observed in the Cox model, where the risk of death in those with 3R3R and 2R3R variants was lower than in those with 2R2R variants (reference group) at 0.24 and 0.47, respectively. The overall survival of patients with rs2612091 or rs2741171 after 5-FU treatment was not significant (p = .170 and p = .970, respectively). In the Cox model, the risk ratio of death in patients with different genotypes of rs2612091 or rs2741171 variants compared to the reference group was not significant (p > .05).
There was a significant relationship between
No significant relationship was observed between expression of these genes and the survival time of patients (p = .218 and p = .810, respectively). HR, hazard ratio;
Data analysis showed increased expression of

