 E-submission
Articles
- Page Path
- HOME > J Pathol Transl Med > Volume 58(2); 2024 > Article
-
Original Article
Clinicopathological implications of immunohistochemical expression of TBX21, CXCR3, GATA3, CCR4, and TCF1 in nodal follicular helper T-cell lymphoma and peripheral T-cell lymphoma, not otherwise specified -
Bogyeong Han1
 , Sojung Lim1, Jeemin Yim2, Young Keun Song1, Jiwon Koh1, Sehui Kim3, Cheol Lee1, Young A Kim2, Yoon Kyung Jeon1,4
 -
Journal of Pathology and Translational Medicine 2024;58(2):59-71.
DOI: https://doi.org/10.4132/jptm.2024.01.04
Published online: January 22, 2024
1Department of Pathology, Seoul National University Hospital, Seoul National University College of Medicine, Seoul, Korea
2Department of Pathology, Seoul Metropolitan Government Seoul National University Boramae Medical Center, Seoul, Korea
3Department of Pathology, Korea University Guro Hospital, Seoul, Korea
4Seoul National University Cancer Research Institute, Seoul, Korea
-
Corresponding Author: Yoon Kyung Jeon, MD, PhD, Department of Pathology, Seoul National University Hospital, Seoul National University College of Medicine, 103 Daehak-ro, Jongno-gu, Seoul 03080, Korea Tel: +82-2-740-8323, Fax: +82-2-743-5530, E-mail: ykjeon@snu.ac.kr
Corresponding Author: Young A Kim, MD, PhD, Department of Pathology, Seoul Metropolitan Government Boramae Hospital, Seoul National University College of Medicine, 20, Boramae-ro 5-gil, Dongjak-gu, Seoul 07061, Korea Tel: +82-2-870-2643, Fax: +82-2-831-0261, E-mail: fyakim@snu.ac.kr
© 2024 The Korean Society of Pathologists/The Korean Society for Cytopathology
This is an Open Access article distributed under the terms of the Creative Commons Attribution Non-Commercial License (https://creativecommons.org/licenses/by-nc/4.0) which permits unrestricted non-commercial use, distribution, and reproduction in any medium, provided the original work is properly cited.

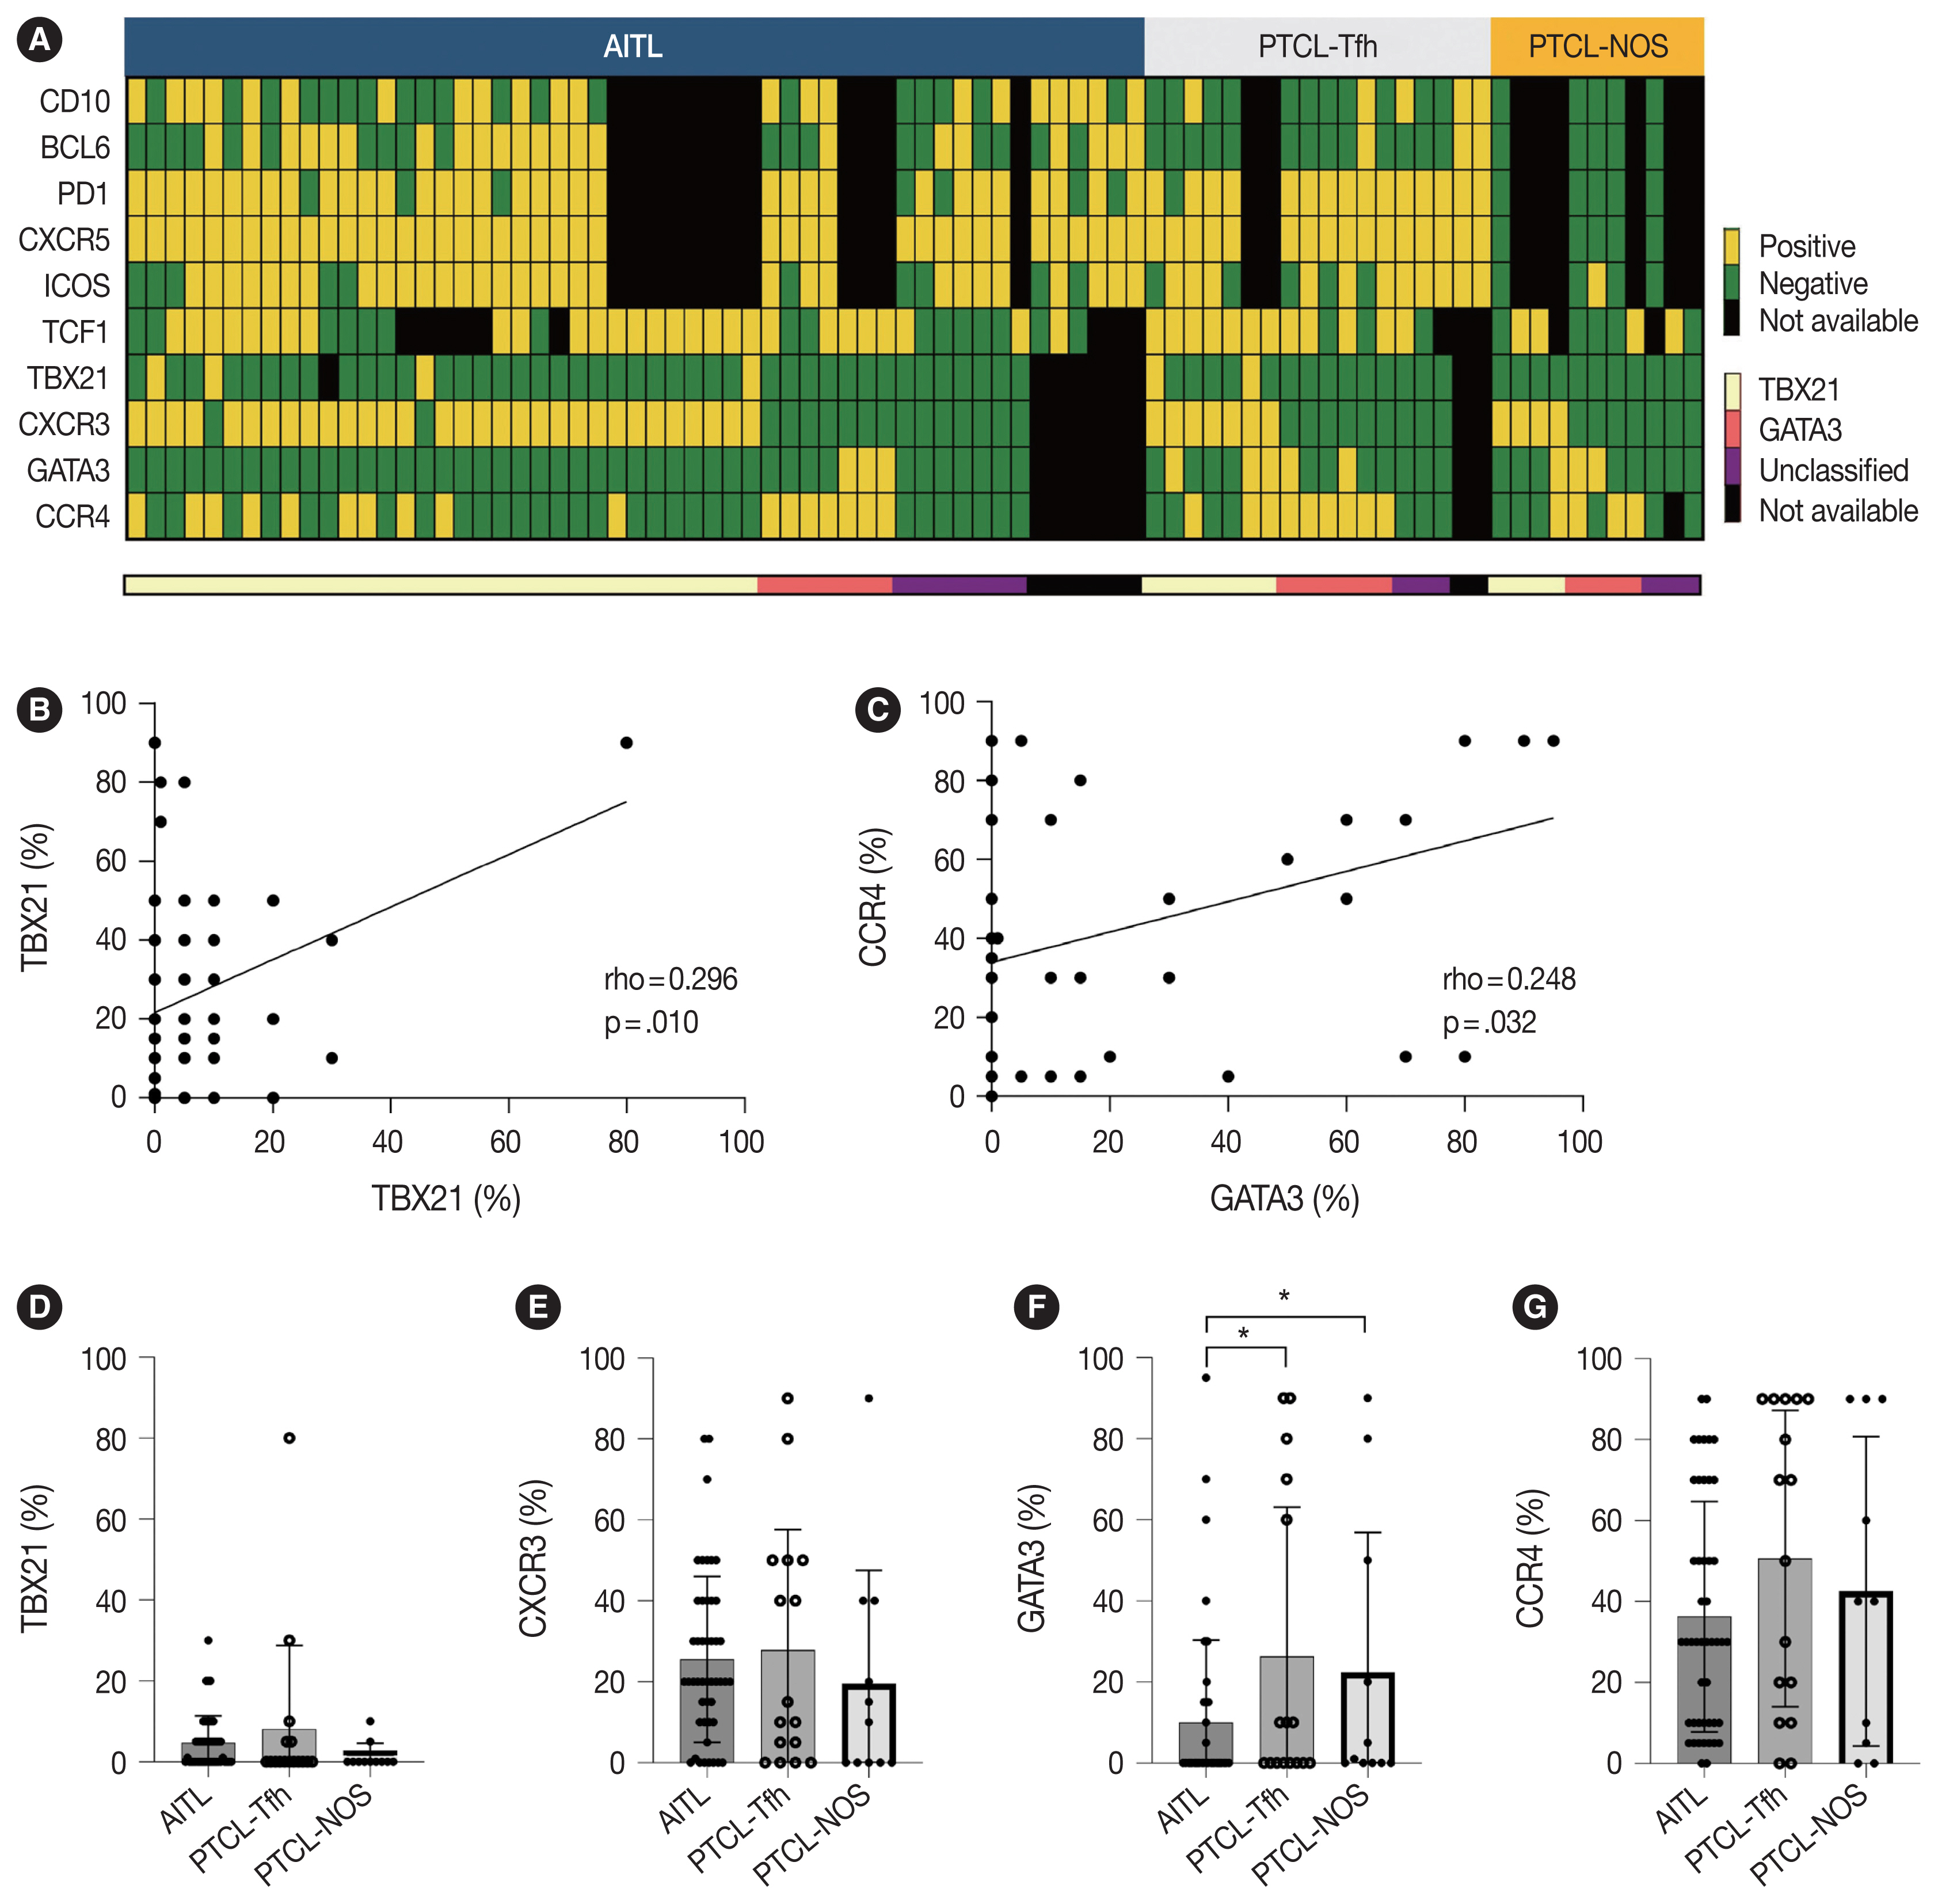


Figure & Data
References
Citations
- T-bet: biological functions, molecular mechanisms, and therapeutic applications: a systematic review
Xiaowen Yang, Min Sun, Xinyi Tang, Xiaoyuan Zhang, Wenzhi Shen
Frontiers in Immunology.2026;[Epub] CrossRef - CXCR Family and Hematologic Malignancies in the Bone Marrow Microenvironment
Yanquan Liu, Huanwen Tang
Biomolecules.2025; 15(5): 716. CrossRef - Diagnostic and therapeutic pathways for lymphoma patients: expert consensus through Nominal Group Technique and Delphi methodology
Attilio Guarini, Valentina Bozzoli, Sabino Ciavarella, Michele Cimminiello, Francesca Donatelli, Angelo Fama, Vincenza Fernanda Fesce, Vincenzo Fraticelli, Francesco Gaudio, Giuseppina Greco, Augusto Martellini, Francesca Merchionne, Rosanna Maria Miccoli
Frontiers in Oncology.2025;[Epub] CrossRef - Prognostic Significance of TBX21 and GATA3 Subtype Classification in Indolent Adult T‐Cell Leukemia‐Lymphoma With Cutaneous Lesions
Kazuhiro Kawai, Youhei Uchida, Takuro Kanekura
The Journal of Dermatology.2025; 52(11): 1674. CrossRef
 PubReader
 ePub Link
-
 Cite this Article
- Cite this Article
-
- Close
- Download Citation
- Close
- Figure
-


Fig. 1
Fig. 2
Fig. 3
Fig. 4
| Variable | PTCL (n = 82) | AITL (n = 53) | PTCL-Tfh (n = 18) | nTFHL (n = 71) | PTCL-NOS (n = 11) | Non-AITL (n = 29) | p-value | |||||
|---|---|---|---|---|---|---|---|---|---|---|---|---|
|
| ||||||||||||
| Three groups |
AITL vs. PTCL-NOS | PTCL-Tfh vs. PTCL-NOS | AITL vs. PTCL-Tfh | nTFHL vs. PTCL-NOS | AITL vs. non-AITL | |||||||
| Sex | ||||||||||||
| Female | 34 (41.5) | 22 (41.5) | 11 (61.1) | 33 (46.5) | 1 (9.1) | 12 (41.4) | .022 | .041 | .006 | .150 | .019 | .991 |
| Male | 48 (58.5) | 31 (58.5) | 7 (38.9) | 38 (53.5) | 10 (90.9) | 17 (58.6) | ||||||
| Age (yr) | ||||||||||||
| ≤ 60 | 32 (39.0) | 22 (41.5) | 5 (27.8) | 27 (38.0) | 5 (45.5) | 10 (34.5) | .526 | .809 | .331 | .300 | .638 | .533 |
| > 60 | 50 (61.0) | 31 (58.5) | 13 (72.2) | 44 (62.0) | 6 (54.5) | 19 (65.5) | ||||||
| Ann Arbor stage | ||||||||||||
| 1–2 | 10 (12.2) | 4 (7.5) | 2 (11.1) | 6 (8.5) | 4 (36.4) | 6 (20.7) | .029 | .009 | .103 | .639 | .008 | .082 |
| 3–4 | 72 (87.8) | 49 (92.5) | 16 (88.9) | 65 (91.5) | 7 (63.6) | 23 (79.3) | ||||||
| IPI score | ||||||||||||
| 0–2 | 32 (39.0) | 21 (39.6) | 4 (22.2) | 25 (35.2) | 7 (63.6) | 11 (37.9) | .084 | .144 | .026 | .182 | .072 | .881 |
| 3–5 | 50 (61.0) | 32 (60.4) | 14 (77.8) | 46 (64.8) | 4 (36.4) | 18 (62.1) | ||||||
| Extranodal site | ||||||||||||
| ≤ 1 | 58 (71.6) | 39 (75.0) | 11 (61.1) | 50 (71.4) | 8 (72.7) | 19 (65.5) | .528 | .875 | .523 | .261 | .929 | .364 |
| > 1 | 23 (28.4) | 13 (25.0) | 7 (38.9) | 20 (28.6) | 3 (27.3) | 10 (34.5) | ||||||
| Serum LDH | ||||||||||||
| Normal | 19 (23.8) | 10 (19.6) | 4 (22.2) | 14 (20.3) | 5 (45.5) | 9 (31.0) | .186 | .069 | .189 | .813 | .069 | .248 |
| Elevated | 61 (76.3) | 41 (80.4) | 14 (77.8) | 55 (79.7) | 6 (54.5) | 20 (69.0) | ||||||
| ≥2 | 12 (20.3) | 8 (20.0) | 4 (36.4) | 12 (16.9) | 0 | 4 (21.1) | ||||||
| B symptoms | ||||||||||||
| Absent | 48 (60.8) | 26 (51.0) | 16 (94.1) | 42 (61.8) | 6 (54.5) | 22 (78.6) | .006 | .083 | .013 | .002 | .649 | .016 |
| Present | 31 (39.2) | 25 (49.0) | 1 (5.9) | 26 (38.2) | 5 (45.5) | 6 (21.4) | ||||||
| BM involvement | ||||||||||||
| Absent | 34 (43.0) | 20 (39.2) | 7 (41.2) | 27 (39.7) | 7 (63.6) | 14 (50.0) | .328 | .138 | .246 | .886 | .137 | .354 |
| Present | 45 (57.0) | 31 (60.8) | 10 (58.8) | 41 (60.3) | 4 (36.4) | 14 (50.0) | ||||||
| Variable | AITL (n = 53) | PTCL-Tfh (n = 18) | nTFHL (n = 71) | PTCL- NOS (n = 11) | Non-AITL (n = 29) | p-value | |||||
|---|---|---|---|---|---|---|---|---|---|---|---|
|
| |||||||||||
| Three groups |
AITL vs. PTCL-NOS | PTCL-Tfh vs. PTCL- NOS | AITL vs. PTCL-Tfh | nTFHL vs. PTCL-NOS | AITL vs. non-AITL | ||||||
| CD10 | |||||||||||
| Negative | 19 (46.3) | 11 (68.8) | 30 (52.6) | 5 (100) | 16 (76.2) | .038 | .023 | .152 | .128 | .041 | .025 |
| Positive | 22 (53.7) | 5 (31.3) | 27 (47.4) | 0 | 5 (23.8) | ||||||
| BCL6 | |||||||||||
| Negative | 19 (46.3) | 13 (81.3) | 32 (56.1) | 5 (100) | 18 (85.7) | .009 | .023 | .296 | .017 | .055 | .003 |
| Positive | 22 (53.7) | 3 (18.8) | 25 (43.9) | 0 | 3 (14.3) | ||||||
| PD-1 | |||||||||||
| Negative | 7 (17.1) | 1 (6.3) | 8 (14) | 5 (100) | 6 (28.6) | < .001 | < .001 | < .001 | .290 | < .001 | .293 |
| Positive | 34 (82.9) | 15 (93.8) | 49 (86) | 0 | 15 (71.4) | ||||||
| CXCR5 | |||||||||||
| Negative | 0 | 0 | 0 | 5 (100) | 5 (23.8) | < .001 | < .001 | < .001 | - | < .001 | .001 |
| Positive | 41 (100) | 16 (100) | 57 (100) | 0 | 16 (76.2) | ||||||
| ICOS | |||||||||||
| Negative | 10 (24.4) | 5 (31.3) | 15 (26.3) | 4 (80.0) | 9 (42.9) | .039 | .011 | .055 | .597 | .013 | .136 |
| Positive | 31 (75.6) | 11 (68.8) | 42 (73.7) | 1 (20.0) | 12 (57.1) | ||||||
| TCF1 | |||||||||||
| Negative | 16 (36.4) | 3 (20.0) | 19 (32.2) | 5 (55.6) | 8 (33.3) | .204 | .283 | .074 | .241 | .172 | .803 |
| Positive | 28 (63.6) | 12 (80.0) | 40 (67.8) | 4 (44.4) | 16 (66.7) | ||||||
| TBX21 | |||||||||||
| Negative | 42 (91.3) | 14 (87.5) | 56 (90.3) | 11 (100) | 25 (92.6) | .500 | .310 | .223 | .658 | .281 | .847 |
| Positive | 4 (8.7) | 2 (12.5) | 6 (9.7) | 0 | 2 (7.4) | ||||||
| CXCR3 | |||||||||||
| Negative | 16 (34.0) | 9 (56.3) | 25 (39.7) | 7 (63.6) | 16 (59.3) | .101 | .071 | .701 | .117 | .139 | .035 |
| Positive | 31 (66.0) | 7 (43.8) | 38 (60.3) | 4 (36.4) | 11 (40.7) | ||||||
| GATA3 | |||||||||||
| Negative | 44 (93.6) | 11 (68.8) | 55 (87.3) | 8 (72.7) | 19 (70.4) | .025 | .041 | .824 | .010 | .210 | .007 |
| Positive | 3 (6.4) | 5 (31.3) | 8 (12.7) | 3 (27.3) | 8 (29.6) | ||||||
| CCR4 | |||||||||||
| Negative | 30 (63.8) | 7 (43.8) | 37 (58.7) | 6 (60.0) | 13 (50.0) | .369 | .820 | .420 | .159 | .940 | .250 |
| Positive | 17 (36.2) | 9 (56.3) | 26 (41.3) | 4 (40.0) | 13 (50.0) | ||||||
| Subclassification | |||||||||||
| TBX21 | 33 (70.2) | 7 (43.8) | 40 (63.5) | 4 (36.4) | 11 (40.7) | .135 | .102 | .860 | .112 | .239 | .035 |
| GATA3 | 7 (14.9) | 6 (37.5) | 13 (20.6) | 4 (36.4) | 10 (37.0) | ||||||
| Unclassified | 7 (14.9) | 3 (18.8) | 10 (15.9) | 3 (27.3) | 6 (22.2) | ||||||
| AITL | PTCL-Tfh | nTFHL | PTCL-NOS | |||||||||||||
|---|---|---|---|---|---|---|---|---|---|---|---|---|---|---|---|---|
|
|
|
|
| |||||||||||||
| TBX21 (n = 33) | GATA3 (n = 7) | Unclassified (n = 7) | p-value | TBX21 (n = 7) | GATA3 (n = 6) | Unclassified (n = 3) | p-value | TBX21 (n = 40) | GATA3 (n = 13) | Unclassified (n = 10) | p-value | TBX21 (n = 4) | GATA3 (n = 4) | Unclassified (n = 3) | p-value | |
| Sex | ||||||||||||||||
| Female | 12 (36.4) | 3 (42.9) | 3 (42.9) | .916 | 6 (85.7) | 1 (16.7) | 3 (100) | .012 | 18 (45.0) | 4 (30.8) | 6 (60.0) | .374 | 0 | 0 | 1 (33.3) | .231 |
| Male | 21 (63.6) | 4 (57.1) | 4 (57.1) | 1 (14.3) | 5 (83.3) | 0 | 22 (55.0) | 9 (69.2) | 4 (40.0) | 4 (100) | 4 (100) | 2 (66.7) | ||||
| Age (yr) | ||||||||||||||||
| ≤ 60 | 16 (48.5) | 4 (57.1) | 1 (14.3) | .197 | 1 (14.3) | 3 (50.0) | 1 (33.3) | .382 | 17 (42.5) | 7 (53.8) | 2 (20.0) | .254 | 2 (50.0) | 1 (25.0) | 2 (66.7) | .535 |
| > 60 | 17 (51.5) | 3 (42.9) | 6 (85.7) | 6 (85.7) | 3 (50.0) | 2 (66.7) | 23 (57.5) | 6 (46.2) | 8 (80.0) | 2 (50.0) | 3 (75.0) | 1 (33.3) | ||||
| Ann Arbor stage | ||||||||||||||||
| 1–2 | 3 (9.1) | 0 | 0 | .507 | 1 (14.3) | 0 | 1 (33.3) | .356 | 4 (100) | 0 | 1 (10.0) | .494 | 1 (25.0) | 1 (25.0) | 2 (66.7) | .441 |
| 3–4 | 30 (90.9) | 7 (100) | 7 (100) | 6 (85.7) | 6 (100) | 2 (66.7) | 36 (90.0) | 13 (100) | 9 (90.0) | 3 (75.0) | 3 (75.0) | 1 (33.3) | ||||
| IPI score | ||||||||||||||||
| 0–2 | 13 (39.4) | 4 (57.1) | 2 (28.6) | .539 | 1 (14.3) | 1 (16.7) | 1 (33.3) | .768 | 14 (35.0) | 5 (38.5) | 3 (30.0) | .915 | 3 (75.0) | 2 (50.0) | 2 (66.7) | .757 |
| 3–5 | 20 (60.6) | 3 (42.9) | 5 (71.4) | 6 (85.7) | 5 (83.3) | 2 (66.7) | 26 (65.0) | 8 (61.5) | 7 (70.0) | 1 (25.0) | 2 (50.0) | 1 (33.3) | ||||
| Extranodal site | ||||||||||||||||
| ≤ 1 | 24 (72.7) | 5 (83.3) | 6 (85.7) | .693 | 3 (42.9) | 4 (66.7) | 2 (66.7) | .635 | 27 (67.5) | 9 (75.0) | 8 (80.0) | .696 | 3 (75.0) | 2 (50.0) | 3 (100) | .337 |
| > 1 | 9 (27.3) | 1 (16.7) | 1 (14.3) | 4 (57.1) | 2 (33.3) | 1 (33.3) | 13 (32.5) | 3 (25.0) | 2 (20.0) | 1 (25.0) | 2 (50.0) | 0 | ||||
| Serum LDH | ||||||||||||||||
| Normal | 8 (25.0) | 1 (14.3) | 0 | .343 | 1 (14.3) | 2 (33.3) | 0 | .445 | 9 (23.1) | 3 (23.1) | 0 | .275 | 3 (75.0) | 1 (25.0) | 1 (33.3) | .323 |
| Elevated | 24 (75.0) | 6 (85.7) | 6 (100) | 6 (85.7) | 4 (66.7) | 3 (100) | 30 (76.9) | 10 (76.9) | 9 (100) | 1 (25.0) | 3 (75.0) | 2 (66.7) | ||||
| ECOG PS | ||||||||||||||||
| < 2 | 21 (80.8) | 6 (100) | 2 (40.0) | .048 | 3 (75.0) | 2 (40.0) | 1 (100) | .392 | 24 (80.0) | 8 (72.7) | 3 (50.0) | .303 | 4 (100) | 3 (100) | 1 (100) | > .99 |
| ≥ 2 | 5 (19.2) | 0 | 3 (60.0) | 1 (25.0) | 3 (60.0) | 0 | 6 (20.0) | 3 (27.3) | 3 (50.0) | 0 | 0 | 0 | ||||
| B symptoms | ||||||||||||||||
| Absent | 16 (51.6) | 3 (42.9) | 3 (42.9) | .862 | 7 (100) | 4 (80.0) | 3 (100) | .343 | 23 (60.5) | 7 (58.3) | 6 (60.0) | .991 | 3 (75.0) | 3 (75.0) | 0 | .084 |
| Present | 15 (48.4) | 4 (57.1) | 4 (57.1) | 0 | 1 (20.0) | 0 | 15 (39.5) | 5 (41.7) | 4 (40.0) | 1 (25.0) | 1 (25.0) | 3 (100) | ||||
| BM involvement | ||||||||||||||||
| Absent | 13 (39.4) | 4 (57.1) | 1 (16.7) | .329 | 2 (28.6) | 3 (50.0) | 1 (50.0) | .700 | 15 (37.5) | 7 (53.8) | 2 (25.0) | .388 | 2 (50.0) | 2 (50.0) | 3 (100) | .308 |
| Present | 20 (60.6) | 3 (42.9) | 5 (83.3) | 5 (71.4) | 3 (50.0) | 1 (50.0) | 25 (62.5) | 6 (46.2) | 6 (75.0) | 2 (50.0) | 2 (50.0) | 0 | ||||
Values are presented as number (%) unless otherwise indicated. PTCL, peripheral T-cell lymphoma; AITL, angioimmunoblastic T-cell lymphoma; PTCL-Tfh, peripheral T-cell lymphoma of follicular helper T-cell phenotype; nT-FHL, nodal T-follicular helper (TFH) cell lymphoma; PTCL-NOS, peripheral T-cell lymphoma, not otherwise specified; IPI, International Prognostic Index; LDH, lactate dehydrogenase; BM, bone marrow. AITL vs. PTCL-Tfh vs. PTCL-NOS.
Values are presented as number (%) unless otherwise indicated. AITL, angioimmunoblastic T-cell lymphoma; PTCL-Tfh, peripheral T-cell lymphoma of follicular helper T-cell phenotype; nTFHL, nodal T-follicular helper (TFH) cell lymphoma; PTCL-NOS, peripheral T-cell lymphoma, not otherwise specified; PD-1, programmed death-1; CXCR5, C-X-C motif chemokine receptor 5; ICOS, inducible T cell costimulator; TCF1, T-cell factor-1; TBX21, T-box transcription factor 21; GATA3, GATA binding protein 3; CCR4, C-C motif chemokine receptor 4. AITL vs. PTCL-Tfh vs. PTCL-NOS.
Values are presented as number (%). TBX21, T-box transcription factor 21; GATA3, GATA binding protein 3; AITL, angioimmunoblastic T-cell lymphoma; PTCL-Tfh, peripheral T-cell lymphoma of follicular helper T-cell phenotype; nTFHL, nodal T-follicular helper (TFH) cell lymphoma; PTCL-NOS, peripheral T-cell lymphoma, not otherwise specified; IPI, International Prognostic Index; LDH, lactate dehydrogenase; ECOG PS, Eastern Cooperative Oncology Group performance status; BM, bone marrow.

