 E-submission
Articles
- Page Path
- HOME > J Pathol Transl Med > Volume 56(5); 2022 > Article
-
Original Article
Inflammation and tissue remodeling contribute to fibrogenesis in stricturing Crohn’s disease: image processing and analysis study -
Mustafa Erdem Arslan1
 , Rupinder Brar1, Lianna Goetz2, Dipti Karamchandani2,3, Michael W. Mikula4, Kyle Hodge5, Hua Li1, Sangtae Ahn6, Hwajeong Lee1
 -
Journal of Pathology and Translational Medicine 2022;56(5):239-248.
DOI: https://doi.org/10.4132/jptm.2022.05.18
Published online: July 4, 2022
1Department of Pathology, Albany Medical Center, Albany, NY, USA
2Division of Anatomic Pathology, Department of Pathology, Penn State Health Milton S. Hershey Medical Center, Hershey, PA, USA
3Division of Pathology, University of Texas Southwestern Medical Center, Dallas, TX, USA
4Department of Pathology, Johns Hopkins Hospital, Baltimore, MD, USA
5Albany Medical College, Albany, NY, USA
6GE Global Research, Niskayuna, NY, USA
- Corresponding Author: Hwajeong Lee, MD, Department of Pathology, Albany Medical Center, 47 New Scotland Ave., MC81, Albany, NY 12208, USA Tel: +1-518-262-6254, Fax: +1-518-262-3663, E-mail: LeeH5@amc.edu
© 2022 The Korean Society of Pathologists/The Korean Society for Cytopathology
This is an Open Access article distributed under the terms of the Creative Commons Attribution Non-Commercial License (http://creativecommons.org/licenses/by-nc/4.0) which permits unrestricted non-commercial use, distribution, and reproduction in any medium, provided the original work is properly cited.
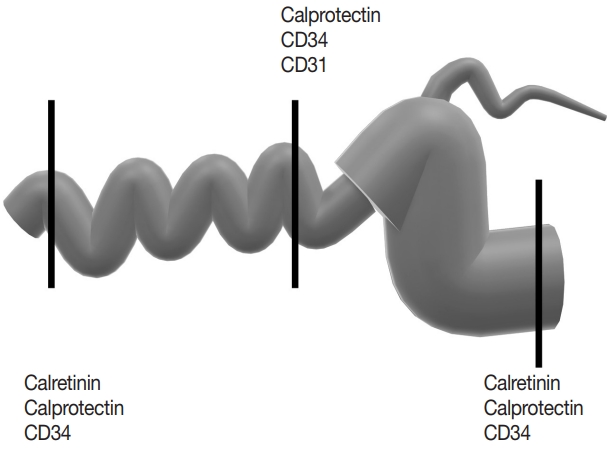


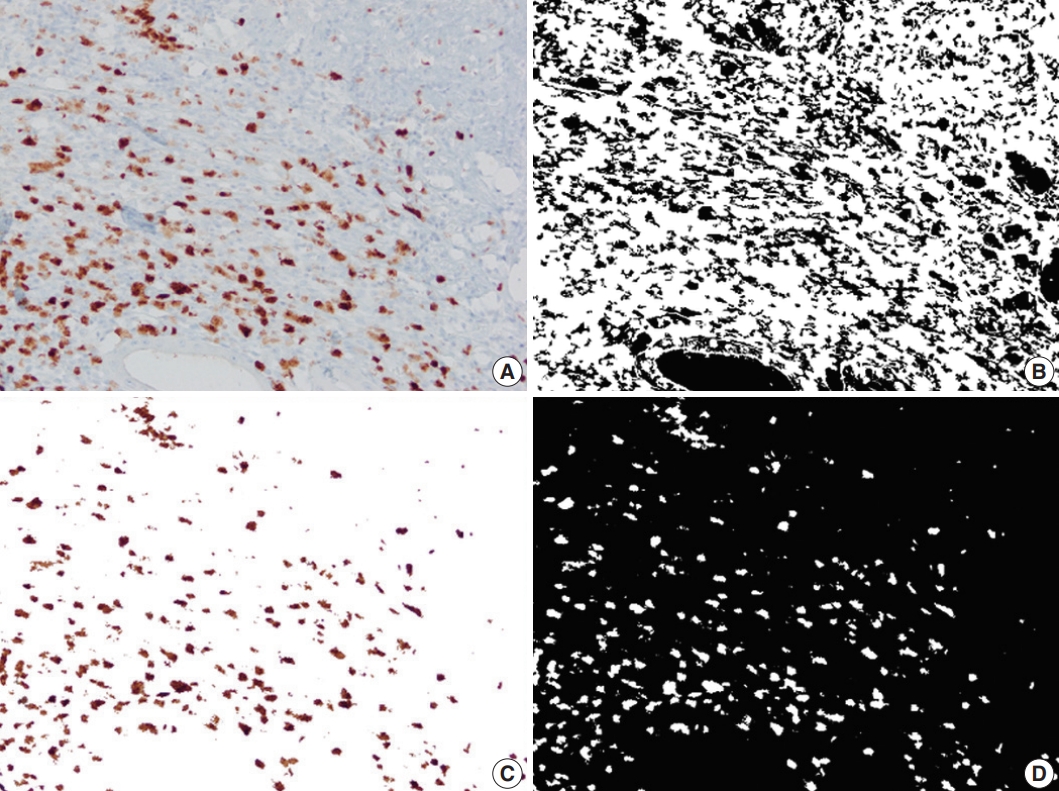
Figure & Data
References
Citations
- Pathophysiologic implications and therapeutic potentials of telocytes in multiorgan fibrosis
Irene Rosa, Eloisa Romano, Bianca Saveria Fioretto, Mirko Manetti
Current Opinion in Rheumatology.2026; 38(1): 26. CrossRef - Serum S100A8/A9 Correlates to Surgery‐Free Interval in Idiopathic Subglottic Stenosis
Laura M. Mafla, Raymond J. So, Ibrahim Abd‐Elazem, Samuel L. Collins, Yee Chan‐Li, Gabriela Lilly, Ioan A. Lina, Alexander H. Gelbard, Alexander T. Hillel, Kevin M. Motz
The Laryngoscope.2025; 135(5): 1724. CrossRef - Telocytes in inflammatory bowel diseases: contributions to pathology and therapeutic potentials
Ronaldo Paolo Panganiban, Christina McAninch, Marina Chulkina, Irina V. Pinchuk
Frontiers in Cell and Developmental Biology.2025;[Epub] CrossRef - Synergistic effects of vedolizumab and JAK 1,2,3 inhibitors in Crohn’s disease: insights from a systems biology and artificial intelligence-based approach
Ignacio Marín-Jiménez, Mónica Sierra-Ausín, Teresa Letosa-Abián, Jesús Aparicio, Carmen Montoto-Otero, Silvia Sánchez-Ramón
Frontiers in Immunology.2025;[Epub] CrossRef
 PubReader
 ePub Link
-
 Cite this Article
- Cite this Article
-
- Close
- Download Citation
- Close
- Figure
-

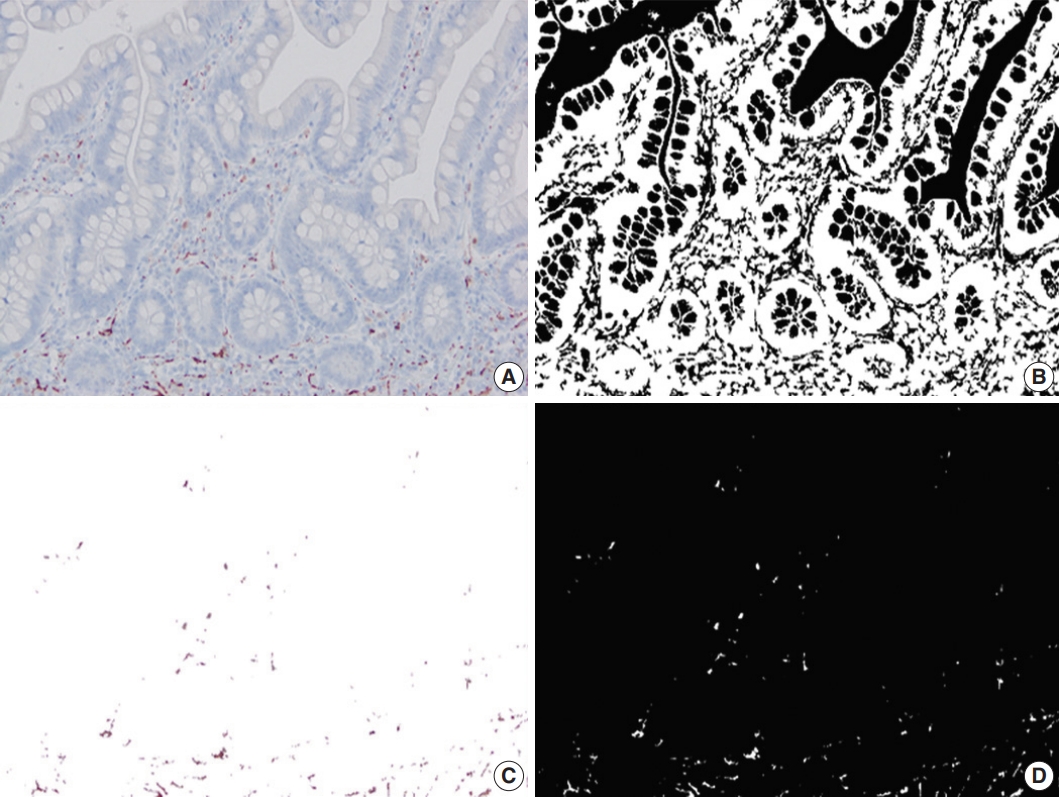
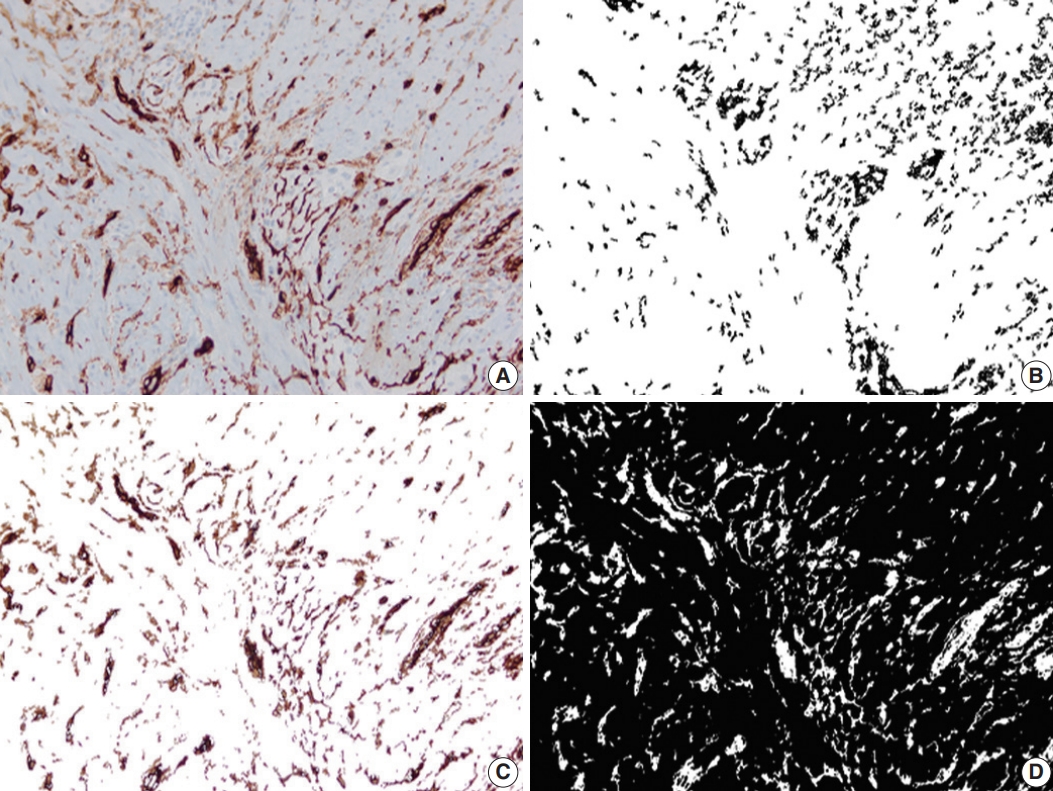


Fig. 1.
Fig. 2.
Fig. 3.
Fig. 4.
| Parameter | All CD | Stricturing CD | Inflammatory CD | Controls |
|---|---|---|---|---|
| No. of cases | 44 | 31 | 13 | 20 |
| No. of images | 1,791 | 1,321 | 470 | 486 |
| Proximal margin | ||||
| Proximal-PC-calr, mean (%) | 1.352 | 1.415 | 1.202 | 1.113 |
| Proximal-PC-CD34, mean (%) | 17.718 | 17.245 | 19.284 | 17.800 |
| Proximal/mid-CD34 | 1.479 | 1.481 | 1.439 | - |
| Proximal-PC-calp, mean (%) | 0.362 | 0.397 | 0.218 | 0.338 |
| Distal margin | ||||
| Distal-PC-calr, mean (%) | 2.407 | 2.480 | 2.234 | 1.434 |
| Distal-PC-CD34, mean (%) | 18.972 | 19.287 | 16.297 | 15.156 |
| Proximal/distal-PC-calr | 0.588 | 0.594 | 0.574 | 1.062 |
| Distal-PC-calp, mean (%) | 0.396 | 0.436 | 0.274 | 1.120 |
| Mid-section | ||||
| Mid-PC-CD34, mean (%) | 13.473 | 13.087 | 14.394 | - |
| Mid-PC-CD34-hotspot, mean (%) | 17.330 | 16.795 | 18.606 | - |
| Mid-PC-calp, mean (%) | 10.975 | 9.929 | 13.468 | - |
| Mid-PC-calp-hotspot, mean (%) | 16.524 | 15.139 | 19.826 | - |
| p-PC-calr | p/d-PC-calr | p-PC-CD34 | p/m-PC-CD34 | m-PC-CD34 | m-PC-CD34-hotspot | m-PC-calphotspot | d-PC-CD34 | ||
|---|---|---|---|---|---|---|---|---|---|
| Proximal margin | |||||||||
| SM | - | - | - | 0.41 (0.46) | –0.46 (–0.45) | –0.42 (–0.42) | - | - | |
| SM/MP | 0.39 (0.40) | 0.37 (0.42) | - | 0.31 (0.42) | –0.32 | –0.32 | - | - | |
| SM/(SM + MP) | 0.34 | 0.33 (0.37) | - | (0.40) | –0.31 | –0.31 | - | - | |
| MP | - | - | (–0.37) [0.60] | [0.62] | - | - | - | - | |
| MP/(SM + MP) | –0.34 | - | - | - | 0.50 | 0.48 | - | - | |
| Mid-section | |||||||||
| SM | - | - | - | - | - | - | - | (0.39) | |
| SM/MP | - | - | - | - | - | - | (0.39) | - | |
| SM/(SM + MP) | –0.39 [–0.56] | –0.35 (–0.38) | - | - | - | - | - | - | |
| MP | [0.82] | - | - | - | - | - | - | - | |
| MP/(SM + MP) | 0.39 [0.56] | 0.35 (0.40) | - | - | - | - | - | - | |
| Distal margin | |||||||||
| SM | - | - | - | - | - | –0.32 | - | [0.57] | |
| SM/MP | - | - | - | - | - | - | - | [0.56] | |
| SM/(SM + MP) | - | - | - | - | - | - | - | [0.64] | |
| MP | 0.31 | - | - | - | - | - | - | - | |
| MP/(SM + MP) | - | - | - | - | - | - | - | [–0.64] | |
CD, Crohn’s disease; PC, pixel count; calr, calretinin; calp, calprotectin. p < .05 by student’s t-test.
The numbers in round bracket indicate r in stricturing Crohn’s disease; The numbers in square bracket indicate r in inflammatory Crohn’s disease; all p < .05. p, proximal; PC, pixel count; calr, calretinin; p/d, proximal/distal; p/m, proximal/mid; m, mid; calp, calprotectin; SM, submucosal thickness; MP, muscularis propria thickness.

