 E-submission
Articles
- Page Path
- HOME > J Pathol Transl Med > Volume 55(1); 2021 > Article
-
Original Article
Automated immunohistochemical assessment ability to evaluate estrogen and progesterone receptor status compared with quantitative reverse transcription-polymerase chain reaction in breast carcinoma patients -
Taesung Jeon
 , Aeree Kim, Chungyeul Kim
 -
Journal of Pathology and Translational Medicine 2021;55(1):33-42.
DOI: https://doi.org/10.4132/jptm.2020.09.29
Published online: December 3, 2020
Department of Pathology, Korea University Guro Hospital, Korea University College of Medicine, Seoul, Korea
- Corresponding Author: Chungyeul Kim, MD, PhD, Department of Pathology, Korea University Guro Hospital, Korea University College of Medicine, 148 Gurodong-ro, Guro-gu, Seoul 08308, Korea, Tel: +82-2-2626-1472, Fax: +82-2-2626-1486, E-mail: idea1@hanmail.net
© 2021 The Korean Society of Pathologists/The Korean Society for Cytopathology
This is an Open Access article distributed under the terms of the Creative Commons Attribution Non-Commercial License (https://creativecommons.org/licenses/by-nc/4.0) which permits unrestricted non-commercial use, distribution, and reproduction in any medium, provided the original work is properly cited.
Abstract
-
Background
- This study aimed to investigate the capability of an automated immunohistochemical (IHC) evaluation of hormonal receptor status in breast cancer patients compared to a well-validated quantitative reverse transcription–polymerase chain reaction (RT-qPCR) method.
-
Methods
- This study included 93 invasive breast carcinoma cases that had both standard IHC assay and Oncotype Dx assay results. The same paraffin blocks on which Oncotype Dx assay had been performed were selected. Estrogen receptor (ER) and progesterone receptor (PR) receptor status were evaluated through IHC stains using SP1 monoclonal antibody for ER, and 1E2 monoclonal antibody for PR. All ER and PR immunostained slides were scanned, and invasive tumor areas were marked. Using the Quant-Center image analyzer provided by 3DHISTECH, IHC staining of hormone receptors was measured and converted to histochemical scores (H scores). Pearson correlation coefficients were calculated between Oncotype Dx hormone receptor scores and H scores, and between Oncotype Dx scores and Allred scores.
-
Results
- H scores measured by an automated imaging system showed high concordance with RT-qPCR scores. ER concordance was 98.9% (92/93), and PR concordance was 91.4% (85/93). The correlation magnitude between automated H scores and RT-qPCR scores was high and comparable to those of Allred scores (for ER, 0.51 vs. 0.37 [p = .121], for PR, 0.70 vs. 0.72 [p = .39]).
-
Conclusions
- Automated H scores showed a high concordance with quantitative mRNA expression levels measured by RT-qPCR.
- Patient selection and data collection
- Among those who had undergone surgery due to invasive breast carcinoma from 2014 to 2019 at Korea University Guro Hospital, 98-patient cases who had Oncotypes Dx test (Oncotype DX, Genomic Health, CA, USA) results were included. Five cases that were missing paraffin blocks were excluded. Eighty of the remaining 93 cases for which immunohistochemistry had been performed in the biopsy sample alone, were stained again in the paraffin block where Oncotype Dx was implemented.
- Information such as patient age at diagnosis, tumor size, tumor grade, Ki-67 labeling index, and mitotic count was collected from pathologic review. ER score, PR score, and RS score data were collected from the Oncotype Dx report. To improve comparability, we stained the same paraffin block where the Oncotype Dx assay had been implemented. We also analyzed the whole invasive tumor area of the same section by obtaining the Allred score and computer-aided H score.
- The clinical and pathologic characteristics of the final 93 cases are summarized in Table 1.
- Immunohistochemical stain
- The same paraffin blocks on which the Oncotype Dx assay was performed were selected. ER and PR receptor status were evaluated through immunohistochemical stains using the SP1 monoclonal antibody for ER, and the 1E2 monoclonal antibody for PR (Ventana Medical Systems, Tucson, AZ, USA). Formalin-fixed paraffin-embedded tissue samples were sliced with a microtome at 4 μm and placed on slides. The slides containing tissue sections were deparaffinized at 75°C, and cell conditioning was done with EDTA solution at 100°C for 4 minutes. Primary antibodies were applied for 20 minutes. A Ventana Benchmark Ultra instrument automatically stained the slides.
- Allred score
- The stained slides were reviewed and Allred scores for ER and PR were given by two skilled pathologists. Allred score was derived from the sum of PS (range, 0 to 5) and IS (range, 0 to 3).
- Slide scanning and calculating IHC scores by image analysis
- All ER and PR immunostained slides were scanned, and whole invasive tumor areas were marked by a pathologist. Using a QuantCenter image analyzer provided by 3DHISTECH (Budapest, Hungary), the results of the immunohistochemical staining of hormone receptors were measured and converted to H scores. The image analyzing system also provided automatically calculated Allred score results.
- We set “score intensity” cutoff values in the QuantCenter program at 200, 160, and 100 to define negative, weakly positive, moderately positive, and strong positive staining intensity that corresponded to the reactivity of staining (0, 1, 2, 3, respectively) (255–200, 0; 200–160, 1; 160–100, 2; 100–0, 3).
- Statistics
- Pearson correlation coefficients were calculated between Oncotype Dx hormone receptor scores and H scores, and between Oncotype Dx scores and Allred scores. The RS score was also compared with IHC scores. Further, the automatically calculated Allred scores were compared with RT-qPCR scores and RS scores as well. Fisher’s z transformation was used to compare each correlation coefficient. Statistical analyses were performed with Graph-Pad Prism ver. 8.3 software (GraphPad Software Inc., San Diego, CA, USA).
- The patients were subcategorized into a high score group (≥ 200), an intermediate score group (≥ 100 and < 200), and a low score group (< 100) to identify which subgroup was more correlated with the RT-qPCR score. The high score group (≥ 200) was subcategorized into < 250 and ≥ 250 groups.
MATERIALS AND METHODS
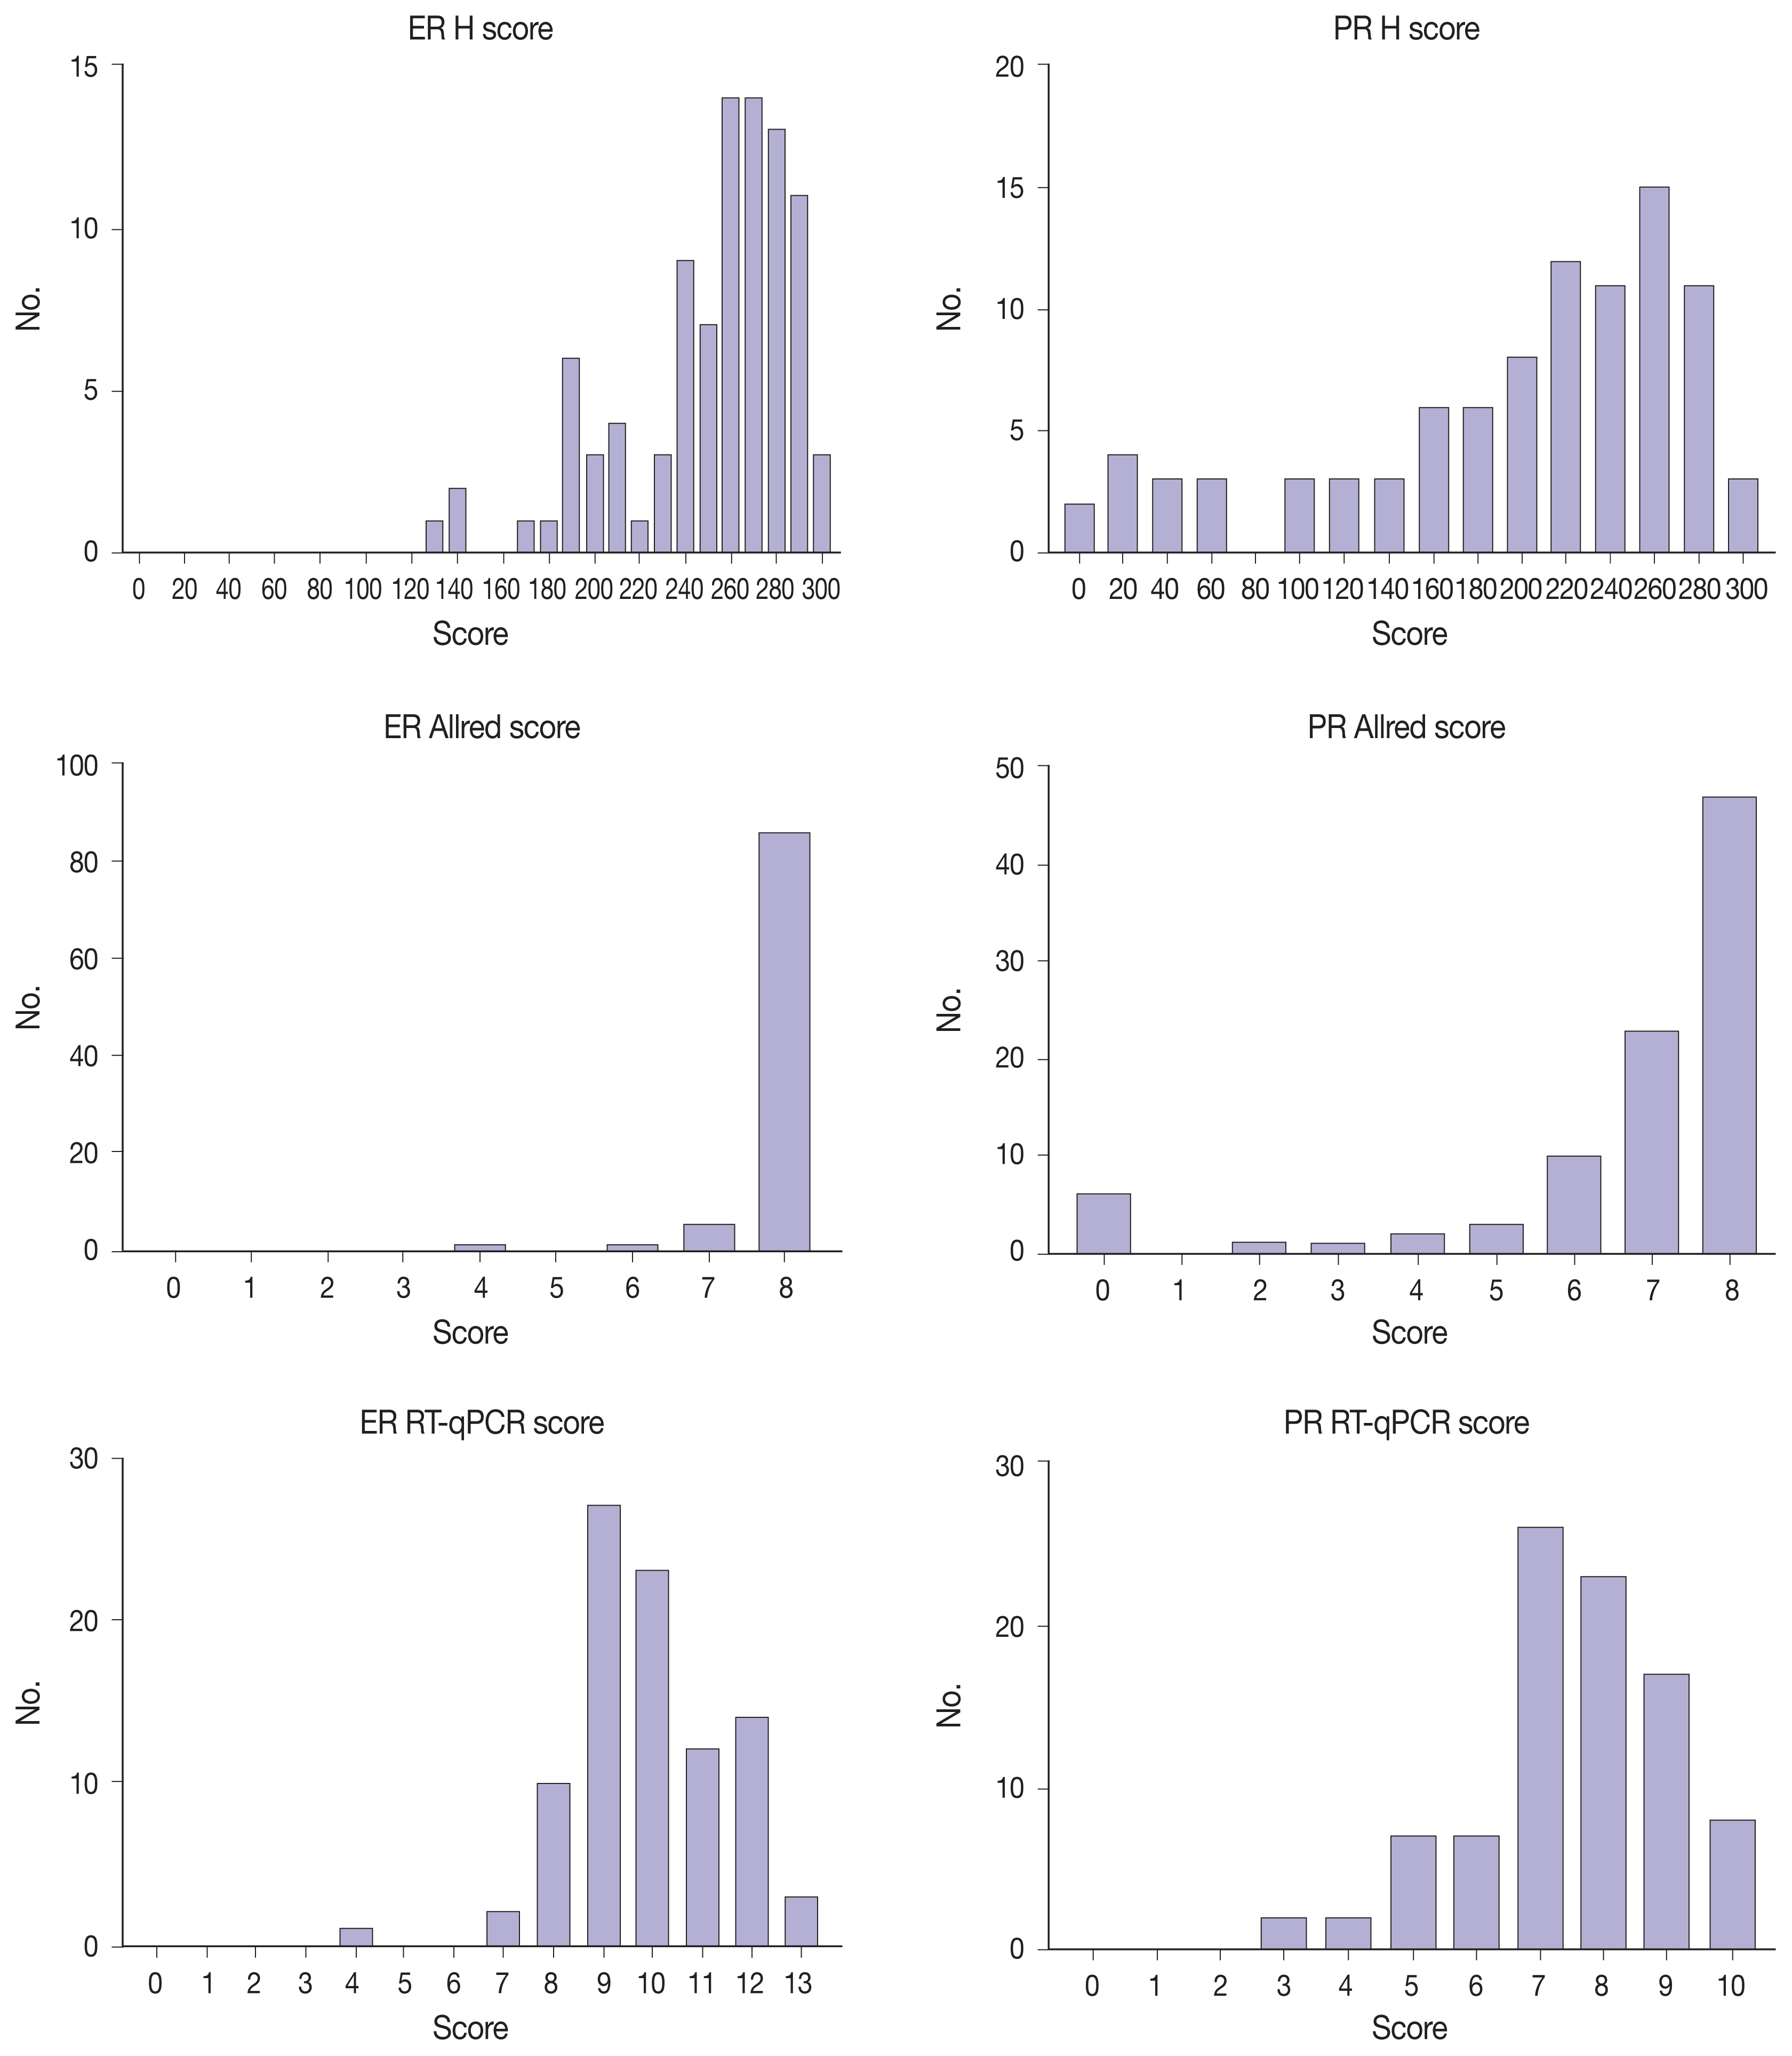
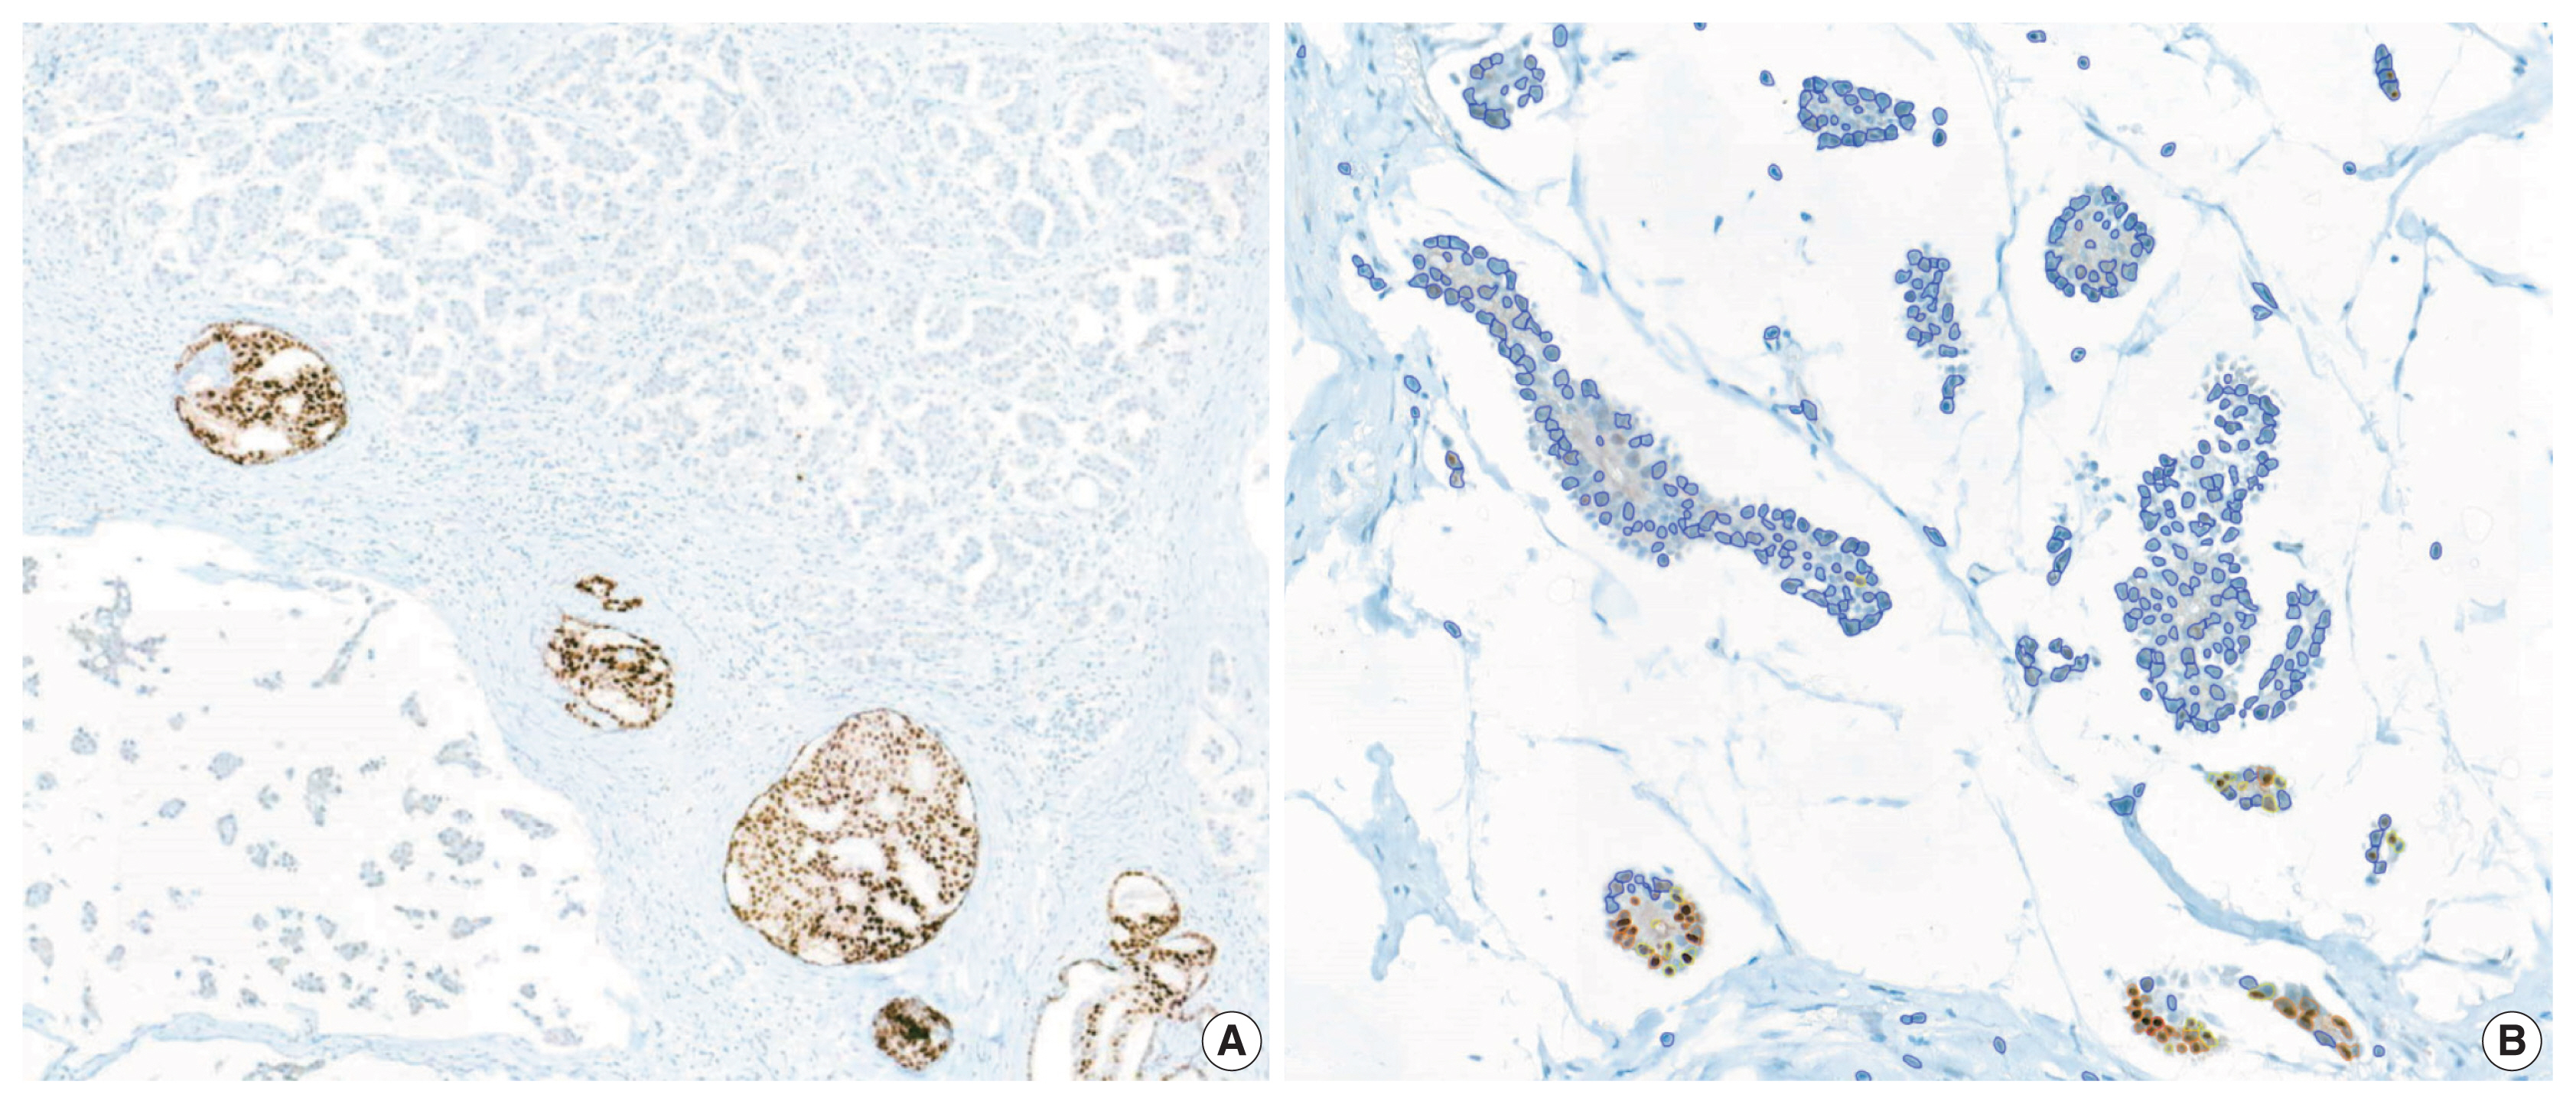
- Immunohistochemical and RT-qPCR score results for ER and PR are summarized in Table 2. ER and PR concordance rate between the H score and the RT-qPCR assay was 98.9% (92/93) and 91.4% (85/93), respectively. The correlation coefficient between ER H score and ER RT-qPCR score was 0.51, and that between ER Allred score and ER RT-qPCR score was 0.37 (Table 3). The correlation coefficient between PR H score and PR RT-qPCR score was 0.70, and that between the PR Allred score and PR RT-qPCR score was 0.72. The correlation coefficients were higher for PR compared to ER (0.70 vs. 0.51 [p = .021] and 0.72 vs. 0.37 [p < .01]). The correlation coefficients for automatically calculated Allred scores were similar to those for the manual Allred score (Table 3). Fig. 1 demonstrates the correlation status between scores. Among all three measuring methods, the RT-qPCR score was closest to the normal distribution (Fig. 2). In general, the PR IHC stain showed a more heterogeneous staining intensity compared to ER IHC (Fig. 3). When we examined the cases of Allred score 8, computer-aided H score results showed a significant portion of moderately positive (intensity 2) nuclei as well as strong positive nuclei (intensity 3) (Fig. 4).
- We inspected correlation magnitudes for each subgroup categorized by H score values. The intermediate H score group (range, 100 to 200) and low H score group (< 100) demonstrated the lowest correlation (Table 4). As the high H score group (range, 200 to 300) comprised a significant portion of all subjects, this group was further subcategorized into a 200–250 group and a 250–300 group. Compared to the 250–300 group, the 200–250 group showed a higher correlation with both ER and PR, although not statistically significant (0.59 vs. 0.52 for ER; 0.44 vs. 0.29 for PR) (p = .35 and p = .27) (Table 4).
- There were eight discordant cases for PR, while there was one discordant case for ER (Table 5). For ER, one case had IHC-positive and polymerase chain reaction (PCR)–negative results (ER score, 4.3; H score, 128.86). For PR, six cases had negative results across all measuring systems (mean PR score, 4.06; mean H, score 20.8). Five cases were only PCR-negative (mean PR score, 4.82; mean H score, 144.95). Two cases were only H score–negative (mean PR score, 6.25; mean H score, 38.49). One case was IHC-negative and PCR-positive (PR score, 5.8; H score, 12.24). Our results were consistent with previous studies in that more IHC-positive and RT-qPCR–negative cases were observed compared to the opposite [5,7,9,10]. In concordance with earlier studies, no PR-positive, ER-negative case was found.
- We reviewed the discordant cases between IHC scores and RT-qPCR scores. Regarding the IHC-positive and RT-qPCR–negative cases (one for ER and five for PR), the immunostained slides showed positivity for both the Allred score and H score (Table 5). One PR IHC-negative, RT-qPCR–positive case demonstrated a strong PR-positive ductal carcinoma in situ component within the area of hormone-negative invasive carcinoma (Fig. 5A). Under secondary review, the automatically recognized staining intensities and subsequently calculated H scores seemed accurate (Fig. 5B).
RESULTS
- RT-qPCR methods enable quantitative and consistent measurement of clinically significant gene expression levels. In contrast, currently used manual immunohistochemical assessment systems may demonstrate a lack of reproducibility. Scoring systems that use image analyzers are expected to overcome this weakness. In this study, we found high correlations between automatically calculated immunohistochemical scores and RT-qPCR hormone expression levels.
- Immunohistochemical evaluation of hormonal receptor expression status captured the tendency to oversaturation—skewed to the high expression side—, especially in the ER and a high score groups. Among all three measuring methods, the RT-qPCR score was closest to the normal distribution. Despite that the number of discordant cases for PR was higher, the correlation was higher for PR than for ER. This is because the distribution was more right-shifted in ER, resulting in a non-linear correlation with the RT-qPCR score. As the IHC score was somewhat shifted to the right, it would lose linearity as it approached a high score.
- Measurements obtained with the Allred scoring system were even more right-shifted than H scores for both ER and PR [10]. More than 90% of cases had an ER Allred score of 8, and more than 50% of cases had a PR Allred score of 8. No single case had an ER Allred score less than 4. Compared to the Allred score, the H score system demonstrated a linear quantitative measurement for receptor status.
- The correlation magnitude between H scores and RT-qPCR scores was not significantly different than that between Allred scores and RT-qPCR scores. ER H score showed a higher correlation coefficient compared to the Allred score in this study 0.51 vs. 0.37 (p = .121). In contrast, the PR Allred score showed a higher correlation coefficient than the H score 0.70 vs. 0.72 (p = .39). Additionally, we compared the correlation magnitude when the image analysis system calculated both the H scores and Allred scores. After excluding confounding factors, the results showed a similar tendency to the manual Allred score. Compared to the H score, the Allred score was more correlated with the RS score in both ER (0.42 vs. 0.28) (p = .14) and PR (0.50 vs. 0.43) (p = .27). When we looked into the cases of Allred score 8, computer-aided H score results showed a significant portion of moderately positive (intensity 2) nuclei as well as strong positive nuclei (intensity 3). Sometimes, moderately positive nuclei were observed more often than strong positive nuclei. The computer-recognized variation in staining intensity may have resulted in a lower correlation than the Allred score due to its complexity [19].
- We reviewed the discordant cases between IHC scores and RT-qPCR scores. Regarding the IHC-positive and RT-qPCR–negative cases (one for ER and five for PR), the immunostained slides showed positivity for both the Allred score and H score. From this result, we speculated that the RT-qPCR method may have lower sensitivity compared to IHC methods in certain situations. One PR IHC-negative, RT-qPCR–positive case demonstrated a strong PR-positive ductal carcinoma in situ component within the area of hormone-negative invasive carcinoma. This intraductal component may have caused false-positive RT-qPCR results. While immunohistochemical methods detect and count only invasive tumor areas, the RT-qPCR method may incorporate intraductal components and non-tumor areas as well.
- Two cases had a negative PR H score and positive Allred score and RT-qPCR score. They both had positive Allred scores under secondary review. The automatically recognized staining intensities and subsequently calculated H scores seemed accurate. These two cases had a mean H score of 38.49. We set the “score intensity” cutoff points in the image analyzing system to define nuclear staining intensities, and the cutoff points could be finely adjusted to obtain more precise results. The H score cutoff value itself (which was set at 50 in this study) can be adjusted to reduce false-negative H score results.
- In our study, PR had more intermediate H score cases than ER (13/93 [13.97%] vs. 25/93 [26.88%]). As mentioned above, the intermediate group showed the lowest correlation. The intermediate group may have had more intratumoral heterogeneity and stromal influence. Intratumoral heterogeneity of PR and contaminated non-tumor areas could have caused lower RT-qPCR sensitivity compared to IHC.
- Although only weak staining of more than 1% of tumor cells is a well-known cutoff value for predicting anti-hormone therapy response, the value is quite left-shifted on a percentile scale. Allred score has been assessed visually, and an inherent problem could occur because the 1% cutoff value can be arbitrary by visual assessment [20]. The therapeutic benefit of anti-hormone therapy in low ER and PR receptor groups (positivity ranges from 1% to 10%) has not yet been established. True low ER and PR groups are rare, according to some the previous reports [13,21]. More recently, some portions of this low hormonal receptor group had characteristics more like basal-like and triple-negative groups than hormone receptor-positive groups [19,22]. No low ER tumor was found in our study, while one low PR tumor case was present. The low PR (Allred score 3 [1 + 2]) case had a positive H score value (201.22), negative RT-qPCR score (4.2), and positive ER result (Allred score, 8; H score, 278.64). More careful assessment is required for these low ER and PR groups. Various methods including the RT-qPCR method and computer-aided quantification will be helpful.
- In conclusion, the correlation magnitude between automated H scores and RT-qPCR scores was high and comparable to those of Allred scores. Automated H scores may become more predictive when further large-scale studies with refined methods are conducted.
- The antibodies used in this study (SP1 for ER and 1E2 for PR) are well known for being more sensitive than other ER and PR antibodies, thus can reduce false-negative results [23,24]. These widely used antibodies have shown a good correlation with patient outcomes [23,24]. With the use of these antibodies, the distribution of IHC scores could be more skewed to high scores.
- The Oncotype Dx test targets ER-positive, node-negative breast cancer patients only. Thus, this study was conducted only with ER-positive and high score patients, which could have led to an incomplete interpretation of the results. Further study designs that include all hormonal receptor statuses, especially low ER, PR groups (1%–10% positive cells), would be informative.
DISCUSSION
Acknowledgments
Acknowledgments
Ethics Statement
The Institutional Review Board (IRB) of Korea University Guro Hospital (IRB No. 2019GR0410) approved this study. The requirement for informed consent was waived by the IRB. Investigations were conducted as per the rules of the Declaration of Helsinki of 1975, revised in 2013.
Author Contributions
Conceptualization: CK. Data curation: TJ. Formal analysis: TJ. Funding acquisition: CK, AK. Investigation: TJ. Methodology: TJ, CK. Project administration: CK. Resources: TJ, CK, AK. Supervision: CK, AK. Validation: TJ, CK. Visualization: TJ. Writing—original draft: TJ. Writing—review & editing: TJ, CK, AK. Approval of final manuscript: all authors.
Conflicts of Interest
AK, a contributing editor of the Journal of Pathology and Translational Medicine, was not involved in the editorial evaluation or decision to publish this article. All remaining authors have declared no conflicts of interest.
Funding Statement
No funding to declare.


| Correlation coefficient (R) | H score | Allred score | Automated allred score |
|---|---|---|---|
| ER | |||
| RT-qPCR score | 0.51 | 0.37 | 0.35 |
| RS | 0.28 | 0.42 | 0.30 |
| PR | |||
| RT-qPCR score | 0.70 | 0.72 | 0.72 |
| RS | 0.43 | 0.50 | 0.50 |
| Subgroup | ER | PR | ||
|---|---|---|---|---|
|
|
|
|||
| No. | R | No. | R | |
| ≥ 200 | 80 | 0.60 | 55 | 0.47 |
| 200–250 | 22 | 0.59 | 27 | 0.44 |
| 250–300 | 58 | 0.52 | 30 | 0.29 |
| 100–200 | 13 | 0.23 | 25 | 0.22 |
| < 100 | 0 | N/A | 13 | 0.69 |
ER RT-qPCR score was considered positive when ≥ 6.5, PR RT-qPCR score ≥ 5.5; H score was considered positive when ≥ 50, and negative when < 50.
RT-qPCR, quantitative reverse transcription-polymerase chain reaction; H score, histochemical score; ER, estrogen receptor; IHC, immunohisto-chemical; PCR, polymerase chain reaction; PR, progesterone receptor.
- 1. Umemura S, Kurosumi M, Moriya T, et al. Immunohistochemical evaluation for hormone receptors in breast cancer: a practically useful evaluation system and handling protocol. Breast Cancer 2006; 13: 232.ArticlePubMed
- 2. Hammond ME, Hayes DF, Dowsett M, et al. American Society of Clinical Oncology/College of American Pathologists guideline recommendations for immunohistochemical testing of estrogen and progesterone receptors in breast cancer (unabridged version). Arch Pathol Lab Med 2010; 134: e48-72. PubMed
- 3. Paik S, Shak S, Tang G, et al. A multigene assay to predict recurrence of tamoxifen-treated, node-negative breast cancer. N Engl J Med 2004; 351: 2817-26. ArticlePubMed
- 4. Xin L, Liu YH, Martin TA, Jiang WG. The era of multigene panels comes? The clinical utility of Oncotype DX and MammaPrint. World J Oncol 2017; 8: 34-40. ArticlePubMedPMC
- 5. O’Connor SM, Beriwal S, Dabbs DJ, Bhargava R. Concordance between semiquantitative immunohistochemical assay and oncotype DX RT-PCR assay for estrogen and progesterone receptors. Appl Immunohistochem Mol Morphol 2010; 18: 268-72. ArticlePubMed
- 6. Badve SS, Baehner FL, Gray RP, et al. Estrogen- and progesterone-receptor status in ECOG 2197: comparison of immunohistochemistry by local and central laboratories and quantitative reverse transcription polymerase chain reaction by central laboratory. J Clin Oncol 2008; 26: 2473-81. ArticlePubMed
- 7. Kraus JA, Dabbs DJ, Beriwal S, Bhargava R. Semi-quantitative immunohistochemical assay versus oncotype DX((R)) qRT-PCR assay for estrogen and progesterone receptors: an independent quality assurance study. Mod Pathol 2012; 25: 869-76. PubMedPDF
- 8. Bradshaw SH, Pidutti D, Gravel DH, Song X, Marginean EC, Robertson SJ. Predicting OncoDx recurrence scores with immunohistochemical markers. Appl Immunohistochem Mol Morphol 2013; 21: 490-6. ArticlePubMed
- 9. Park MM, Ebel JJ, Zhao W, Zynger DL. ER and PR immunohistochemistry and HER2 FISH versus oncotype DX: implications for breast cancer treatment. Breast J 2014; 20: 37-45. ArticlePubMed
- 10. Khoury T, Yan L, Liu S, Bshara W. Oncotype DX RT-qPCR assay for ER and PR correlation with IHC: a study of 3 different clones. Appl Immunohistochem Mol Morphol 2015; 23: 178-87. PubMed
- 11. Hanna MG, Bleiweiss IJ, Nayak A, Jaffer S. Correlation of Oncotype DX recurrence score with histomorphology and immunohistochemistry in over 500 patients. Int J Breast Cancer 2017; 2017: 1257078. ArticlePDF
- 12. Collins LC, Botero ML, Schnitt SJ. Bimodal frequency distribution of estrogen receptor immunohistochemical staining results in breast cancer: an analysis of 825 cases. Am J Clin Pathol 2005; 123: 16-20. ArticlePubMed
- 13. Qureshi A, Pervez S. Allred scoring for ER reporting and it’s impact in clearly distinguishing ER negative from ER positive breast cancers. J Pak Med Assoc 2010; 60: 350-3. PubMed
- 14. Allred DC, Mohsin SK. ER expression is not bimodal in breast cancer. Am J Clin Pathol 2005; 124: 474-5. PubMed
- 15. Shousha S. Oestrogen receptor status of breast carcinoma: Allred/H score conversion table. Histopathology 2008; 53: 346-7. ArticlePubMed
- 16. Madabhushi A, Lee G. Image analysis and machine learning in digital pathology: challenges and opportunities. Med Image Anal 2016; 33: 170-5. ArticlePubMedPMC
- 17. Veta M, Pluim JP, van Diest PJ, Viergever MA. Breast cancer histopathology image analysis: a review. IEEE Trans Biomed Eng 2014; 61: 1400-11. ArticlePubMed
- 18. Mohammed ZM, Edwards J, Orange C, et al. Breast cancer outcomes by steroid hormone receptor status assessed visually and by computer image analysis. Histopathology 2012; 61: 283-92. ArticlePubMed
- 19. Reisenbichler ES, Lester SC, Richardson AL, Dillon DA, Ly A, Brock JE. Interobserver concordance in implementing the 2010 ASCO/CAP recommendations for reporting ER in breast carcinomas: a demonstration of the difficulties of consistently reporting low levels of ER expression by manual quantification. Am J Clin Pathol 2013; 140: 487-94. PubMedPDF
- 20. Nassar A, Cohen C, Agersborg SS, et al. A new immunohistochemical ER/PR image analysis system: a multisite performance study. Appl Immunohistochem Mol Morphol 2011; 19: 195-202. PubMed
- 21. Nadji M, Gomez-Fernandez C, Ganjei-Azar P, Morales AR. Immunohistochemistry of estrogen and progesterone receptors reconsidered: experience with 5,993 breast cancers. Am J Clin Pathol 2005; 123: 21-7. ArticlePubMedPDF
- 22. Iwamoto T, Booser D, Valero V, et al. Estrogen receptor (ER) mRNA and ER-related gene expression in breast cancers that are 1% to 10% ER-positive by immunohistochemistry. J Clin Oncol 2012; 30: 729-34. ArticlePubMed
- 23. Troxell ML, Long T, Hornick JL, Ambaye AB, Jensen KC. Comparison of estrogen and progesterone receptor antibody reagents using proficiency testing data. Arch Pathol Lab Med 2017; 141: 1402-12. ArticlePubMedPDF
- 24. Zhang H, Han M, Varma KR, Clark BZ, Bhargava R, Dabbs DJ. High fidelity of breast biomarker metrics: a 10-year experience in a single, large academic institution. Appl Immunohistochem Mol Morphol 2018; 26: 697-700. ArticlePubMed
REFERENCES
Figure & Data
References
Citations
- Intracellular sclerostin promotes tumor progression and metastasis as a potential therapeutic target in triple-negative breast cancer
Meiheng Sun, Hang Luo, Shuangying Qiao, Zefeng Chen, Hewen Jiang, Xin Yang, Shijian Ding, Yuan Tian, Yingchao Wu, Peng Wu, Yihao Zhang, Xiaohui Tao, Yuanyuan Yu, Luyao Wang, Jianhui Tian, Wei Kang, Daqing Ma, Yixin He, Aiping Lu, Feng-Lai Yuan, Yuan Ma, F
Cell Reports Medicine.2026; 7(5): 102763. CrossRef - Comprehensive Profiling Reveals Sialyl‐Tn Upregulation and Prognostic Value in Prostate Cancer
Kirsty Hodgson, Libby Blencoe, Erin Smith, Aswini Sasikumar, Ziqian Peng, Margarita Orozco‐Moreno, Richard Beatson, Paula A. Videira, Jennifer Munkley
Pathology International.2026;[Epub] CrossRef - Keratin 1 and keratin 18 as immunohistochemical markers for distinguishing pulmonary metastases of oral squamous cell carcinoma from primary lung squamous cell carcinoma
Yoshiko Watanabe, Hisami Kato, Rei Ishikawa, Kimio Yoshimura, Hidetaka Yamada, Ryosuke Miyazaki, Sayuri Takeuchi, S M Jahurul Haque, Katsuhiro Yoshimura, Yasuhiro Sakai, Miki Sugita, Yusuke Inoue, Yusuke Takanashi, Keigo Sekihara, Kazuhito Funai, Kazuma M
Scientific Reports.2026;[Epub] CrossRef - Prediction of response to neoadjuvant chemotherapy in patients with muscle-invasive urothelial bladder cancer: role of immune-related gene expression
Hadeer Mahmoud, Abeer M. Abd El-Aziz, Osama Ezzat, Hany Ibrahim Kenawy, Ahmed A. Shokeir
Cancer Immunology, Immunotherapy.2025;[Epub] CrossRef - PUM1 in Breast Cancer: Tumor Expression and Prognostic and Predictive Significance
Abrar I. Aljohani
Medicina.2025; 61(10): 1810. CrossRef - Vision Transformers for Breast Cancer Human Epidermal Growth Factor Receptor 2 Expression Staging without Immunohistochemical Staining
Gelan Ayana, Eonjin Lee, Se-woon Choe
The American Journal of Pathology.2024; 194(3): 402. CrossRef - Extrahepatic Bile Duct Organoids as a Model to Study Ischemia/Reperfusion Injury During Liver Transplantation
P. Kreiner, E. Eggenhofer, L. Schneider, C. Rejas, M. Goetz, N. Bogovic, S. M. Brunner, K. Evert, H. J. Schlitt, E. K. Geissler, H. Junger
Transplant International.2024;[Epub] CrossRef - Prognostic Significance of DSCC1, a Biomarker Associated with Aggressive Features of Breast Cancer
Abrar I. Aljohani
Medicina.2024; 60(12): 1929. CrossRef - Marker assessments inER‐positive breast cancers: old markers, new applications?
Joshua J X Li, Gary M Tse
Histopathology.2023; 82(2): 218. CrossRef - The Story of the Magee Equations: The Ultimate in Applied Immunohistochemistry
Rohit Bhargava, David J. Dabbs
Applied Immunohistochemistry & Molecular Morphology.2023; 31(7): 490. CrossRef - Dose-Dependent Relationship between Protection of Thioacetamide-Induced Acute Liver Injury and Hyperammonemia and Concentration of Lactobacillus salivarius Li01 in Mice
Pengcheng Lou, Yangfan Shen, Aoxiang Zhuge, Longxian Lv, Xueling Zhu, Yin Yuan, Liya Yang, Kaicen Wang, Bo Li, Lanjuan Li, Joanna B. Goldberg
Microbiology Spectrum.2021;[Epub] CrossRef
 PubReader
 ePub Link
-
 Cite this Article
- Cite this Article
-
- Close
- Download Citation
- Close
- Figure
-
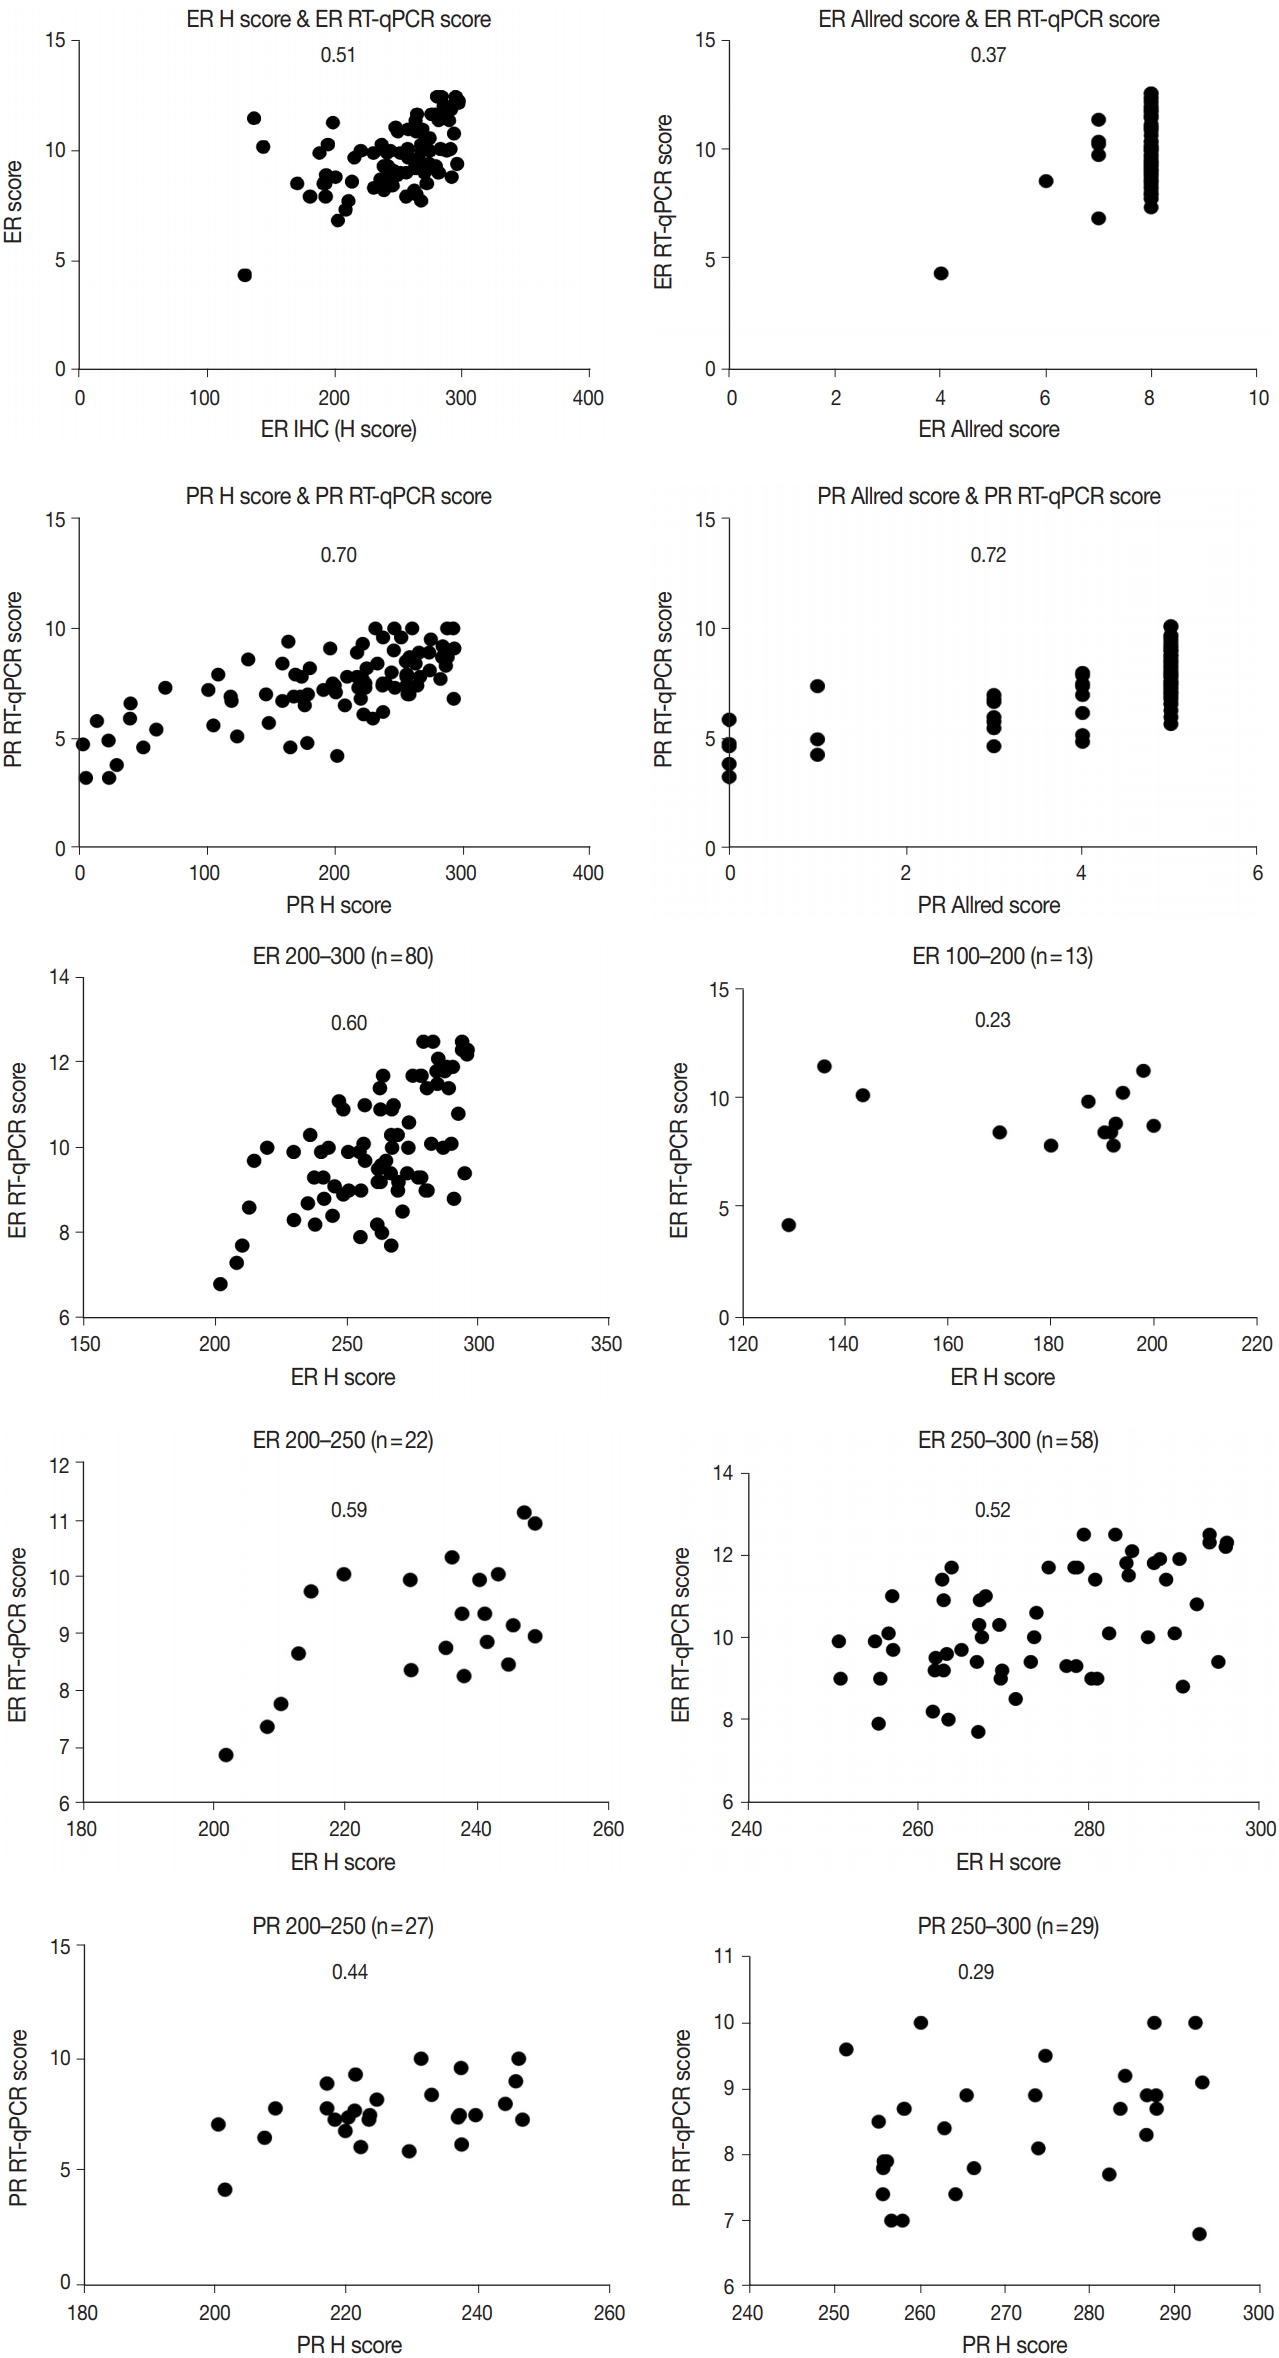

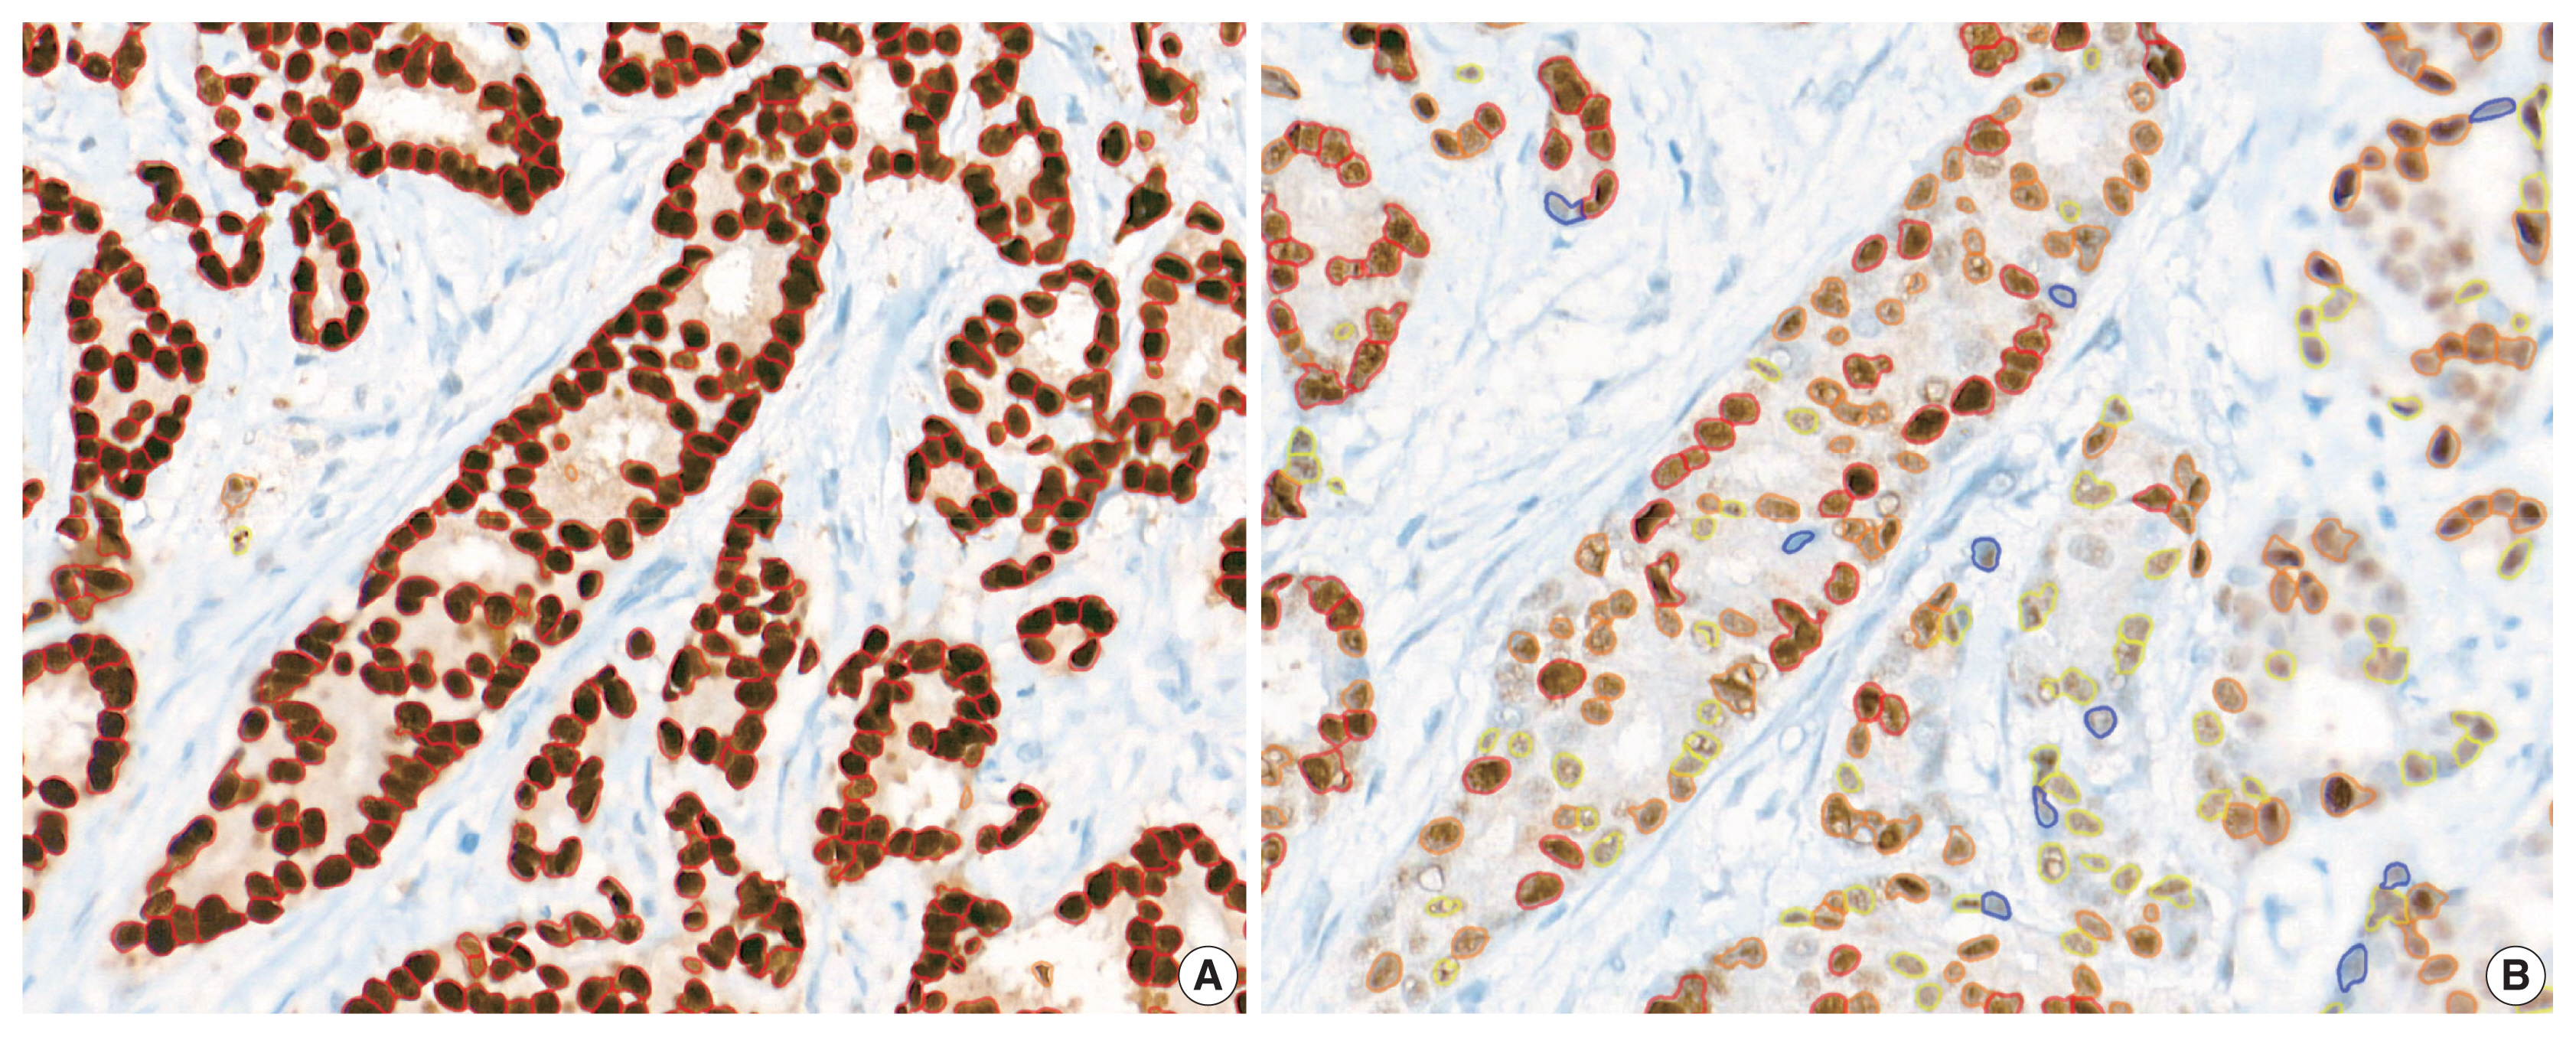
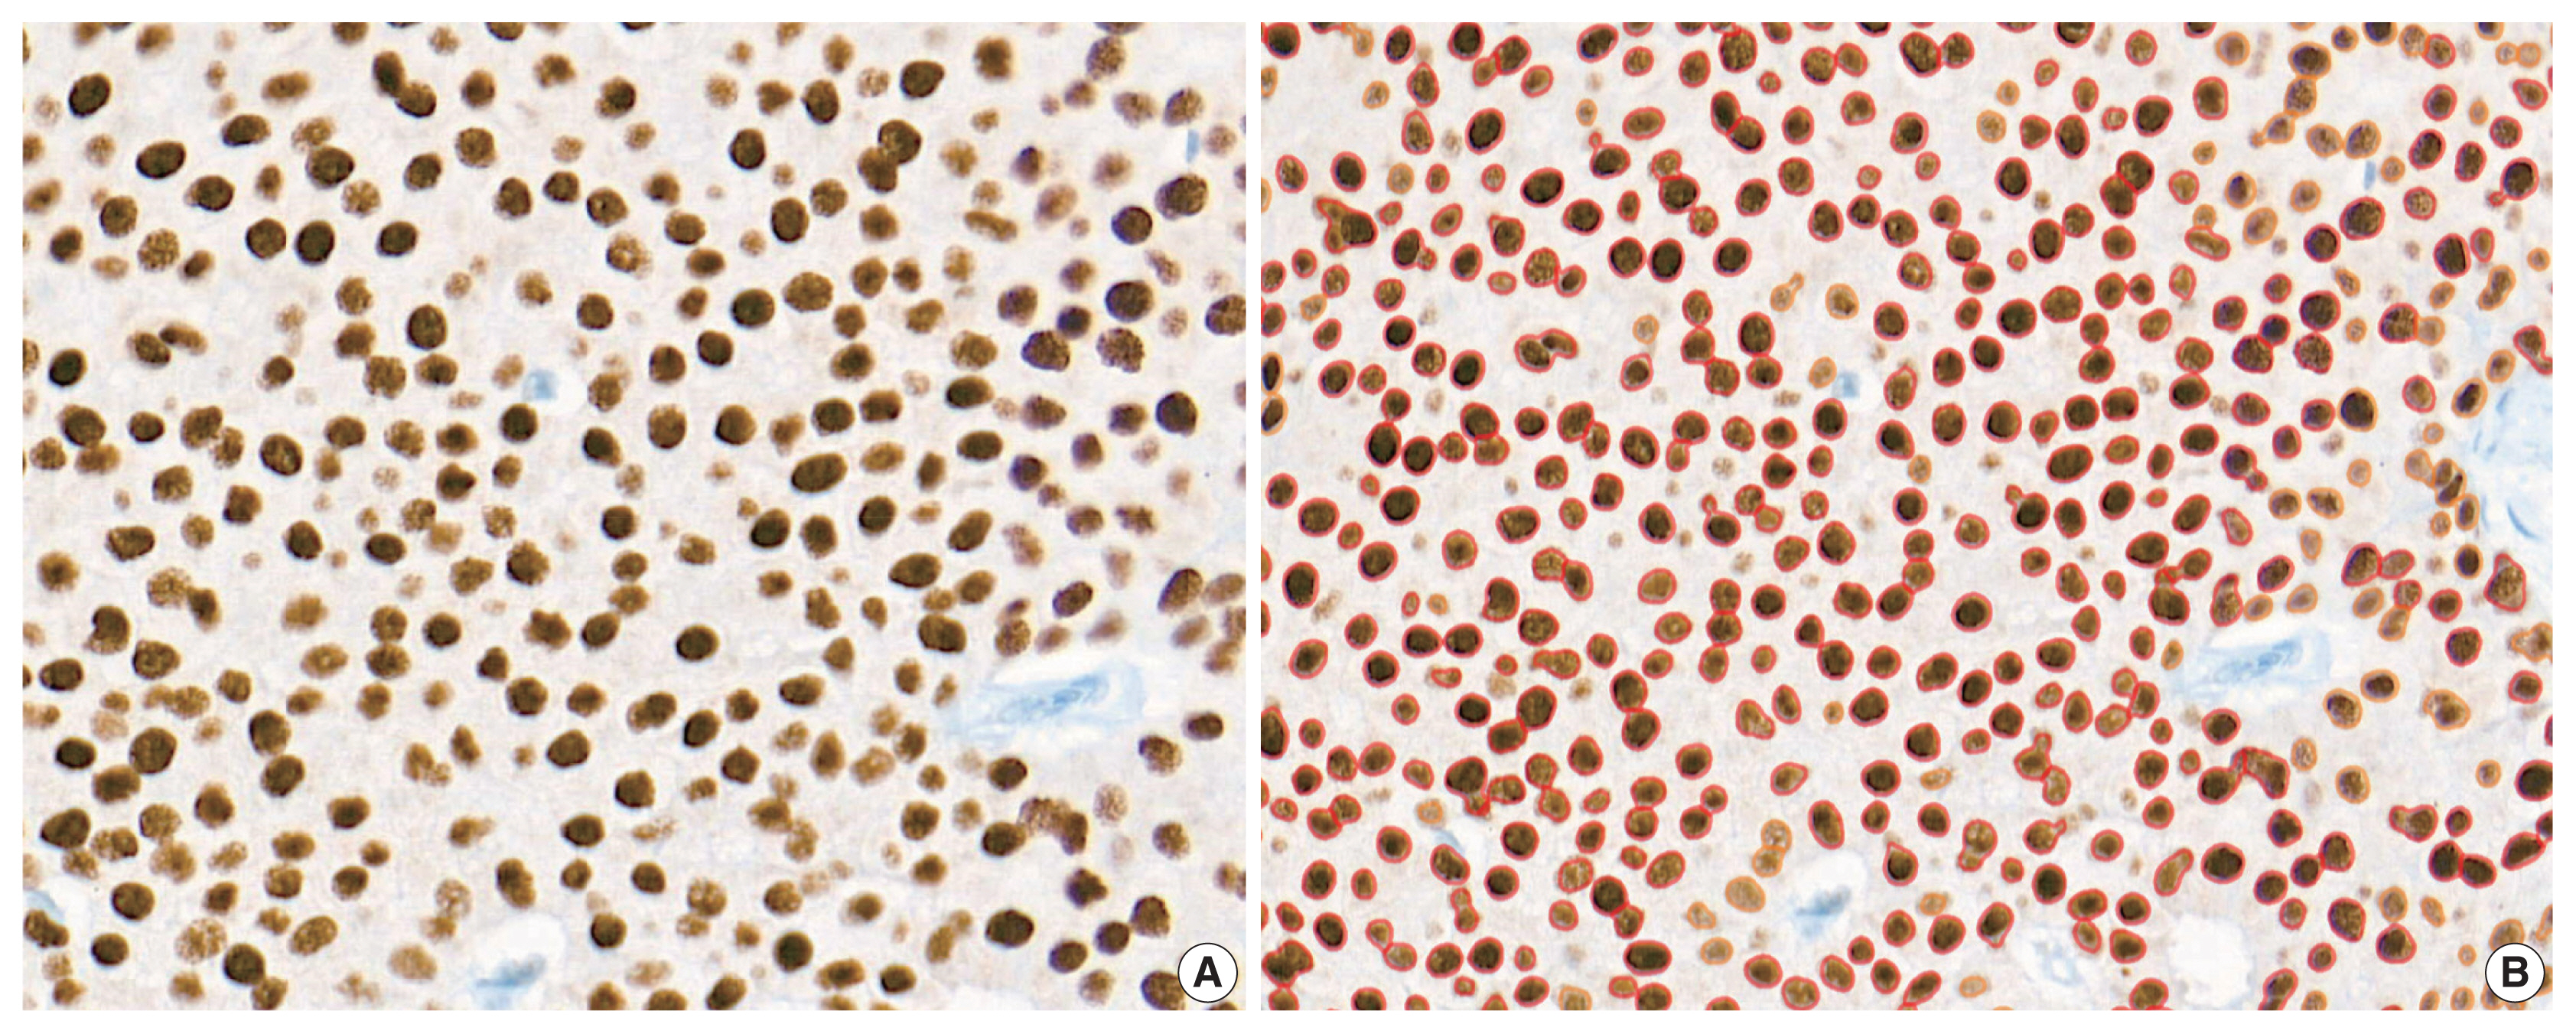


Fig. 1
Fig. 2
Fig. 3
Fig. 4
Fig. 5
| Characteristic | Value |
|---|---|
| Age at diagnosis (yr) | 53.47 (30–79) |
| Tumor size (cm) | 1.29 (0.5–2.9) |
| Ki-67 labeling index (%) | 12.93 (0.5–74.7) |
| Histologic type | |
| Invasive NST | 81 (87.1) |
| Invasive lobular | 8 (8.6) |
| Pleomorphic lobular | 2 (2.2) |
| Mucinous | 2 (2.2) |
| Histologic grade | |
| 1 | 55 (59.1) |
| 2 | 37 (39.8) |
| 3 | 1 (1.1) |
| Tubule formation | |
| 1 | 19 (20.4) |
| 2 | 37 (39.8) |
| 3 | 37 (39.8) |
| Nuclear grade | |
| 1 | 17 (18.3) |
| 2 | 71 (76.3) |
| 3 | 5 (5.4) |
| Mitosis | |
| 1 | 82 (88.2) |
| 2 | 10 (10.8) |
| 3 | 1 (1.1) |
| Mean (range) | |
|---|---|
| ER H score | 250.6 (128.86–296.23) |
| PR H score | 196.51 (1.37–293.17) |
| ER Allred score | 7.88 (4–8) |
| PR Allred score | 6.73 (0–8) |
| ER RT-qPCR score | 9.86 (4.3–12.5) |
| PR RT-qPCR score | 7.44 (3.2–10) |
| RS score | 15.16 (0–68) |
| Correlation coefficient (R) | H score | Allred score | Automated allred score |
|---|---|---|---|
| ER | |||
| RT-qPCR score | 0.51 | 0.37 | 0.35 |
| RS | 0.28 | 0.42 | 0.30 |
| PR | |||
| RT-qPCR score | 0.70 | 0.72 | 0.72 |
| RS | 0.43 | 0.50 | 0.50 |
| Subgroup | ER | PR | ||
|---|---|---|---|---|
|
|
| |||
| No. | R | No. | R | |
| ≥ 200 | 80 | 0.60 | 55 | 0.47 |
| 200–250 | 22 | 0.59 | 27 | 0.44 |
| 250–300 | 58 | 0.52 | 30 | 0.29 |
| 100–200 | 13 | 0.23 | 25 | 0.22 |
| < 100 | 0 | N/A | 13 | 0.69 |
| Discordant results | No. of cases | Results | Mean RT-qPCR score | Mean H score |
|---|---|---|---|---|
| ER | 1 | IHC (+), PCR (−) | 4.3 | 128.86 |
| PR | 5 | Allred (+), H (+), PCR (−) | 4.82 | 144.95 |
| 2 | Allred (+), H (−), PCR (+) | 6.25 | 38.49 | |
| 1 | Allred (−), H (−), PCR (+) | 5.8 | 12.24 |
Values are presented as mean (range) or number (%). NST, no special type.
ER, estrogen receptor; H, histochemical; PR, progesterone receptor; RT-qPCR, quantitative reverse transcription–polymerase chain reaction; RS, recurrence score.
IHC, immunohistochemical; RT-qPCR, quantitative reverse transcription-polymerase chain reaction; H, histochemical; ER, estrogen receptor; RS, recurrence score; PR, progesterone receptor.
ER, estrogen receptor; PR, progesterone receptor; N/A, not available.
ER RT-qPCR score was considered positive when ≥ 6.5, PR RT-qPCR score ≥ 5.5; H score was considered positive when ≥ 50, and negative when < 50. RT-qPCR, quantitative reverse transcription-polymerase chain reaction; H score, histochemical score; ER, estrogen receptor; IHC, immunohisto-chemical; PCR, polymerase chain reaction; PR, progesterone receptor.

