 E-submission
Articles
- Page Path
- HOME > J Pathol Transl Med > Volume 52(6); 2018 > Article
-
Original Article
Multiplicity of Advanced T Category–Tumors Is a Risk Factor for Survival in Patients with Colorectal Carcinoma -
Hye Eun Park1
 , Seungyeon Yoo1, Jeong Mo Bae1, Seorin Jeong2, Nam-Yun Cho2, Gyeong Hoon Kang1,2
 -
Journal of Pathology and Translational Medicine 2018;52(6):386-395.
DOI: https://doi.org/10.4132/jptm.2018.10.02
Published online: November 14, 2018
1Department of Pathology, Seoul National University Hospital, Seoul National University College of Medicine, Seoul, Korea
2Laboratory of Epigenetics, Cancer Research Institute, Seoul National University College of Medicine, Seoul, Korea
- Corresponding Author Gyeong Hoon Kang, MD, PhD Department of Pathology, Seoul National University College of Medicine, 103 Daehak-ro, Jongno-gu, Seoul 03080, Korea Tel: +82-2-740-8263 Fax: +82-2-765-5600 E-mail: ghkang@snu.ac.kr
© 2018 The Korean Society of Pathologists/The Korean Society for Cytopathology
This is an Open Access article distributed under the terms of the Creative Commons Attribution Non-Commercial License (http://creativecommons.org/licenses/by-nc/4.0) which permits unrestricted non-commercial use, distribution, and reproduction in any medium, provided the original work is properly cited.
Abstract
-
Background
- Previous studies on synchronous colorectal carcinoma (SCRC) have reported inconsistent results about its clinicopathologic and molecular features and prognostic significance.
-
Methods
- Forty-six patients with multiple advanced tumors (T2 or higher category) who did not receive neoadjuvant chemotherapy and/or radiotherapy and who are not associated with familial adenomatous polyposis were selected and 99 tumors from them were subjected to clinicopathologic and molecular analysis. Ninety-two cases of solitary colorectal carcinoma (CRC) were selected as a control considering the distributions of types of surgeries performed on patients with SCRC and T categories of individual tumors from SCRC.
-
Results
- SCRC with multiple advanced tumors was significantly associated with more frequent nodal metastasis (p = .003) and distant metastasis (p = .001) than solitary CRC. KRAS mutation, microsatellite instability, and CpG island methylator phenotype statuses were not different between SCRC and solitary CRC groups. In univariate survival analysis, overall and recurrence-free survival were significantly lower in patients with SCRC than in patients with solitary CRC, even after adjusting for the extensiveness of surgical procedure, adjuvant chemotherapy, or staging. Multivariate Cox regression analysis revealed that tumor multiplicity was an independent prognostic factor for overall survival (hazard ratio, 4.618; 95% confidence interval, 2.126 to 10.030; p < .001), but not for recurrence-free survival (p = .151).
-
Conclusions
- Findings suggested that multiplicity of advanced T category–tumors might be associated with an increased risk of nodal metastasis and a risk factor for poor survival, which raises a concern about the guideline of American Joint Committee on Cancer’s tumor-node-metastasis staging that T staging of an index tumor determines T staging of SCRC.
- Tissue collection
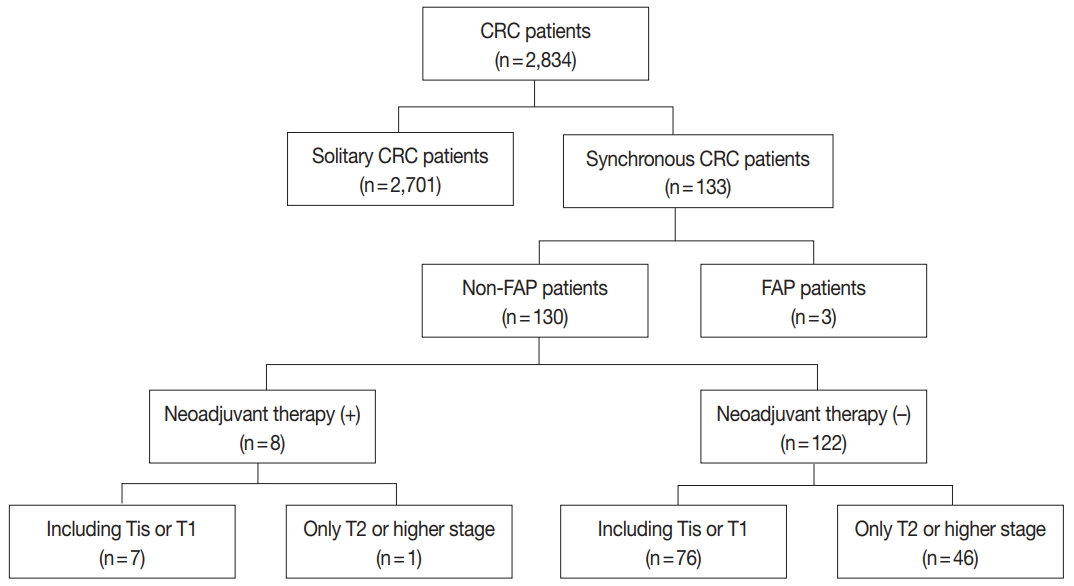
- Two thousand eight hundred thirty-four CRC patients who underwent surgery at Seoul National University Hospital, Seoul, Korea, from January 2007 to December 2010 were reviewed. Among them, 2,701 were solitary CRC patients and 133 were diagnosed as SCRC. From the 133 patients, we excluded patients with familial adenomatous polyposis (FAP) (n = 3) and those who received neoadjuvant chemo- and/or radiotherapy (n = 8). In order to focus on patients with advanced stages, we further excluded patients with intramucosal carcinoma (n = 37) and T1-category lesions (n = 39). As a result, 46 cases with multiple advanced tumors (T2 or higher category) were selected for this study (Fig. 1). Of the 46 patients, 16 underwent extensive surgery including total colectomy and subtotal colectomy, and 30 had a relatively simple procedure (8 cases of anterior resection, 14 cases of ultra-low or low anterior resection, 4 cases of right or left hemicolectomy, and 4 cases of extended right hemicolectomy). Considering the distributions of pT categories of individual tumors and types of surgeries performed on patients with SCRC, we selected 92 cases of solitary CRC with similar distributions of pT categories (Table 1) and types of surgeries (35 cases of anterior resection, 31 cases of low anterior resection, 12 cases of right or left hemicolectomy, and 14 cases of extended right hemicolectomy). However, we could not retrieve patients with solitary CRC who received extensive surgery. This study was approved by the Institutional Review Board (IRB No. 1101-007-345). IRB exempted the informed consent due to the retrospective nature of the study.
- Clinicopathologic data
- Clinical and histopathologic data from the 46 patients with SCRC (99 tumors) and 92 patients with solitary CRC (92 tumors) were collected through the electronic medical record and a microscopic examination. The parameters of the clinicopathologic data included patient age, sex, overall survival (OS), recurrence-free survival (RFS), tumor location, tumor multiplicity, American Joint Committee on Cancer (AJCC)/Union for International Cancer Control (UICC) tumor-node-metastasis (TNM) category, tumor differentiation, lymphovascular invasion, and perineural invasion.
- KRAS mutation and MSI analysis
- Through histological examination, representative tumor portions were marked and then subjected to manual microdissection. The dissected tissues were collected into microtubes containing lysis buffer and proteinase K and were incubated at 55°C for upto 2 days. DNA from paraffin-embedded tissues was extracted, and polymerase chain reaction was performed. Mutations in KRAS codons 12 and 13 were analyzed in each case using direct sequencing. The MSI status of each tumor was determined through the evaluation of five microsatellite markers (BAT25, BAT26, D2S123, D5S346, and D17S250) as standardized by the National Cancer Institute. MSI-H status was defined as when tumor DNA had altered alleles compared to normal DNA in two or more markers. MSI-low status was defined as when tumor DNA had altered allele compared to normal DNA in one marker. Microsatellite-stable was defined as when no altered allele was present in tumor DNA. We performed immunohistochemistry (IHC) for DNA mismatch repair proteins (MLH1 and MSH2) to assess MSI status for tumors that were not evaluated for MSI status using polymerase chain reaction-coupled capillary electrophoresis (50 individual tumors from SCRCs and 3 solitary CRCs). IHC was performed using antibodies against MLH1 (Ventana Medical Systems, Tucson, AZ, USA), MSH2 (Invitrogen, Camarillo, CA, USA) and automated immunostainers (Ventana BenchMark XT for MLH1; Bond-III, Leica Biosystems, Novocastra, Newcastle-upon-Tyne, UK for MSH2).
- Analysis of CIMP
- The CIMP status of individual tumors was analyzed using a real-time methylation-specific quantitative polymerase chain reaction method (MethyLight) and eight CIMP-specific markers (CACNA1G, CDKN2A, CRABP1, IGF2, MLH1, NEUROG1, RUNX3, and SOCS1). We classified CRCs into CIMP-0 (no methylated marker), CIMP-low (1–4 methylated markers), and CIMP-H (5 or more methylated markers).
- Statistical analysis
- In this study, statistical analysis was performed using SPSS ver. 23 (IBM Corp., Armonk, NY, USA). Comparison between categorical variables was conducted with the chi-square test or Fisher exact test. Survival analysis using OS and RFS data was performed using the Kaplan-Meier method with the log-rank test. Hazard ratios (HRs) were calculated using the Cox proportional hazard model. All variables that were associated with OS with a p < .10 were entered into the model. These variables were reduced by backward elimination. All p-values were two-sided and p-values of < .05 were considered to be statistically significant.
MATERIALS AND METHODS
- Clinicopathologic features
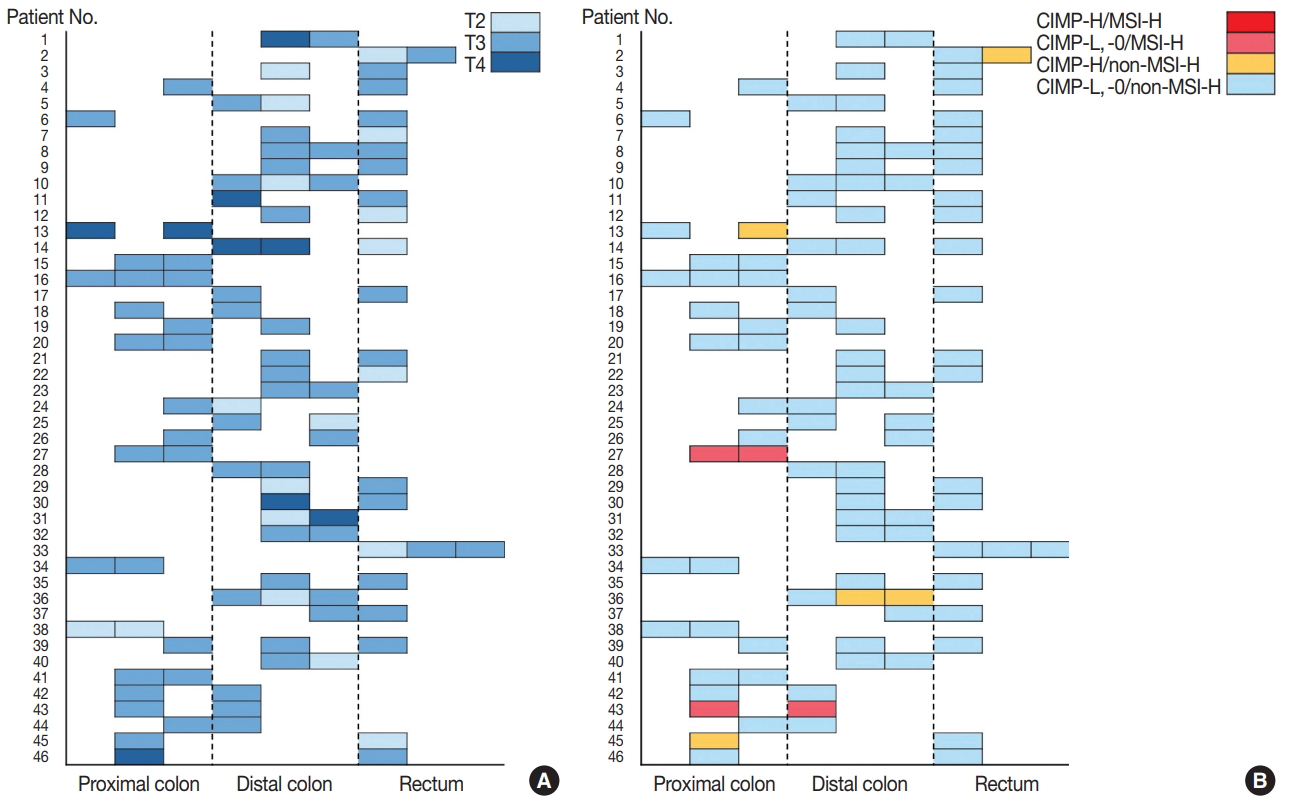
- The detailed clinicopathologic features are summarized in Table 1 and Fig. 2. SCRC with multiple advanced tumors was associated with more frequent nodal metastasis (p = .003) and advanced TNM category (p = .003). SCRC exhibited a tendency toward male predominance with marginal significance (p = .050). Metachronous metastasis was significantly more frequent in SCRCs with multiple advanced tumors than in solitary CRCs (p = .001). However, there were no significant differences in terms of lymphatic and vascular invasion between two groups. In addition, KRAS mutation and MSI status did not show any significant difference between the two groups. In CIMP analysis for SCRC, CIMP-H phenotype was observed in four of 46 patients (8.7%), which was quite lower compared with results of previous studies (35% in Nosho et al.’s study [26] and 66.6% in Gonzalo et al.’s study27). However, the frequency of CIMP-H in terms of individual tumors was 5.1% (5 of 99 tumors) which was not different from the frequency of CIMP-H in solitary CRCs (6.5%) of the present study and those of previous Korean CRC studies [34,35]. Nodal and distant metastasis showed significant differences between SCRC and solitary CRC when we restricted comparative analyses to CRC cases with non-extensive surgery or cases with R0 surgery (Table 2).
- Prognostic implication of tumor multiplicity in CRCs
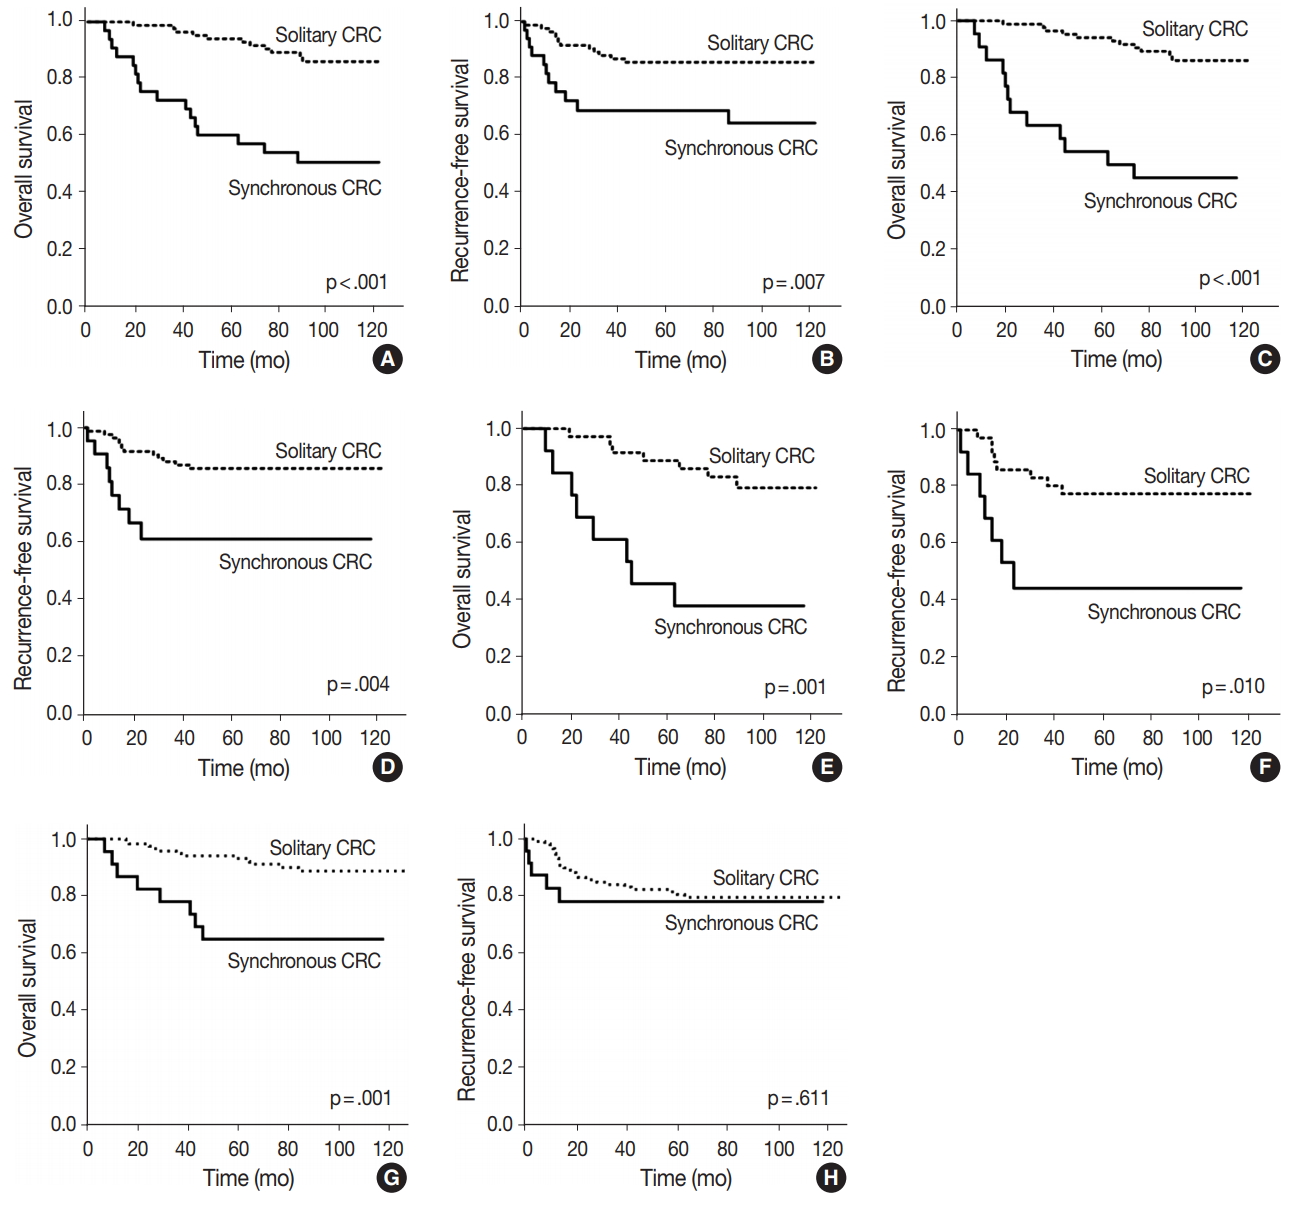
- In order to examine the prognostic effect of tumor multiplicity per se, we sought to focus on subgroups where compounding variables were adjusted. Firstly, we performed Kaplan-Meier survival analysis on patients who had no metastasis at the time of diagnosis and hence underwent curative surgery (85 patients with solitary CRC and 34 patients with SCRC). As a result, SCRC patients with multiple advanced tumors showed worse OS and RFS than the respective ones of patients with solitary CRC (Fig. 3A, B). Since it cannot be excluded a possibility that the extensiveness of surgery itself might affect the survival of patients with SCRC, survival analysis was conducted in 85 solitary CRC and 22 SCRC patients with exclusion of patients who underwent the extensive surgical procedures such as total colectomy and subtotal colectomy, which revealed significant associations between SCRC and poor OS or RFS (Fig. 3C, D). When we further excluded patients who did not receive adjuvant chemotherapy to adjust for the effect of adjuvant chemotherapy, univariate survival analysis in 36 patients with solitary CRC and 13 patients with SCRC revealed that the prognosis of SCRC with multiple advanced tumors tended to be worse than that of solitary CRC patients (Fig. 3E, F). To validate these results, we selected 24 SCRC cases with an index tumor of T3 category and recruited another independent set of patients with solitary CRC of T3 category (n = 120) on the criteria of R0 surgery and adjuvant chemotherapy. Because SCRC cases were composed of nine N0, seven N1, and eight N2 cases, 45 solitary CRC cases of N0 category, 35 of N1 category, and 40 of N2 category were recruited. Kaplan-Meier survival analysis showed that patients with SCRC still had worse OS compared with patients with solitary CRC group that matched T and N category, but not for RFS (Fig. 3G, H). In multivariate Cox regression analysis, tumor multiplicity was found to be an independent prognostic factor for OS (HR, 4.618; 95% confidence interval, 2.126 to 10.030; p < .001), but not for RFS (p = .151) (Tables 3, 4).
RESULTS
- In this study, we investigated the clinicopathologic and molecular characteristics of SCRC as well as the prognostic implication of the tumor multiplicity at the time of diagnosis. The reported incidence of SCRC in the literature varies from 1.1% to 8.1% [3,5,7-15]. This variance might be attributable to the difference in the definition of SCRC; whether FAP or intramucosal carcinoma is included or not in the definition of SCRC can make a significant difference [20]. In this study, we excluded SCRC associated with FAP (n = 3). The incidence of SCRC was 4.6% (n = 130) when intramucosal carcinomas were included and 3.2% (n = 91) when excluded, in line with the previous studies. Of these patients (n = 91), we excluded those patients who received neoadjuvant chemoand/or radiotherapy (n = 6) or T1-category lesion (n = 39). We only selected SCRCs in which all the individual tumors were of pT2 or higher category and resultantly, 46 patients were included in the present study.
- The median age at diagnosis of SCRC with multiple advanced tumors was higher than that of solitary CRC, but the difference did not reach a statistical significance in this study. Several studies have reported that the mean age of patients with SCRC is significantly higher than that of patients with solitary CRC [10,13,16]. However, in Oya et al.’s study [5], age difference failed to reach the statistical significance, and Latournerie et al. [12] conducted a largescale study to discover that there was no significant difference. Regarding sex distribution, previous studies reported that SCRC is more common in men [2-6], but this study confirmed this tendency only with the marginal significance. Previous studies have reported inconsistent results on the sidedness of SCRC. Finan et al. [18] reported that SCRC is more common in the distal part of colon, the same with the solitary CRC in general, but Lam et al. [22] showed that SCRC more commonly affects the proximal colon than solitary CRC does. In the present study, SCRC showed a tendency toward the right colon, but with no statistical significance.
- In line with several previous studies which showed that the proportion of advanced stage is higher in SCRC than in solitary CRC [12,19,20,22], we discovered that SCRC cases tended to be more advanced than solitary cases. Lymphatic and venous invasions tended to be more frequent in individual tumors of SCRC than in solitary CRC. Although our findings indicated that nodal metastasis was significantly more common in SCRC with multiple advanced tumors than in solitary CRC, a concern is that selection of solitary CRC might be biased toward collection of solitary CRC with less frequent nodal metastasis. To exclude such a possibility, we analyzed the frequency of nodal metastasis in 593 cases of solitary T3 CRC. The frequency of N0 was significantly higher in solitary T3 CRC than in SCRC with an index tumor of T3 category (45.5% vs. 26.3%, p = .027). This finding suggests that multiplicity of advanced T category–tumors might be a risk factor for nodal metastasis.
- Molecular analysis performed in this study revealed that the prevalence of MSI and KRAS mutation in the SCRC were not different from the respective ones of the solitary CRC. Out of the 99 individual tumors from 46 SCRC patients, only four tumors from two patients were MSI-H. The analysis of CIMP status for these tumors showed that these MSI-H tumors were negative for MLH1 methylation and not CIMP-H, which suggests the possibility that these SCRC patients with multiple MSI-H tumors might be patients with Lynch syndrome. In fact, both of these patients had first-degree relatives with CRC as well as SCRC with MSI-H phenotype, and could be diagnosed as hereditary nonpolyposis colon cancer. However, in previous studies, exploration on MSI status of SCRC showed a higher proportion of MSI-H phenotype in SCRC than in solitary CRC [23-25]. Nosho et al. [26] found that SCRC was more likely to be BRAF-mutated, CIMP-H and MSI-H, suggesting that MSI-H phenotype in SCRC is likely to be sporadic rather than hereditary. Such a discrepancy between previous studies and the present study might be attributable to the fact that we excluded tumors of Tis or T1 category or the fact that the frequency of CIMP-H phenotype is lower in CRCs from Korean patients than those from western people [36].
- Most of the previous studies reported that the survival of the patients with SCRC was not significantly different from that of patients with solitary CRC and only depended on the pathologic staging of the index cancer [22]. Even Hu et al. [10] suggested that patients with SCRC might have survival benefit. Only a few studies have discovered that patients with SCRC had worse prognosis than that of patients with solitary CRC [26,33]. It should be pointed out that previous studies which reported no difference in survival between SCRC and solitary CRC were conducted on a population of SCRC in which SCRC with Tis or T1 tumor as a non-index tumor comprise approximately 46% and 30% of the study cases, respectively [16,22]. In accordance with the hypothesis that patients with multiple advanced tumors would indeed have more tumor burden, we only selected SCRC cases in which all the individual tumors were of T2 or higher categories. Kaplan-Meier survival analysis showed that SCRC patients with multiple advanced tumors had worse survival than that of patients with solitary CRC. We performed a subgroup analysis in order to adjust for the effect of adjuvant chemotherapy, extensive surgical procedure such as total colectomy or subtotal colectomy, or T and N categories, and discovered that tumor multiplicity was an independent prognostic factor for OS in multivariate analysis. The reason why SCRC patients with multiple advanced tumors pursue worse clinical outcome than patients with solitary CRC is related to the fact that SCRC was associated with more frequent nodal metastasis and metachronous metastasis.
- In conclusion, we selected SCRC with all the individual tumors of T2 or higher category and compared various characteristics between SCRC and solitary CRC of similar T category–distribution. We found that SCRC was featured with higher incidence of nodal metastasis and metachronous metastasis and shortened OS time compared with solitary CRC. Based on the finding that multiplicity of advanced T category–tumors was an independent prognostic parameter heralding poor overall survival, the current staging of SCRC with multiple advanced tumors according to the tumor-node-metastasis guideline of AJCC that an index tumor of advanced T category determines the T category of SCRC, is likely to evaluate better than actual prognosis. More studies would be needed to validate this finding and discover the underlying mechanism of it.
DISCUSSION
Acknowledgments
| Variable | Solitary CRCs (92 patients, 92 tumors) | Synchronous CRCs (46 patients, 99 tumors) | p-value |
|---|---|---|---|
| Age (yr) | 63.5 (33–82) | 66.0 (43–88) | .087 |
| Sex | .050 | ||
| Male | 59 (64.1) | 37 (80.4) | |
| Female | 33 (35.9) | 9 (19.6) | |
| Location | .247 | ||
| Proximal | 18 (19.6) | 29 (29.3) | |
| Distal | 48 (52.2) | 42 (42.4) | |
| Rectum | 26 (28.3) | 28 (28.3) | |
| Gross type | .114 | ||
| Polypoid | 11 (12.0) | 22 (22.2) | |
| Ulcerofungating | 61 (66.3) | 53 (53.5) | |
| Ulceroinfiltrative | 20 (21.7) | 24 (24.2) | |
| T category | .548 | ||
| T2 | 12 (13.0) | 18 (18.2) | |
| T3 | 73 (79.3) | 72 (72.7) | |
| T4 | 7 (7.6) | 9 (9.1) | |
| N category | .003 | ||
| N0 | 49 (53.3) | 12 (26.1) | |
| N1, N2 | 43 (46.7) | 34 (73.9) | |
| M category | .001 | ||
| M0 | 73 (79.3) | 23 (50.0) | |
| Synchronous M1 | 7 (7.6) | 12 (26.1) | |
| Metachronous M1 | 12 (13.0) | 11 (23.9) | |
| Stage | .003 | ||
| I | 9 (9.8) | 1 (2.2) | |
| II | 40 (43.5) | 11 (23.9) | |
| III | 36 (39.1) | 22 (47.8) | |
| IV | 7 (7.6) | 12 (26.1) | |
| Surgery | < .001 | ||
| Simple | 92 | 30 (65.2) | |
| Extensive | 0 | 16 (34.8) | |
| Chemotherapy | 1.000 | ||
| Treated | 80 (87.0) | 40 (87.0) | |
| Non-treated | 12 (13.0) | 6 (13.0) | |
| Differentiation | .722a | ||
| Well | 9 (9.8) | 9 (9.1) | |
| Moderately | 78 (84.8) | 87 (87.9) | |
| Poorly | 5 (5.4) | 3 (3.0) | |
| Lymphatic invasion | .068 | ||
| Absent | 73 (79.3) | 67 (67.7) | |
| Present | 19 (20.7) | 32 (32.3) | |
| Venous invasion | .086 | ||
| Absent | 86 (93.5) | 85 (85.9) | |
| Present | 6 (6.5) | 14 (14.1) | |
| Perineural invasion | .986 | ||
| Absent | 80 (87.0) | 86 (86.9) | |
| Present | 12 (13.0) | 13 (13.1) | |
| MSI | 0.740a | ||
| MSS/MSI-low | 87 (94.6) | 95 (96.0) | |
| MSI-high | 5 (5.4) | 4 (4.0) | |
| KRAS mutation | .908 | ||
| Wild type | 55 (59.8) | 60 (60.6) | |
| Mutant | 37 (40.2) | 39 (39.4) | |
| CIMP | .761 | ||
| CIMP-0, low | 86 (93.5) | 94 (94.9) | |
| CIMP-high | 6 (6.5) | 5 (5.1) |
- 1. Ferlay J, Soerjomataram I, Dikshit R, et al. Cancer incidence and mortality worldwide: sources, methods and major patterns in GLOBOCAN 2012. Int J Cancer 2015; 136: E359-86. ArticlePubMed
- 2. Ghiringhelli F, Hennequin A, Drouillard A, Lepage C, Faivre J, Bouvier AM. Epidemiology and prognosis of synchronous and metachronous colon cancer metastases: a French population-based study. Dig Liver Dis 2014; 46: 854-8. ArticlePubMed
- 3. Kaibara N, Koga S, Jinnai D. Synchronous and metachronous malignancies of the colon and rectum in Japan with special reference to a coexisting early cancer. Cancer 1984; 54: 1870-4. ArticlePubMed
- 4. Lam AK, Chan SS, Leung M. Synchronous colorectal cancer: clinical, pathological and molecular implications. World J Gastroenterol 2014; 20: 6815-20. ArticlePubMedPMC
- 5. Oya M, Takahashi S, Okuyama T, Yamaguchi M, Ueda Y. Synchronous colorectal carcinoma: clinico-pathological features and prognosis. Jpn J Clin Oncol 2003; 33: 38-43. ArticlePubMedPDF
- 6. Yang J, Peng JY, Chen W. Synchronous colorectal cancers: a review of clinical features, diagnosis, treatment, and prognosis. Dig Surg 2011; 28: 379-85. ArticlePubMedPDF
- 7. Cunliffe WJ, Hasleton PS, Tweedle DE, Schofield PF. Incidence of synchronous and metachronous colorectal carcinoma. Br J Surg 1984; 71: 941-3. ArticlePubMedPDF
- 8. Evers BM, Mullins RJ, Matthews TH, Broghamer WL, Polk HC Jr. Multiple adenocarcinomas of the colon and rectum: an analysis of incidences and current trends. Dis Colon Rectum 1988; 31: 518-22. PubMed
- 9. Fukatsu H, Kato J, Nasu JI, et al. Clinical characteristics of synchronous colorectal cancer are different according to tumour location. Dig Liver Dis 2007; 39: 40-6. ArticlePubMed
- 10. Hu H, Chang DT, Nikiforova MN, Kuan SF, Pai RK. Clinicopathologic features of synchronous colorectal carcinoma: a distinct subset arising from multiple sessile serrated adenomas and associated with high levels of microsatellite instability and favorable prognosis. Am J Surg Pathol 2013; 37: 1660-70. PubMed
- 11. Kimura T, Iwagaki H, Fuchimoto S, Hizuta A, Orita K. Synchronous colorectal carcinomas. Hepatogastroenterology 1994; 41: 409-12. PubMed
- 12. Latournerie M, Jooste V, Cottet V, Lepage C, Faivre J, Bouvier AM. Epidemiology and prognosis of synchronous colorectal cancers. Br J Surg 2008; 95: 1528-33. ArticlePubMedPDF
- 13. Mulder SA, Kranse R, Damhuis RA, et al. Prevalence and prognosis of synchronous colorectal cancer: a Dutch population-based study. Cancer Epidemiol 2011; 35: 442-7. ArticlePubMed
- 14. Ueno M, Muto T, Oya M, Ota H, Azekura K, Yamaguchi T. Multiple primary cancer: an experience at the Cancer Institute Hospital with special reference to colorectal cancer. Int J Clin Oncol 2003; 8: 162-7. ArticlePubMedPDF
- 15. Wang HZ, Huang XF, Wang Y, Ji JF, Gu J. Clinical features, diagnosis, treatment and prognosis of multiple primary colorectal carcinoma. World J Gastroenterol 2004; 10: 2136-9. ArticlePubMedPMC
- 16. Kato T, Alonso S, Muto Y, et al. Clinical characteristics of synchronous colorectal cancers in Japan. World J Surg Oncol 2016; 14: 272.ArticlePubMedPMCPDF
- 17. Chen HS, Sheen-Chen SM. Synchronous and “early” metachronous colorectal adenocarcinoma: analysis of prognosis and current trends. Dis Colon Rectum 2000; 43: 1093-9. PubMed
- 18. Finan PJ, Ritchie JK, Hawley PR. Synchronous and ‘early’ metachronous carcinomas of the colon and rectum. Br J Surg 1987; 74: 945-7. ArticlePubMedPDF
- 19. Kim YJ, Kim NK, Lee KY, Sohn SK, Min JS. Clinicopathological characteristics of multiple primary colorectal cancer. J Korean Soc Coloproctol 2002; 18: 343-8.
- 20. Kang JG, Kim DH, Kim CH, Lee SH, Choi YJ. Clinical characteristics of synchronous multiple colorectal cancer. J Korean Soc Coloproctol 2006; 22: 418-23.
- 21. Welch JP. Multiple colorectal tumors: an appraisal of natural history and therapeutic options. Am J Surg 1981; 142: 274-80. PubMed
- 22. Lam AK, Carmichael R, Gertraud Buettner P, Gopalan V, Ho YH, Siu S. Clinicopathological significance of synchronous carcinoma in colorectal cancer. Am J Surg 2011; 202: 39-44. ArticlePubMed
- 23. Pedroni M, Tamassia MG, Percesepe A, et al. Microsatellite instability in multiple colorectal tumors. Int J Cancer 1999; 81: 1-5. ArticlePubMed
- 24. Norrie MW, Hawkins NJ, Todd AV, Meagher AP, O’Connor TW, Ward RL. The role of hMLH1 methylation in the development of synchronous sporadic colorectal carcinomas. Dis Colon Rectum 2002; 45: 674-80. ArticlePubMed
- 25. Dykes SL, Qui H, Rothenberger DA, García-Aguilar J. Evidence of a preferred molecular pathway in patients with synchronous colorectal cancer. Cancer 2003; 98: 48-54. ArticlePubMed
- 26. Nosho K, Kure S, Irahara N, et al. A prospective cohort study shows unique epigenetic, genetic, and prognostic features of synchronous colorectal cancers. Gastroenterology 2009; 137: 1609-20. e1-3. ArticlePubMedPMC
- 27. Gonzalo V, Lozano JJ, Alonso-Espinaco V, et al. Multiple sporadic colorectal cancers display a unique methylation phenotype. PLoS One 2014; 9: e91033. ArticlePubMedPMC
- 28. Brueckl WM, Limmert T, Brabletz T, et al. Mismatch repair deficiency in sporadic synchronous colorectal cancer. Anticancer Res 2000; 20: 4727-32. PubMed
- 29. Kamiyama H, Suzuki K, Maeda T, et al. DNA demethylation in normal colon tissue predicts predisposition to multiple cancers. Oncogene 2012; 31: 5029-37. ArticlePubMedPMCPDF
- 30. Eguchi K, Yao T, Konomoto T, Hayashi K, Fujishima M, Tsuneyoshi M. Discordance of p53 mutations of synchronous colorectal carcinomas. Mod Pathol 2000; 13: 131-9. ArticlePubMedPDF
- 31. Giannini R, Lupi C, Loupakis F, et al. KRAS and BRAF genotyping of synchronous colorectal carcinomas. Oncol Lett 2014; 7: 1532-6. ArticlePubMedPMC
- 32. Ronnekleiv-Kelly SM, Pawlik TM. Staging of intrahepatic cholangiocarcinoma. Hepatobiliary Surg Nutr 2017; 6: 35-43. ArticlePubMedPMC
- 33. Enker WE, Dragacevic S. Multiple carcinomas of the large bowel: a natural experiment in etiology and pathogenesis. Ann Surg 1978; 187: 8-11. PubMedPMC
- 34. Bae JM, Kim JH, Cho NY, Kim TY, Kang GH. Prognostic implication of the CpG island methylator phenotype in colorectal cancers depends on tumour location. Br J Cancer 2013; 109: 1004-12. ArticlePubMedPMCPDF
- 35. Oh HJ, Bae JM, Wen XY, Cho NY, Kim JH, Kang GH. Overexpression of POSTN in tumor stroma is a poor prognostic indicator of colorectal cancer. J Pathol Transl Med 2017; 51: 306-13. ArticlePubMedPMCPDF
- 36. Bae JM, Kim JH, Kang GH. Molecular subtypes of colorectal cancer and their clinicopathologic features, with an emphasis on the serrated neoplasia pathway. Arch Pathol Lab Med 2016; 140: 406-12. ArticlePubMedPDF
REFERENCES
Figure & Data
References
Citations
- Reveal the Regulation Patterns of Prognosis-Related miRNAs and lncRNAs Across Solid Tumors in the Cancer Genome Atlas
Zuojing Yin, Qiming Wang, Xinmiao Yan, Lu Zhang, Kailin Tang, Zhiwei Cao, Tianyi Qiu
Frontiers in Cell and Developmental Biology.2020;[Epub] CrossRef - Whole-Slide Image Analysis Reveals Quantitative Landscape of Tumor–Immune Microenvironment in Colorectal Cancers
Seung-Yeon Yoo, Hye Eun Park, Jung Ho Kim, Xianyu Wen, Seorin Jeong, Nam-Yun Cho, Hwang Gwan Gwon, Kwangsoo Kim, Hye Seung Lee, Seung-Yong Jeong, Kyu Joo Park, Sae-Won Han, Tae-You Kim, Jeong Mo Bae, Gyeong Hoon Kang
Clinical Cancer Research.2020; 26(4): 870. CrossRef
 PubReader
 ePub Link
-
 Cite this Article
- Cite this Article
-
- Close
- Download Citation
- Close
- Figure
-


Fig. 1.
Fig. 2.
Fig. 3.
| Variable | Solitary CRCs (92 patients, 92 tumors) | Synchronous CRCs (46 patients, 99 tumors) | p-value |
|---|---|---|---|
| Age (yr) | 63.5 (33–82) | 66.0 (43–88) | .087 |
| Sex | .050 | ||
| Male | 59 (64.1) | 37 (80.4) | |
| Female | 33 (35.9) | 9 (19.6) | |
| Location | .247 | ||
| Proximal | 18 (19.6) | 29 (29.3) | |
| Distal | 48 (52.2) | 42 (42.4) | |
| Rectum | 26 (28.3) | 28 (28.3) | |
| Gross type | .114 | ||
| Polypoid | 11 (12.0) | 22 (22.2) | |
| Ulcerofungating | 61 (66.3) | 53 (53.5) | |
| Ulceroinfiltrative | 20 (21.7) | 24 (24.2) | |
| T category | .548 | ||
| T2 | 12 (13.0) | 18 (18.2) | |
| T3 | 73 (79.3) | 72 (72.7) | |
| T4 | 7 (7.6) | 9 (9.1) | |
| N category | .003 | ||
| N0 | 49 (53.3) | 12 (26.1) | |
| N1, N2 | 43 (46.7) | 34 (73.9) | |
| M category | .001 | ||
| M0 | 73 (79.3) | 23 (50.0) | |
| Synchronous M1 | 7 (7.6) | 12 (26.1) | |
| Metachronous M1 | 12 (13.0) | 11 (23.9) | |
| Stage | .003 | ||
| I | 9 (9.8) | 1 (2.2) | |
| II | 40 (43.5) | 11 (23.9) | |
| III | 36 (39.1) | 22 (47.8) | |
| IV | 7 (7.6) | 12 (26.1) | |
| Surgery | < .001 | ||
| Simple | 92 | 30 (65.2) | |
| Extensive | 0 | 16 (34.8) | |
| Chemotherapy | 1.000 | ||
| Treated | 80 (87.0) | 40 (87.0) | |
| Non-treated | 12 (13.0) | 6 (13.0) | |
| Differentiation | .722 |
||
| Well | 9 (9.8) | 9 (9.1) | |
| Moderately | 78 (84.8) | 87 (87.9) | |
| Poorly | 5 (5.4) | 3 (3.0) | |
| Lymphatic invasion | .068 | ||
| Absent | 73 (79.3) | 67 (67.7) | |
| Present | 19 (20.7) | 32 (32.3) | |
| Venous invasion | .086 | ||
| Absent | 86 (93.5) | 85 (85.9) | |
| Present | 6 (6.5) | 14 (14.1) | |
| Perineural invasion | .986 | ||
| Absent | 80 (87.0) | 86 (86.9) | |
| Present | 12 (13.0) | 13 (13.1) | |
| MSI | 0.740 |
||
| MSS/MSI-low | 87 (94.6) | 95 (96.0) | |
| MSI-high | 5 (5.4) | 4 (4.0) | |
| KRAS mutation | .908 | ||
| Wild type | 55 (59.8) | 60 (60.6) | |
| Mutant | 37 (40.2) | 39 (39.4) | |
| CIMP | .761 | ||
| CIMP-0, low | 86 (93.5) | 94 (94.9) | |
| CIMP-high | 6 (6.5) | 5 (5.1) |
| Variable | Total cases of CRC |
CRC cases with R0 resection |
CRC cases with non-extensive surgery |
|||
|---|---|---|---|---|---|---|
| Solitary CRC (n = 92) | SCRC (n = 46) | Solitary CRC (n = 85) | SCRC (n = 34) | Solitary CRC (n = 92) | SCRC (n = 30) | |
| Age (yr) | 63.5 (33–82) | 66.0 (43–88) | 63.0 (33–82) | 66.0 (48–79) | 63.5 (33–82) | 66.0 (43–88) |
| p-value | .087 | .150 | .168 | |||
| Sex | ||||||
| Male | 59 (64.1) | 37 (80.4) | 56 (65.9) | 25 (73.5) | 59 (64.1) | 24 (80.0) |
| Female | 33 (35.9) | 9 (19.6) | 29 (34.1) | 9 (26.5) | 33 (35.9) | 6 (20.0) |
| p-value | .050 | .419 | .106 | |||
| T category | ||||||
| T2 | 12 (13.0) | 18 (18.2) | 12 (14.1) | 13 (17.8) | 12 (13.0) | 13 (20.3) |
| T3 | 73 (79.3) | 72 (72.7) | 68 (80.0) | 52 (71.2) | 73 (79.3) | 42 (65.6) |
| T4 | 7 (7.6) | 9 (9.1) | 5 (5.9) | 8 (11.0) | 7 (7.6) | 9 (14.1) |
| p-value | .548 | .374 | .154 | |||
| N category | ||||||
| N0 | 49 (53.3) | 12 (26.1) | 49 (57.6) | 12 (35.3) | 49 (53.3) | 8 (26.7) |
| N1, N2 | 43 (46.7) | 34 (73.9) | 36 (42.4) | 22 (64.7) | 43 (46.7) | 22 (73.3) |
| p-value | .003 | .028 | .011 | |||
| M category | ||||||
| M0 | 73 (79.3) | 23 (50.0) | 73 (85.9) | 23 (67.6) | 73 (79.3) | 14 (46.7) |
| Synchronous M1 | 7 (7.6) | 12 (26.1) | - | - | 7 (7.6) | 8 (26.7) |
| Metachronous M1 | 12 (13.0) | 11 (23.9) | 12 (14.1) | 11 (32.4) | 12 (13.0) | 8 (26.7) |
| p-value | .001 | .023 | .002 | |||
| Lymphatic invasion | ||||||
| Absent | 73 (79.3) | 67 (67.7) | 69 (81.2) | 53 (72.6) | 73 (79.3) | 37 (57.8) |
| Present | 19 (20.7) | 32 (32.3) | 16 (18.8) | 20 (27.4) | 19 (20.7) | 27 (42.2) |
| p-value | .068 | .200 | .004 | |||
| Venous invasion | ||||||
| Absent | 86 (93.5) | 85 (85.9) | 81 (95.3) | 65 (89.0) | 86 (93.5) | 55 (85.9) |
| Present | 6 (6.5) | 14 (14.1) | 4 (4.7) | 8 (11.0) | 6 (6.5) | 9 (14.1) |
| p-value | .086 | .139 | .116 | |||
| Variable | Univariate |
Multivariate |
||
|---|---|---|---|---|
| HR | p-value | HR | p-value | |
| Age (≥ 65 yr/< 65 yr) | 4.088 (1.728–9.673) | .001 | 4.041 (1.703–9.587) | .002 |
| Sex (male/female) | 1.051 (0.472–2.347) | .902 | - | - |
| Multiplicity (synchronous/solitary) | 5.075 (2.350–10.960) | < .001 | 4.618 (2.126–10.030) | < .001 |
| T category (T3, 4/T2) | 3.487 (0.473–25.709) | .220 | - | - |
| N category (N1, 2/N0) | 3.617 (1.528–8.564) | .003 | 3.072 (1.291–7.309) | .011 |
| Vascular invasion (present/absent) | 2.373 (0.897–6.273) | .082 | - | .159 |
| Lymphatic invasion (present/absent) | 2.836 (1.326–6.065) | .007 | - | .122 |
| Perineural invasion (present/absent) | 1.617 (0.612–4.270) | .333 | - | - |
| Tumor location (including right colon/left colon only) | 0.907 (0.397–2.072) | .817 | - | - |
| Chemotherapy (treated/not-treated) | 1.088 (0.376–3.147) | .876 | - | - |
| Surgery (extensive/simple) | 1.837 (0.635–5.314) | .262 | - | - |
| MSI (MSI-H/MSS, MSI-L) | 0.045 (0.000–33.308) | .357 | - | - |
| KRAS (mutant/wild type) | 2.337 (1.049–5.204) | .038 | - | - |
| Variable | Univariate |
Multivariate |
||
|---|---|---|---|---|
| HR | p-value | HR | p-value | |
| Age (≥ 65 yr/< 65 yr) | 1.803 (0.791–4.114) | .161 | 2.163 (0.905–5.171) | .083 |
| Sex (male/female) | 1.672 (0.733–3.815) | .222 | - | - |
| Multiplicity (synchronous/solitary) | 2.939 (1.294–6.674) | .010 | - | .151 |
| T category (T3, 4/T2) | 2.993 (0.403–22.224) | .284 | - | - |
| N category (N1, 2/N0) | 4.378 (1.623–11.805) | .004 | 3.943 (1.457–10.670) | .007 |
| Vascular invasion (present/absent) | 3.658 (1.440–9.294) | .006 | 4.114 (1.527–11.081) | .005 |
| Lymphatic invasion (present/absent) | 3.096 (1.365–7.025) | .007 | - | .225 |
| Perineural invasion (present/absent) | 2.417 (0.952–6.136) | .063 | - | - |
| Tumor location (including right colon/left colon only) | 1.370 (0.509–3.690) | .534 | - | - |
| Chemotherapy (treated/not-treated) | 0.555 (0.130–2.369) | .427 | - | - |
| Surgery (extensive/simple) | 1.535 (0.456–5.169) | .489 | - | - |
| MSI (MSI-H/MSS, MSI-L) | 0.045 (0.000–63.182) | .401 | - | - |
| KRAS (mutant/wild type) | 1.776 (0.768–4.105) | .179 | - | - |
CRC, colorectal carcinoma; MSI, microsatellite instability; MSS, microsatellite-stable; CIMP, CpG island methylator phenotype. Fisher exact test.
Values are presented as median (range) or number (%).
HR, hazard ratio; MSI, microsatellite instability; MSI-H, MSI-high; MSS, microsatellite-stable; MSI-L, MSI-low.
HR, hazard ratio; MSI, microsatellite instability; MSI-H, MSI-high; MSS, microsatellite-stable; MSI-L, MSI-low.

