 E-submission
Articles
- Page Path
- HOME > J Pathol Transl Med > Volume 48(2); 2014 > Article
-
Original Article
IMP3, a Promising Prognostic Marker in Clear Cell Renal Cell Carcinoma - Ji Young Park, Misun Choe, Yuna Kang, Sang Sook Lee
-
Korean Journal of Pathology 2014;48(2):108-116.
DOI: https://doi.org/10.4132/KoreanJPathol.2014.48.2.108
Published online: April 28, 2014
Department of Pathology, Keimyung University School of Medicine, Daegu, Korea.
- Corresponding Author: Misun Choe, M.D. Department of Pathology, Keimyung University School of Medicine, 56 Dalseong-ro, Jung-gu, Daegu 700-712, Korea. Tel: +82-53-580-3815, Fax: +82-53-580-3823, msc@dsmc.or.kr
© 2014 The Korean Society of Pathologists/The Korean Society for Cytopathology
This is an Open Access article distributed under the terms of the Creative Commons Attribution Non-Commercial License (http://creativecommons.org/licenses/by-nc/3.0/) which permits unrestricted non-commercial use, distribution, and reproduction in any medium, provided the original work is properly cited.
Abstract
-
Background
- Insulin-like growth factor II mRNA-binding protein 3 (IMP3) has been reported as a prognostic biomarker in various cancers. To validate IMP3 as a prognostic biomarker in renal cell carcinoma (RCC), we investigated the expression of IMP3, p53, and Ki-67, and their associations with clinicopathologic outcomes.
-
Methods
- We studied 148 clear cell RCCs (CCRCCs) from patients who underwent radical nephrectomy. The expression levels of IMP3, p53, and Ki-67 were assessed by immunohistochemical staining and the clinical and pathologic parameters were retrospectively reviewed.
-
Results
- Twenty-nine percent of CCRCCs expressed IMP3. Forty-one percent of IMP3-immunopositive tumors developed metastases, while only 11.4% of IMP3-negative tumors developed metastases (p<.001). A Kaplan-Meier curve showed that patients with IMP3-immunopositive tumors had lower metastasis-free survival and cancer-specific survival than did those with IMP3-immunonegative tumors (p<.001 and p<.001, respectively). Expression of high Ki-67 proliferation index was also associated with a higher metastatic rate. In the multivariate Cox regression analysis, pT stage and IMP3-positivity were independently associated with disease-specific survival.
-
Conclusions
- IMP3 is an independent prognostic biomarker for patients with CCRCC to predict metastasis and poor outcome.
- Patient selection and clinicopathologic data
- We studied 148 consecutive patients who underwent radical nephrectomy for CCRCCs from the archives of the Pathology Department of Keimyung University Dongsan Medical Center between 1993 and 2007. Clinicopathologic data were obtained by reviewing all clinical and pathologic reports for each patient. Hematoxylin and eosin (H&E)-stained sections of all samples were available for review and 2 pathologists confirmed the diagnoses. T classification (or T stage) was defined according to the seventh edition of the American Joint Committee on Cancer (AJCC) cancer staging manual and the nuclear grading was rendered according to Fuhrman's grading scheme. Metastasis was determined based on surveillance imaging or histologic evaluation of a metastatic site. Metastasis-free survival was calculated from the date of nephrectomy to the date of metastasis detection or the last follow-up in patients with no evidence of metastasis. Cancer-specific survival was measured from the date of nephrectomy to the date of death with disease or date of the last follow-up for survivors.
- Tissue microarray and immunohistochemical staining
- From each case of CCRCCs, two to three 3.0 mm cores were taken from morphologically representative regions of each formalin-fixed paraffin-embedded tumor and precisely arrayed by a manual method. Five-µm-thick sections of the tissue microarray blocks were cut and H&E staining was performed by the usual methods. From each tissue microarray block, 4-µm-thick sections were deparaffinized, rehydrated, and quenched with hydrogen peroxide. Immunohistochemical staining was conducted using Bench Mark XT with iVIEW DAB detection kit (Ventana Medical Systems, Tucson, AZ, USA). The primary antibodies used were IMP3 (1:300, M3626, Dako, Carpinteria, CA, USA), p53 (1:100, M7001, Dako), and Ki-67 (1:200, ab16667, Abcam, San Francisco, CA, USA). The sections were visualized with diaminobenzidine and counterstained with hematoxylin. Tissue of RCC with known IMP expression was used as a positive control. Immunohistochemical staining with primary antibody omitted was used as a negative control.
- Analysis of immunohistochemical staining
- Immunostaining for IMP3 showed a cytoplasmic or membranous pattern (Fig. 1). Nuclear expression for p53 and Ki-67 were accepted as positive. Two pathologists, blinded to clinicopathologic variables and clinical outcome, evaluated the intensity and extent of the immunostaining. IMP3 and p53 expression levels were semi-quantitatively assessed and classified into negative and positive groups. The negative group was defined as cases in which the number of cells stained was less than 5%, while the positive group included cases in which the number of cells stained exceeded 5%. The 5% cut-off appeared to be optimal for stratifying expression. Quantification of Ki-67 PI was performed by assessing the percentage of stained tumor cells using a Nikon eclipse 50i light microscope (Nikon, Tokyo, Japan) with a 40× objective lens (Plan Fluor 40 X /0.75, Nikon). The percentage of stained cells was examined in the maximally stained area with 5 consecutive high power fields (HPF) (field area of one HPF, 0.307 mm2). The average percentage of stained cells was recorded after repeating the process three times. Ki-67 status was then classified as a low (less than 10% tumor cells) or a high (more than 10%) PI group.
- Statistical analysis
- Age, sex, tumor size, pT stage, presence of sarcomatoid change, nuclear grade, status of survival, and presence of metastasis were collected as fundamental variables. Associations of IMP3, p53, or Ki-67 expression with clinicopathologic features were evaluated using independent t-test, chi-square, and Fisher exact tests. Cancer-specific survival and metastasis-free survival were estimated by the Kaplan-Meier method using the log rank test. Multivariated analyses for survival were performed with Cox regression tests and summarized with hazard ratio (HR) and 95% confidence intervals (CI). A two-sided p-value of <.05 was considered statistically significant. PASW ver. 18.0 (SPSS Inc., Chicago, IL, USA) was used for statistical analysis.
MATERIALS AND METHODS
- Clinicopathologic features
- Our study included 108 males (73.0%) and 40 females (27.0%) who were aged from 19 to 82 years with a mean age of 56.2±11.6 years. The average tumor size was 5.6±2.5 cm (range, 1 to 14 cm; median, 6.0 cm). The tumor pT stage consisted of 94 cases (63.5%) of pT1, 27 (18.2%) of pT2, 26 (17.6%) of pT3, and 1 (0.7%) of pT4. The Fuhrman's grading of the tumors was as follows: 2 (1.4%) grade 1, 37 (25.0%) grade 2, 99 (66.9%) grade 3, and 10 (6.8%) grade 4. Sarcomatoid changes were observed in 6 cases (4.8%).
- The mean follow-up period was 61.8±46.1 months (range, 0 to 227 months; median, 55.5 months). During follow-up, 30 patients (20.3%) developed distant metastasis at a mean of 34.3±44.2 months (range, 0 to 119 months; median, 16.5 months). The most common site of metastasis was the lung (n=19) followed by bone (n=12), liver (n=8), and brain (n=2), respectively. During follow-up, 15 patients (10.1%) died with disease at an average of 27.7±26.9 months (range, 3 to 100 months; median, 15 months) after nephrectomy.
- Relationships between immunohistochemical staining results with patient outcomes
- Forty-three cases (29.1%) of CCRCCs were positive for IMP3 and 105 cases (70.9%) were negative. The patient outcomes were not significantly different with regard to extent of IMP3 immunopositivity (data not shown), as shown in a previous study.8 Thus, this study analyzed two groups of CCRCCs, IMP3-immunopositive and IMP3-immunonegative. Comparisons of clinicopathologic features by IMP3 expression are summarized in Table 1. The IMP3-immunopositive tumors were larger than IMP3-immunonegative tumors (p=.001) and presented at higher pT stage (p=.001). For pT1 and pT2 tumors, 21.3% (20/94) and 25.9% (7/27) were IMP3-immunopositive. For pT3 and pT4 tumors, 57.7% (15/26) and 100% (1/1) were IMP3-immunopositive. IMP3 expression was significantly associated with higher tumor grade (p<.001) and sarcomatoid change (p<.001). While no grade 1 and 5.4% (2/37) of grade 2 tumors showed IMP3 positivity, 31.3% (31/99) and 100% (10/10) of grades 3 and 4, respectively, were positive for IMP3. IMP3 expression also showed a strong relationship with distant metastasis (p<.001) and patient outcome (p<.001). Patients with IMP3-immunopositive tumors were greater than 5 times more likely to progress to distant metastasis compared with patients with IMP3-immunonegative tumors (odds ratio [OR], 5.580; 95% CI, 2.377 to 13.101). In addition, IMP3-immunopositive tumors were associated with a greater than 8-fold increased risk of disease-related death (OR, 8.680; 95% CI, 2.584 to 29.150). There were no correlations between IMP3 expression and age or sex.
- Tumors with p53 positivity (more than 5% of tumor cells) were found in 61 (41.2%) of 148 patients with CCRCC. The average ages of patients with p53-immonopositive and -immunonegative tumors were 55.3±10.5 years (range, 26 to 81 years; median, 55 years) and 56.9±12.3 years (range, 19 to 82 years; median, 58 years), respectively. The average sizes of p53-positive and -negative tumors were 5.4±2.6 cm (range, 1.0 to 13.0 cm; median, 5.0 cm) and 5.7±2.4 cm (range, 2.0 to 14.0 cm; median, 6.0 cm), respectively. No statistical differences in patient age and tumor size were present between p53-immunopositive and -immunonegative tumors. There were also no correlations between p53 positivity and sex, grade, sarcomatoid change, pT stage, development of metastasis, or death with disease (Table 2). However, tumors with p53 positivity showed more frequent IMP3 expression (p<.001) (Table 3). Among 61 p53-immunopositive tumors, 28 (45.9%) tumors showed IMP3 positivity. Of 87 p53-immunonegative tumors, only 15 (17.2%) tumors were classified as IMP3-positive.
- Among the 148 tumors, 44 tumors (29.7%) showed high Ki-67 PI and the remaining 104 tumors (70.3%) showed low PI. The average ages of patients with high and low PI were 57.4±11.8 years (range, 30 to 81 years; median, 59.5 years) and 55.7±11.5 years (range, 19 to 82 years; median, 55.5 years), respectively, and were not statistically different. A tumor with high PI (6.2±2.9 cm; range, 1 to 14 cm; median, 6.0 cm) tended to be larger than a tumor with low PI (5.3±2.2 cm; range, 2 to 11 cm; median, 5.0 cm) but the difference was not significant. Having high PI was associated with higher tumor grade, sarcomatoid change, higher pT stage, and more frequent metastasis (p<.001, p=.009, p<.001, and p=.007, respectively) but not with cancer-specific survival (Table 2). PI also showed strong correlations with IMP3 and p53 positivity (p<.001 and p<.001, respectively) (Table 3). Of 44 tumors with high PI, 26 (59.1%) and 28 (63.6%) revealed IMP3 and p53 positivity, respectively, while 17 (16.3%) and 33 (31.7%) of 104 low PI tumors were IMP3- and p53-immunopositive, respectively.
- Analyses of risk factors for disease progression
- Analysis results for risk factors of metastasis are summarized in Table 4. More frequent metastases were observed in patients with tumors with IMP3 expression or high Ki-67 PI (p<.001 and p=.007, respectively). The positive and negative predictive values of IMP3 positivity for metastasis were 41.9 and 88.6, respectively, compared with 15.9 and 92.3, respectively, in the case of high Ki-67 PI. Co-expression of IMP3 and high Ki-67 PI showed 26.9 of positive predictive value and 93.4 of negative predictive value. Development of metastasis also correlated with tumor size, pT stage, sarcomatoid change, and nuclear grade (p=.002, p<.001, p=.001, and p<.001, respectively). No correlation was observed between metastasis and age, sex, or p53 expression. For multivariated analysis, tumors were re-grouped in terms of pT stage and nuclear grade. Tumors with pT stages 1 or 2 were considered as low and those with stages 3 or 4 as high. The tumors with nuclear grades 1 or 2 were grouped as low and tumors with grades 3 or 4 as high. After adjustment for nuclear grade, pT stage, and IMP3 positivity, multivariate analysis showed that the high pT stage (p=.001; OR, 5.924; 95% CI, 2.153 to 16.302) and IMP3 positivity (p=0.045; OR, 2.665; 95% CI, 1.021 to 6.956) were independently associated with metastasis.
- Survival analyses
- In Kaplan-Meier analysis using the log-rank test, IMP3 expression was significantly associated with shorter metastasis-free survival (p<.0001) and disease-specific survival (p<.0001) (Fig. 2). Overall metastasis-free survival rates at 5 years and 10 years after nephrectomy were 80% and 72%, respectively. Metastasis-free survival rates at 5 and 10 years for patients with IMP3-immunopositive tumors were 60% and 46%, respectively, compared with 88% and 82%, respectively, for patients with IMP3-negative tumors. Overall disease-specific survival rates at 5 and 10 years were 93% and 93%, respectively. Survival rates at 5 and 10 years for patients with IMP3-immunopositive tumors were 70% and 70%, respectively, compared with 96% and 91%, respectively, for patients with IMP3-immunonegative tumors. Among other clinicopathologic values, grade, pT stage, and high Ki-67 PI significantly correlated with shorter metastasis-free survival (p<.0001, p<.0001, and p=.002), while grading and pT staging were also associated with shorter disease-specific survival (p<.0001 and p<.0001, respectively) (Figs. 3, 4). In the multivariate Cox regression model adjusted for pT stage, grading, and IMP3 positivity, pT stage (HR, 4.788; 95% CI, 1.584 to 14.471; p=.006) and IMP3 positivity (HR, 1.4.175; 95% CI, 1.159 to 15.043; p=.029) were significantly associated with disease-specific survival.
RESULTS
IMP3 expression
p53 expression
Ki-67 PI
- The incidence of RCC is increasing steadily and nephrectomy is the standard of care for localized RCC.2 Between 20% and 40% of patients with localized tumors develop metastasis during follow-up and survival rates for those with metastatic disease are typically less than 10%.3,4,20 For the metastatic disease, there are no effective therapies because RCCs are generally resistant to systemic chemotherapy, radiotherapy, and hormone therapy, or are marginally sensitive to immunotherapy.21 Recently, new drugs like sorafenib, sunitinib, and temsirolimus have been used for patients with metastatic RCC. However, the survival improvement of these new drugs is not sufficient.22 Therefore, a biomarker that can detect RCCs with high possibility of metastasis is promising for the management of patients, understanding of carcinogenesis, and development of new drugs.
- In this study, well-accepted RCC-associated prognostic factors including nuclear grade, sarcomatoid change, tumor stage, and tumor size were ascertained as important prognostic factors associated with distant metastasis and poor patient outcome.6 IMP3 expression was associated with development of distant metastasis and poor outcome. Patients with IMP3-immunopositive tumors developed metastasis and died with disease more frequently than did those with IMP3-immunonegative tumors. IMP3 positivity was also associated with higher tumor grade, more frequent sarcomatoid change, larger tumor size, and higher pT stage. In multivariated analysis, IMP3 expression was independently associated with development of metastasis along with pT stage. In survival analysis, patients with IMP3-immunopositive tumors showed shorter metastasis-free survival and disease-specific survival. In multivariated analysis for disease-specific survival, IMP3 expression was independently associated with shorter survival. These data show that IMP3 expression in primary RCC is strongly associated with metastatic potential and provides important prognostic information for patients with localized tumor after nephrectomy. These results are consistent with those of previous studies performed in the western countries. Jiang et al.2,3 demonstrated that IMP3 expression was significantly associated with higher stage, nuclear grade, and distant metastases in RCC patients. Hoffmann et al.8 also showed that IMP3 expression represented an independent predictor of aggressive CCRCC tumor behavior associated with advanced stage and higher grade.
- Although IMP3 expression has significance in CCRCC, the mechanism of IMP3 in metastasis is underexplored at the current time. IMP3 is an RNA binding protein and the RNA targets of IMP3 include β-actin, c-myc, IGF-II, and Gli1.23,24 It has been implicated in various post-transcriptional processes, such as stabilization of transcript, mRNA localization, and translational control.24 Recently, IMP3 was demonstrated to promote cell adhesion and invadopodia formation, findings which support roles for IMP3 in cell migration and invasion, leading to cancer progression.9,24 The related upstream and downstream pathways of IMP3 expression are mostly unknown. A recent study revealed that Wnt and Hedgehog (Hh) signaling pathways might be associated with IMP3 expression.23 High mobility group AT-hook 2 (HMGA2), an invasion associated oncofetal protein, was also suggested to be regulated by IMP3.9 In the future, with advancements in the understanding of IMP3-associated tumor progression and metastasis, there will be great opportunities for development of new therapeutic applications through the control of IMP3 expression.
- The overexpression of p53 has been reported in 24.5% (2-60%) of RCC and is considered as a late event in renal carcinogenesis. Unlike in other cancers, the overexpression of p53 is not attributed to mutation of p53 in RCC.19 There have been some controversies regarding the prognostic significance of p53 overexpression, but most studies have shown that patients with p53-immunopositive tumors have a greater risk of tumor recurrence and/or distant metastasis in the localized disease.17,18,19,25 Our results are contradictory to previous observations. Our study revealed that p53 overexpression was observed in 41.2% of CCRCCs and was not associated with higher tumor grade, development of distant metastasis, or poor patient survival outcomes. The differences in findings may be attributed to the antibody used, tissue processing, cut-off value of staining intensity, or patient population. Further studies are needed to clarify the significance of p53 expression as well as the causal relationship. It is worth noting that p53 overexpression was associated with IMP3 expression in our study. This association has been reported in other cancers including bile duct cancer and bladder cancer.13,14 The interrelationship between these two markers in RCC needs further clarification.
- Visapaa et al.7 and Dudderidge et al.26 reported that increased Ki-67 expression predicted a poor prognosis and was associated with higher nuclear grade in RCC. The results of the current study also support the previous findings. CCRCCs with high Ki-67 PI showed strong association with higher tumor grade, higher pT stage, and more frequent metastasis, but not with disease-specific survival. Like p53 expression, tumors with high Ki-67 PI more frequently showed IMP3 expression. This observation has been documented in other tumors like hepatocellular carcinoma, B cell lymphoma, meningioma, and bile duct carcinoma.14,27,28,29 With these findings, IMP3 is considered to be a better prognostic marker than p53 or Ki-67 and these three proteins may be closely connected.
- There are some limitations to the current study. First, the number of patients included was not sufficient to elucidate the importance of IMP3 and other markers. Second, this study does not clarify the mechanism of IMP3 expression and its role in metastasis. Third, the causal relationships of IMP3, p53, and Ki-67 with CCRCCs were not studied. A further study with a larger patient population and functional investigation is needed.
- In summary, IMP3 is an independent prognostic marker for CCRCC. Expression of this marker in localized CCRCC may help to identify patients with a high probability of developing metastasis after surgery and dying from the disease.
DISCUSSION
- 1. Eble JN, Sauter G, Epstein JI, Sesterhenn IA. Pathology and genetics of tumours of the urinary system and male genital organs. Lyon: IARC Press, 2004; 9-87.
- 2. Jiang Z, Chu PG, Woda BA, et al. Combination of quantitative IMP3 and tumor stage: a new system to predict metastasis for patients with localized renal cell carcinomas. Clin Cancer Res 2008; 14: 5579-5584. ArticlePubMedPDF
- 3. Jiang Z, Chu PG, Woda BA, et al. Analysis of RNA-binding protein IMP3 to predict metastasis and prognosis of renal-cell carcinoma: a retrospective study. Lancet Oncol 2006; 7: 556-564. ArticlePubMed
- 4. Jiang Z, Lohse CM, Chu PG, et al. Oncofetal protein IMP3: a novel molecular marker that predicts metastasis of papillary and chromophobe renal cell carcinomas. Cancer 2008; 112: 2676-2682. ArticlePubMedPMC
- 5. The Korea Central Cancer Registry, National Cancer Center. Annual report of cancer statistics in Korea in 2009. Seoul: Ministry of Health and Welfare, 2011.
- 6. Bostwick DG, Cheng L. Urologic surgical pathology. 2nd ed. St. Louis: Mosby, 2008.
- 7. Visapaa H, Bui M, Huang Y, et al. Correlation of Ki-67 and gelsolin expression to clinical outcome in renal clear cell carcinoma. Urology 2003; 61: 845-850. ArticlePubMed
- 8. Hoffmann NE, Sheinin Y, Lohse CM, et al. External validation of IMP3 expression as an independent prognostic marker for metastatic progression and death for patients with clear cell renal cell carcinoma. Cancer 2008; 112: 1471-1479. ArticlePubMedPMC
- 9. Jeng YM, Chang CC, Hu FC, et al. RNA-binding protein insulin-like growth factor II mRNA-binding protein 3 expression promotes tumor invasion and predicts early recurrence and poor prognosis in hepatocellular carcinoma. Hepatology 2008; 48: 1118-1127. ArticlePubMed
- 10. Nielsen J, Christiansen J, Lykke-Andersen J, Johnsen AH, Wewer UM, Nielsen FC. A family of insulin-like growth factor II mRNA-binding proteins represses translation in late development. Mol Cell Biol 1999; 19: 1262-1270. ArticlePubMedPMCPDF
- 11. Yaniv K, Yisraeli JK. The involvement of a conserved family of RNA binding proteins in embryonic development and carcinogenesis. Gene 2002; 287: 49-54. ArticlePubMed
- 12. Li C, Zota V, Woda BA, et al. Expression of a novel oncofetal mRNA-binding protein IMP3 in endometrial carcinomas: diagnostic significance and clinicopathologic correlations. Mod Pathol 2007; 20: 1263-1268. ArticlePubMedPDF
- 13. Li L, Xu H, Spaulding BO, et al. Expression of RNA-binding protein IMP3 (KOC) in benign urothelium and urothelial tumors. Hum Pathol 2008; 39: 1205-1211. ArticlePubMed
- 14. Riener MO, Fritzsche FR, Clavien PA, et al. IMP3 expression in lesions of the biliary tract: a marker for high-grade dysplasia and an independent prognostic factor in bile duct carcinomas. Hum Pathol 2009; 40: 1377-1383. ArticlePubMed
- 15. Yuan RH, Wang CC, Chou CC, Chang KJ, Lee PH, Jeng YM. Diffuse expression of RNA-binding protein IMP3 predicts high-stage lymph node metastasis and poor prognosis in colorectal adenocarcinoma. Ann Surg Oncol 2009; 16: 1711-1719. ArticlePubMedPDF
- 16. Song DH, Yang JW, Kim DC, et al. Insulin-like growth factor II mRNA-binding protein 3 expression in benign and premalignant lesions and carcinomas of the stomach. Korean J Pathol 2011; 45: 379-385. Article
- 17. Shvarts O, Seligson D, Lam J, et al. p53 is an independent predictor of tumor recurrence and progression after nephrectomy in patients with localized renal cell carcinoma. J Urol 2005; 173: 725-728. ArticlePubMed
- 18. Zigeuner R, Ratschek M, Rehak P, Schips L, Langner C. Value of p53 as a prognostic marker in histologic subtypes of renal cell carcinoma: a systematic analysis of primary and metastatic tumor tissue. Urology 2004; 63: 651-655. ArticlePubMed
- 19. Noon AP, Vlatković N, Polański R, et al. p53 and MDM2 in renal cell carcinoma: biomarkers for disease progression and future therapeutic targets? Cancer 2010; 116: 780-790. ArticlePubMedPMC
- 20. Escudier B, Eisen T, Stadler WM, et al. Sorafenib in advanced clear-cell renal-cell carcinoma. N Engl J Med 2007; 356: 125-134. ArticlePubMed
- 21. Bukowski RM. Prognostic factors for survival in metastatic renal cell carcinoma: update 2008. Cancer 2009; 115(10 Suppl): 2273-2281. ArticlePubMedPDF
- 22. Fisher R, Gore M, Larkin J. Current and future systemic treatments for renal cell carcinoma. Semin Cancer Biol 2013; 23: 38-45. ArticlePubMed
- 23. Noubissi FK, Goswami S, Sanek NA, et al. Wnt signaling stimulates transcriptional outcome of the Hedgehog pathway by stabilizing GLI1 mRNA. Cancer Res 2009; 69: 8572-8578. ArticlePubMedPMCPDF
- 24. Vikesaa J, Hansen TV, Jønson L, et al. RNA-binding IMPs promote cell adhesion and invadopodia formation. EMBO J 2006; 25: 1456-1468. ArticlePubMedPMC
- 25. Haitel A, Wiener HG, Baethge U, Marberger M, Susani M. mdm2 expression as a prognostic indicator in clear cell renal cell carcinoma: comparison with p53 overexpression and clinicopathological parameters. Clin Cancer Res 2000; 6: 1840-1844. PubMed
- 26. Dudderidge TJ, Stoeber K, Loddo M, et al. Mcm2, Geminin, and KI67 define proliferative state and are prognostic markers in renal cell carcinoma. Clin Cancer Res 2005; 11: 2510-2517. ArticlePubMedPDF
- 27. Hao S, Smith TW, Chu PG, et al. The oncofetal protein IMP3: a novel molecular marker to predict aggressive meningioma. Arch Pathol Lab Med 2011; 135: 1032-1036. ArticlePubMedPDF
- 28. Chen LT, Lin LJ, Zheng LL. The correlation between insulin-like growth factor II mRNA binding protein 3 expression in hepatocellular carcinoma and prognosis. Hepatogastroenterology 2013; 60: 553-556. PubMed
- 29. Hartmann EM, Beà S, Navarro A, et al. Increased tumor cell proliferation in mantle cell lymphoma is associated with elevated insulin-like growth factor 2 mRNA-binding protein 3 expression. Mod Pathol 2012; 25: 1227-1235. ArticlePubMedPDF
REFERENCES


Figure & Data
References
Citations
- IMP3 Immunohistochemical Expression Is Related with Progression and Metastases in Xenografted and Cutaneous Melanomas
Natividad Martin-Morales, Miguel Padial-Molina, Isabel Tovar, Virginea De Araujo Farias, Pedro Hernández-Cortés, Esperanza Ramirez-Moreno, Mercedes Caba-Molina, Justin Davis, Alejandro Carrero Castaño, Jose Mariano Ruiz de Almodovar, Pablo Galindo-Moreno,
Pathobiology.2024; 91(2): 132. CrossRef - circRARS synergises with IGF2BP3 to regulate RNA methylation recognition to promote tumour progression in renal cell carcinoma
Yuenan Liu, Kailei Chen, Yi Shou, Sen Li, Jun Wang, Qingyang Zhang, Ziwei Huang, Jiaju Xu, Mingfeng Li, Di Liu, Huageng Liang, Hongmei Yang, Xiaoping Zhang
Clinical and Translational Medicine.2023;[Epub] CrossRef - Prognostic value of insulin‑like growth factor 2 mRNA‑binding protein 3 and vascular endothelial growth factor‑A in patients with primary non‑small‑cell lung cancer
Jiannan Liu, Ying Liu, Wenjing Gong, Xiangshuo Kong, Congcong Wang, Shuhua Wang, Aina Liu
Oncology Letters.2019;[Epub] CrossRef - Epithelial‑mesenchymal transition in colorectal carcinoma cells is mediated by DEK/IMP3
Shuping You, Yun Guan, Weihong Li
Molecular Medicine Reports.2017;[Epub] CrossRef
 PubReader
 ePub Link
-
 Cite this Article
- Cite this Article
-
- Close
- Download Citation
- Close
- Figure
-
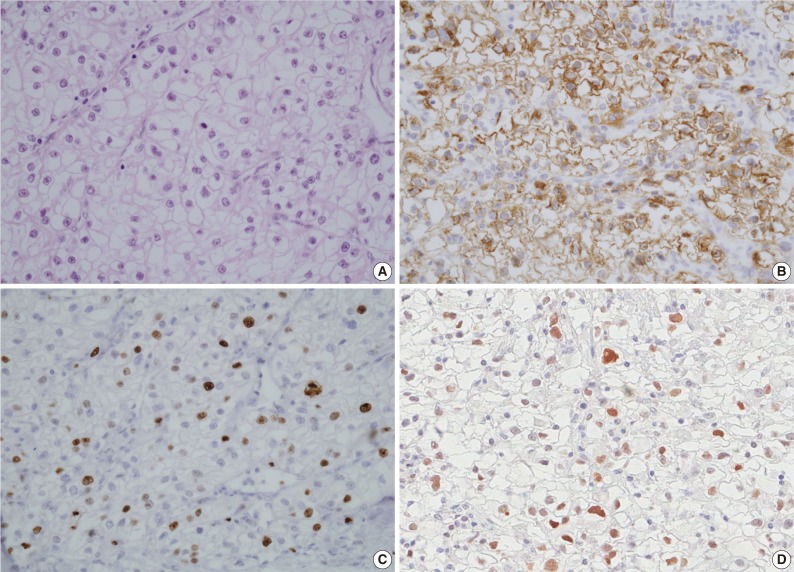
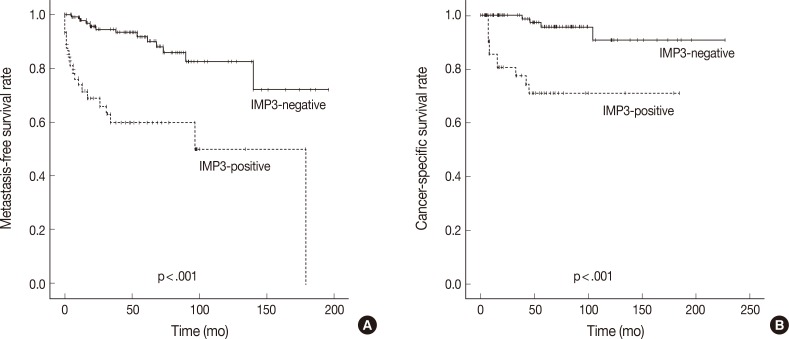
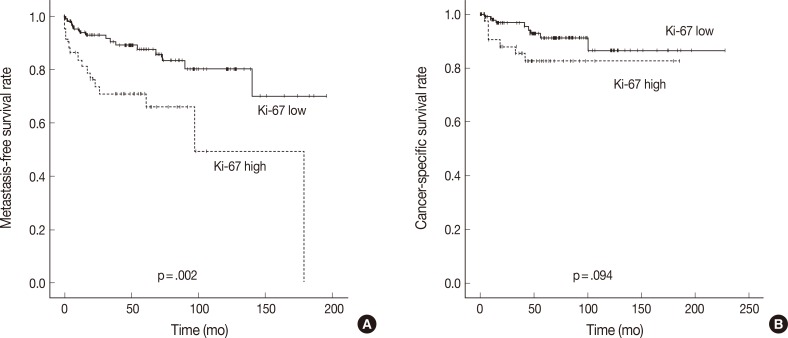
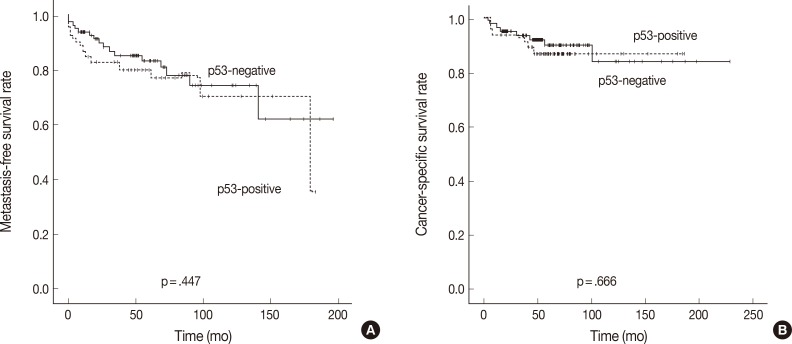


Fig. 1
Fig. 2
Fig. 3
Fig. 4
| Feature | IMP3 expression |
p-value | |
|---|---|---|---|
| Negative (n = 105) | Positive (n = 43) | ||
| Age (yr) | 55.9± 11.7 (19-82) | 56.9± 11.6 (26-76) | .648 |
| Size (cm) | 5.2 ± 2.2 (2-11) | 6.6 ± 2.8 (1.0-14.0) | .001 |
| Sex | .158 | ||
| Male | 73 (69.5) | 35 (81.4) | |
| Female | 32 (30.5) | 8 (18.6) | |
| pT stage | .001 | ||
| pT1 | 74 (70.5) | 20 (46.5) | |
| pT2 | 20 (19.0) | 7 (16.3) | |
| pT3 | 11 (10.5) | 15 (34.9) | |
| pT4 | 0 (0) | 1 (2.3) | |
| Nuclear grade | <.001 | ||
| 1 | 2 (1.9) | 0 (0) | |
| 2 | 35 (33.3) | 2 (4.7) | |
| 3 | 68 (64.8) | 31 (72.1) | |
| 4 | 0 (0) | 10 (23.3) | |
| Sarcomatoid change | <.001 | ||
| Absent | 105 (100) | 37 (0) | |
| Present | 0 (0) | 6 (100) | |
| Distant metastasis | <.001 | ||
| Absent | 93 (88.6) | 25 (58.1) | |
| Present | 12 (11.4) | 18 (41.9) | |
| Outcome | <.001 | ||
| Alive | 101 (96.2) | 32 (74.4) | |
| Died of disease | 4 (3.8) | 11 (25.6) | |
| Feature | n | p53 positive (n=61) |
Ki-67 high (n = 44) |
||
|---|---|---|---|---|---|
| n (%) | p-value | n (%) | p-value | ||
| Sex | .092 | .242 | |||
| Male | 108 | 49 (69.5) | 35 (79.5) | ||
| Female | 40 | 12 (30.5) | 9 (20.5) | ||
| pT stage | .966 | <.001 | |||
| pT1 | 94 | 40 (65.8) | 21 (47.7) | ||
| pT2 | 27 | 9 (14.8) | 7 (15.9) | ||
| pT3 | 26 | 11 (18.0) | 15 (34.1) | ||
| pT4 | 1 | 1 (1.6) | 1 (2.3) | ||
| Nuclear grade | .605 | <.001 | |||
| 1 | 2 | 1 (1.6) | 0 (0) | ||
| 2 | 37 | 15 (24.6) | 4 (9.1) | ||
| 3 | 99 | 39 (63.9) | 33 (75.0) | ||
| 4 | 10 | 6 (9.8) | 7 (15.9) | ||
| Sarcomatoid change | .23 | .009 | |||
| Absent | 142 | 57 (93.4) | 39 (88.6) | ||
| Present | 6 | 4 (6.6) | 5 (11.4) | ||
| Distant metastasis | .497 | .007 | |||
| Absent | 118 | 47 (77.0) | 29 (65.9) | ||
| Present | 30 | 14 (23.0) | 15 (34.1) | ||
| Outcome | .651 | .130 | |||
| Survival | 133 | 54 (88.5) | 37 (84.1) | ||
| Died of disease | 15 | 7 (11.5) | 7 (15.9) | ||
| Feature | Tumor IMP3 expression |
p-value | |
|---|---|---|---|
| Negative (n = 105) | Positive (n=43) | ||
| p53 | <.001 | ||
| Negative | 72 (68.6) | 15 (34.9) | |
| Positive | 33 (31.4) | 28 (65.1) | |
| Ki-67 PI | <.001 | ||
| Low (<10%) | 87 (82.9) | 17 (39.5) | |
| High (≥ 10%) | 18 (17.1) | 26 (60.5) | |
| Feature | Metastasis |
Died of disease |
||||
|---|---|---|---|---|---|---|
| Absent (n = 118) | Present (n=30) | p-value | Absent (n = 133) | Present (n = 15) | p-value | |
| Age (yr) | 55.4±11.7 | 59.3±13.1 | .100 | 56.1±11.7 | 57.5±11.2 | .663 |
| Size (cm) | 5.3±2.4 | 6.8±2.6 | .002 | 5.5±2.4 | 6. 9±3.0 | .034 |
| Sex | .332 | .357 | ||||
| Male | 84 (71.2) | 24 (80.0) | 95 (71.4) | 13 (86.7) | ||
| Female | 34 (28.8) | 6 (20.0) | 38 (28.6) | 2 (13.3) | ||
| pT stage | <.001 | <.001 | ||||
| pT1 | 82 (69.5) | 12 (40.0) | 88 (69.5) | 6 (40.0) | ||
| pT2 | 24 (20.3) | 3 (10.0) | 27 (20.3) | 0 (0.0) | ||
| pT3 | 12 (10.2) | 14 (46.7) | 18 (10.2) | 8 (53.3) | ||
| pT4 | 0 (0) | 1 (3.3) | 0 (0) | 1 (6.7) | ||
| Nuclear grade | <.001 | <.001 | ||||
| 1 | 2 (1.7) | 0 (0) | 2 (1.5) | 0 (0) | ||
| 2 | 36 (30.5) | 1 (3.3) | 36 (27.1) | 1 (6.7) | ||
| 3 | 78 (66.1) | 21 (70.0) | 91 (68.4) | 8 (53.3) | ||
| 4 | 2 (1.7) | 8 (26.7) | 4 (3.0) | 6 (40.0) | ||
| Sarcomatoid change | .001 | <.001 | ||||
| Absent | 117 (99.1) | 25 (83.3) | 132 (99.2) | 10 (66.6) | ||
| Present | 1 (0.9) | 5 (16.7) | 1 (0.8) | 5 (33.4) | ||
| IMP3 | <.001 | <.001 | ||||
| Negative | 93 (78.8) | 12 (40.0) | 101 (71.2) | 4 (26.7) | ||
| Positive | 25 (21.2) | 18 (60.0) | 32 (28.8) | 11(73.3) | ||
| p53 | .497 | .651 | ||||
| Negative | 71 (60.2) | 16 (53.3) | 79 (59.4) | 8 (53.3) | ||
| Positive | 47 (39.8) | 14 (46.7) | 54 (40.6) | 7 (46.7) | ||
| Ki-67 PI | .007 | .130 | ||||
| Low (<10%) | 89 (75.4) | 15 (50.0) | 96 (72.2) | 8 (53.3) | ||
| High (> 10%) | 29 (24.6) | 15 (50.0) | 37 (27.8) | 7 (46.7) | ||
Values are presented as mean±standard deviation (range) or number of patients (%). The bold values indicate a statistically significant difference (p<.05). IMP3, insulin-like growth factor II mRNA-binding protein 3.
Values are presented as number of patients (%). The bold values indicate a statistically significant difference (p<0.05).
Values are presented as number of patients (%). The bold values indicate a statistically significant difference (p<.05). IMP3, insulin-like growth factor II mRNA-binding protein 3; PI, proliferating index.
Values are presented as mean±standard deviation or number of patients (%). The bold values indicate a statistically significant difference (p<.05). IMP3, insulin-like growth factor II mRNA-binding protein 3; PI, proliferating index.

