
 E-submission

Articles
- Page Path
- HOME > J Pathol Transl Med > Forthcoming articles > Article
-
Original Article
Utility of LymphoTrack for clonality testing in formalinfixed, paraffin-embedded tissue: integrated panel- and specimen-level comparison with fragment analysis -
Ki-Chang Lee1
 , Hyun-A Kim2, Jiwon Koh1,3, Jeong Mo Bae1, Cheol Lee1, Seung Geun Song1, Yoon Kyung Jeon1,3
-
DOI: https://doi.org/10.4132/jptm.2026.10.02
Published online: November 13, 2026
1Department of Pathology, Seoul National University Hospital, Seoul, Korea
2Field Application Specialist Team, Dow Biomedica Inc., Seoul, Korea
3Cancer Research Institute, Seoul National University, Seoul, Korea
-
Corresponding Authors Seung Geun Song, MD Department of Pathology, Seoul National University Hospital, 101 Daehak-ro, Jongno-gu, Seoul 03080, Korea Tel: +82-2-2072-0816, E-mail: sgsong.path@gmail.com
Yoon Kyung Jeon, MD, PhD Department of Pathology, Seoul National University Hospital, Seoul National University College of Medicine, 103 Daehak-ro, Jongno-gu, Seoul 03080, Korea Tel: +82-2-740-8323, Fax: +82-2-743-5530, E-mail: ykjeon@snu.ac.kr
© The Korean Society of Pathologists/The Korean Society for Cytopathology
This is an Open Access article distributed under the terms of the Creative Commons Attribution Non-Commercial License (https://creativecommons.org/licenses/by-nc/4.0) which permits unrestricted non-commercial use, distribution, and reproduction in any medium, provided the original work is properly cited.
- 68 Views
- 2 Download


Abstract
-
Background
- Next-generation sequencing–based clonality assays provide sequence-level resolution but remain vulnerable to panel-specific failure in formalin-fixed, paraffin-embedded (FFPE) tissue. We evaluated LymphoTrack performance and integrated multi-panel interpretation.
-
Methods
- Seventeen FFPE specimens from 16 patients underwent 51 immunoglobulin heavy-chain (IGH) and 12 T-cell receptor (TCR) panel runs. Results were classified as Positive, Negative, or Fail and compared with lineage-level fragment-analysis interpretations. Panels targeting each lineage were integrated into specimen-level interpretations. Quality-control metrics associated with panel failure were explored.
-
Results
- Among 51 IGH panel runs, 37 (72.5%) were concordant, four (7.8%) discordant, and 10 (19.6%) Fail; all Fail results occurred in FR1 or FR2. IGH specimen-level agreement was 16/17 (94.1%; 95% confidence interval [CI], 73.0% to 99.0%). LymphoTrack classified four IGH specimens as monoclonal and 13 as polyclonal, including six based on incomplete panel coverage. One such specimen (FR1/FR2 Fail and FR3 Negative) was discordant with monoclonal fragment analysis. TCR specimen-level agreement was 5/6 (83.3%; 95% CI, 43.6% to 97.0%). In the discordant TCR specimen, T-cell receptor gamma (TRG) fragment analysis was oligoclonal, whereas both LymphoTrack TRG and T-cell receptor beta were Positive. A post–polymerase chain reaction library concentration threshold of ≤4.5 ng/µL identified all Fail panels but had limited specificity (58.5%) and precision (31.3%).
-
Conclusions
- LymphoTrack showed high specimen-level agreement with fragment analysis despite panel-specific technical vulnerability in FFPE tissue. Partial panel failure had asymmetric implications: a Positive panel preserved a monoclonal interpretation, whereas polyclonal results with incomplete panel coverage remained vulnerable to discordance. Reporting incomplete panel coverage may help communicate this limitation.
- Analysis of immunoglobulin (IG) and T-cell receptor (TCR) gene rearrangements is an established adjunct in the diagnostic evaluation of suspected lymphoproliferative disorders, particularly when histologic and immunophenotypic findings are inconclusive. Standardized multiplex polymerase chain reaction (PCR) protocols developed by the BIOMED-2 consortium have enabled routine assessment of B- and T-cell clonality using fragment analysis of IG and TCR rearrangements [1]. The subsequent EuroClonality guidelines emphasized integrating results across the available IG or TCR targets when deriving the overall molecular clonality conclusion [2].
- Conventional fragment analysis infers clonality from the size distribution of amplified products but does not directly identify their rearranged nucleotide sequences [3]. This limitation may complicate the interpretation of specimens showing multiple significant peaks, oligoclonal patterns, or low-level dominant products within a polyclonal background. Formalin-fixed, paraffin-embedded (FFPE) tissue poses an additional technical challenge because formalin fixation and tissue processing compromise nucleic-acid integrity, thereby reducing the availability of intact templates for PCR amplification [4]. Longer amplification targets are particularly vulnerable to degraded DNA, an important consideration in immunoglobulin heavy-chain (IGH) clonality testing because the FR1, FR2, and FR3 assays target framework regions that differ in amplicon length [2]. Using multiple complementary IG targets improves the detection of clonal B-cell populations [2,5]. However, individual targets may fail or yield discrepant results, complicating the overall interpretation of a specimen [6].
- Next-generation sequencing (NGS)–based clonality assays identify rearranged clonotype sequences and quantify their relative read frequencies, providing sequence-level resolution beyond fragment analysis. Sequence-resolved results may help distinguish dominant clonotypes within complex peak patterns and permit comparison of clonotypes between different specimens. Clinical studies have demonstrated the feasibility and diagnostic utility of NGS-based T-cell receptor gamma (TRG) clonality testing, including in FFPE specimens, and a recent phase 3 study of LymphoTrack TRG showed high diagnostic accuracy [3,7-9]. For B-cell clonality assessment, both commercial LymphoTrack IGH assays and multicenter EuroClonality-NGS studies have shown high concordance with conventional clonality testing [6,10,11]. More recent EuroClonality-NGS recommendations emphasize structured assessment of individual IG targets followed by integration into an overall molecular clonality conclusion [12]. However, the relative technical performance of the LymphoTrack IGH FR1, FR2, and FR3 panels in FFPE tissue and the asymmetric consequences of partial panel failure for monoclonal versus polyclonal specimen-level interpretation remain incompletely characterized.
- In this study, we evaluated LymphoTrack clonality testing in archived diagnostic FFPE specimens using conventional fragment analysis as the clinical comparator. We assessed individual panel-level outcomes across the IGH FR1, FR2, FR3, T-cell receptor beta (TRB), and TRG panels, as well as lineage-specific specimen-level agreement. We also evaluated how partial panel failure affected integrated specimen-level interpretation, particularly whether its consequences differed between monoclonal and polyclonal results. As a secondary exploratory objective, we examined routinely recorded preanalytical, library, and sequencing quality-control metrics as potential indicators of panel failure.
INTRODUCTION
- Study design and specimen selection
- This retrospective study included diagnostically challenging FFPE tissue specimens evaluated for suspected B- or T-cell lymphoproliferative disorders at Seoul National University Hospital. Cases were selected from specimens that had undergone conventional fragment analysis as part of routine diagnostic evaluation, and archived FFPE tissue was subsequently subjected to LymphoTrack testing for comparative analysis.
- The final study cohort comprised 17 distinct FFPE specimens from 16 patients. All 17 specimens underwent IGH testing, and six specimens also underwent TCR testing. The analysis therefore included 17 IGH and six TCR lineage-specific specimen-level interpretations, derived from 63 individual LymphoTrack panel runs.
- An individual panel was defined as one target-specific LymphoTrack reaction. The IGH panels comprised FR1, FR2, and FR3, whereas the TCR panels comprised TRB and TRG. For each specimen, results from all panels targeting the same antigen-receptor lineage were integrated to generate one final lineage-specific specimen-level interpretation. Thus, each specimen contributed one IGH specimen-level interpretation and, when TCR testing was performed, one additional TCR specimen-level interpretation.
- If a specimen-panel combination was tested more than once during assay evaluation, only the final run used for laboratory interpretation was included in the primary analysis. Earlier or alternative repeat runs were excluded to avoid counting multiple technical runs from the same specimen-panel combination as independent observations.
- Clinicopathologic information, including specimen site and final diagnosis, was obtained from pathology reports and electronic medical records and reviewed by pathologists.
- DNA extraction and quality assessment
- Genomic DNA was extracted from unstained FFPE tissue sections using the Maxwell CSC DNA FFPE Kit on a Maxwell CSC Instrument (Promega, Madison, WI, USA) according to the manufacturer’s instructions.
- DNA concentration was measured using a Quantus Fluorometer (Promega). DNA integrity was assessed using the Genomic DNA ScreenTape assay on an Agilent 4200 TapeStation (Agilent Technologies, Santa Clara, CA, USA) and recorded as the DNA integrity number (DIN). An intended DNA input of 200 ng was used for each LymphoTrack panel reaction.
- The recorded preanalytical, library, and sequencing quality-control variables included the A260/A280 ratio, DIN, input DNA amount, post-PCR library concentration, maximum library peak size, total sequencing reads, index Q30, and the percentage of total reads assigned to each library.
- Conventional fragment analysis
- Conventional fragment analysis served as the comparator method. IGH rearrangement testing was performed using the IdentiClone IGH Gene Clonality Assay (Invivoscribe Technologies, San Diego, CA, USA) according to the manufacturer’s instructions. Five IGH reactions (IGH-A through IGH-E) were analyzed by capillary electrophoresis on a 3730xl DNA Analyzer (Applied Biosystems, Foster City, CA, USA), and electropherograms were analyzed using GeneMapper Software 6 (Applied Biosystems). The final IGH fragment-analysis result was classified as monoclonal or polyclonal according to the manufacturer’s guidelines.
- For TCR clonality assessment, fragment analysis was performed using the IdentiClone TRG Gene Clonality Assay (Invivoscribe Technologies) according to the manufacturer’s instructions, followed by capillary electrophoresis on a 3730xl DNA Analyzer (Applied Biosystems). Electropherograms were analyzed using GeneMapper Software 6 (Applied Biosystems). TRG fragment-analysis results were categorized as monoclonal, polyclonal, or oligoclonal.
- Fragment-analysis results represented the final lineage-level laboratory interpretation for each specimen. For the TCR comparison, the conventional comparator was therefore limited to TRG fragment analysis, whereas the LymphoTrack specimen-level interpretation integrated both TRB and TRG results. Because the fragment-analysis and LymphoTrack assays used different primer sets and did not interrogate identical targets, fragment-analysis results were used as the comparator for the integrated IGH or TCR specimen-level interpretation rather than as one-to-one reference results for individual LymphoTrack panels.
- LymphoTrack assay and sequencing
- NGS-based clonality testing was performed using the LymphoTrack Dx IGH FR1, IGH FR2, IGH FR3, TRB, and TRG assays (Invivoscribe Technologies) according to the manufacturer’s instructions.
- Target-specific libraries were generated by PCR amplification, followed by purification of the PCR products using AMPure XP beads (Beckman Coulter, Brea, CA, USA). The resulting libraries were quantified, pooled, and sequenced on a MiSeqDx system (Illumina, San Diego, CA, USA). Positive and negative control materials were included in each sequencing run in accordance with the manufacturer’s instructions. Sequence data were analyzed using LymphoTrack Dx MiSeq Data Analysis software version 2.4.3 (Invivoscribe Technologies). Clonotype abundance was assessed from the software-generated merged read summary.
- For each panel, the initial software output, merged clonotype read distribution, total read count, percentage of total reads, and sequencing quality metrics were reviewed. Panel results were standardized as Positive, Negative, or Fail. Manufacturer-guided interpretation considered both total sequencing depth and the relative abundance of dominant merged sequences. For panels generating 10,000 to <20,000 total reads, a dominant merged sequence representing at least 5% of total reads was used as a reference criterion for clonality, whereas a threshold of 2.5% was used for panels generating ≥20,000 total reads. The relative predominance of the top-ranked sequence over background clonotypes was also considered. A Positive result indicated a dominant clonotype meeting the overall interpretive criteria, whereas a Negative result indicated an interpretable polyclonal profile without a qualifying dominant clonotype.
- A panel was classified as Fail when a technically interpretable clonality result could not be issued. This category included both library-generation failure and sequencing output considered insufficient for reliable interpretation. Manufacturer-guided thresholds were used as general references rather than as absolute automated decision rules. Panel interpretability was determined by review of the total read count, sequencing quality, and separation of dominant clonotypes from the background repertoire. A total read count of 10,000 was used as a general reference for interpretability rather than as a strict exclusion threshold. Panels below this reference could still be considered interpretable when the clonotype distribution showed unequivocal dominance and sequencing quality was otherwise considered adequate. Accordingly, a nominal Negative software output was not accepted as a final Negative result when the total read count was considered insufficient for diagnostic interpretation. In the final dataset, Fail status was assigned according to the final laboratory interpretation rather than the unreviewed software output alone.
- Panel-level and lineage-specific specimen-level interpretation
- Panel-level outcomes were assessed by comparing each standardized LymphoTrack panel result with the final fragment-analysis interpretation for the corresponding specimen and lineage. A LymphoTrack Positive result paired with a monoclonal fragment-analysis result, or a LymphoTrack Negative result paired with a polyclonal fragment-analysis result, was classified as concordant. Other informative combinations were classified as discordant. LymphoTrack Fail results were analyzed as a separate technical outcome and were not classified as either concordant or discordant.
- The primary endpoint was lineage-specific specimen-level agreement between LymphoTrack and fragment analysis. For each specimen, all available panels targeting the same lineage were integrated to generate the final LymphoTrack interpretation [2]. An IGH specimen-level result was classified as monoclonal when at least one of the FR1, FR2, or FR3 panels was Positive. A TCR specimen-level result was classified as monoclonal when either the TRB or TRG panel was Positive. When no panel was Positive, the specimen-level result was classified as polyclonal if at least one panel yielded an interpretable Negative result. If all panels targeting a given lineage were classified as Fail, the specimen-level result was considered non-evaluable.
- For IGH testing, polyclonal interpretations were further described according to panel coverage. Complete panel coverage was defined as interpretable Negative results in all three IGH panels. When one or more IGH panels were classified as Fail, a polyclonal interpretation based on at least one remaining interpretable Negative panel was described as being based on incomplete panel coverage. Repeat testing or reflex analysis of additional targets such as IGK was not performed for these specimens.
- Within-specimen combinations of Positive, Negative, and Fail results were summarized to assess how informative panels contributed to the final lineage-specific interpretation when another panel failed or yielded a discrepant result.
- Exploratory quality-control analysis
- A post hoc exploratory analysis was performed to examine whether routinely recorded preanalytical, library, and sequencing quality-control metrics were associated with the final panel-level Fail classification. Candidate variables included the A260/A280 ratio, TapeStation DIN, input DNA amount, post-PCR library concentration, maximum library peak size, total sequencing reads, index Q30, and percentage of total reads assigned to each library.
- Individual panel runs were categorized as Fail or non-Fail according to the final laboratory interpretation. Candidate thresholds were explored empirically within the study dataset. The performance of selected single-metric and two-metric warning rules was summarized using recall, specificity, precision, balanced accuracy, and F1-score. Recall (sensitivity) was defined as the proportion of Fail panels identified by a warning rule, whereas precision (positive predictive value) was the proportion of flagged panels that were ultimately classified as Fail. Specificity was the proportion of non-Fail panels that were not flagged. Balanced accuracy was calculated as the mean of recall and specificity, and the F1-score as the harmonic mean of recall and precision. Details of the threshold-selection procedure are provided in Supplementary Table S1. Because thresholds were selected and evaluated in the same cohort without internal or external validation, the analysis was considered descriptive and hypothesis-generating. No confidence intervals or inferential comparisons were calculated for these performance metrics.
- Statistical analysis
- Categorical variables were summarized as counts and percentages. Panel-level outcomes were reported separately for the FR1, FR2, FR3, TRB, and TRG targets. Agreement between LymphoTrack and fragment analysis was evaluated at two levels: the individual panel level and the lineage-specific specimen level.
- Wilson 95% confidence intervals were calculated for lineage-specific specimen-level agreement proportions. Because multiple panels were performed on the same specimen, the 63 panel-level observations were not considered statistically independent. Panel-level analyses were therefore descriptive, and no inferential comparison assuming independence among individual panel runs was performed.
- Data processing and statistical analyses were performed using Python ver. 3.13.5, pandas ver. 2.2.3, and statsmodels ver. 0.14.6. Data visualization was performed using matplotlib ver. 3.10.8.
- Figure preparation
- Figs. 1 and 2 and Supplementary Fig. S1 were prepared with the assistance of FigureLabs (https://www.figurelabs.ai/), an AI-assisted scientific illustration tool used for figure layout and graphical presentation. All underlying data, scientific content, labels, and interpretations were provided by the authors, and the resulting figures were manually reviewed, edited, and verified for scientific accuracy.
MATERIALS AND METHODS
- Study cohort and panel structure
- The final study cohort comprised 17 distinct FFPE specimens from 16 patients. All 17 specimens underwent IGH clonality testing, and six also underwent TCR clonality testing, yielding 17 IGH and six TCR lineage-specific specimen-level interpretations from 63 individual LymphoTrack panel runs.
- The IGH analysis comprised 51 panel runs, with 17 runs each for FR1, FR2, and FR3. The TCR analysis comprised 12 panel runs, with six runs each for TRB and TRG. Study structure and lineage-specific specimen-level agreement are summarized in Tables 1 and 2, and detailed clinicopathologic characteristics are provided in Supplementary Table S2.
- Panel-level outcomes
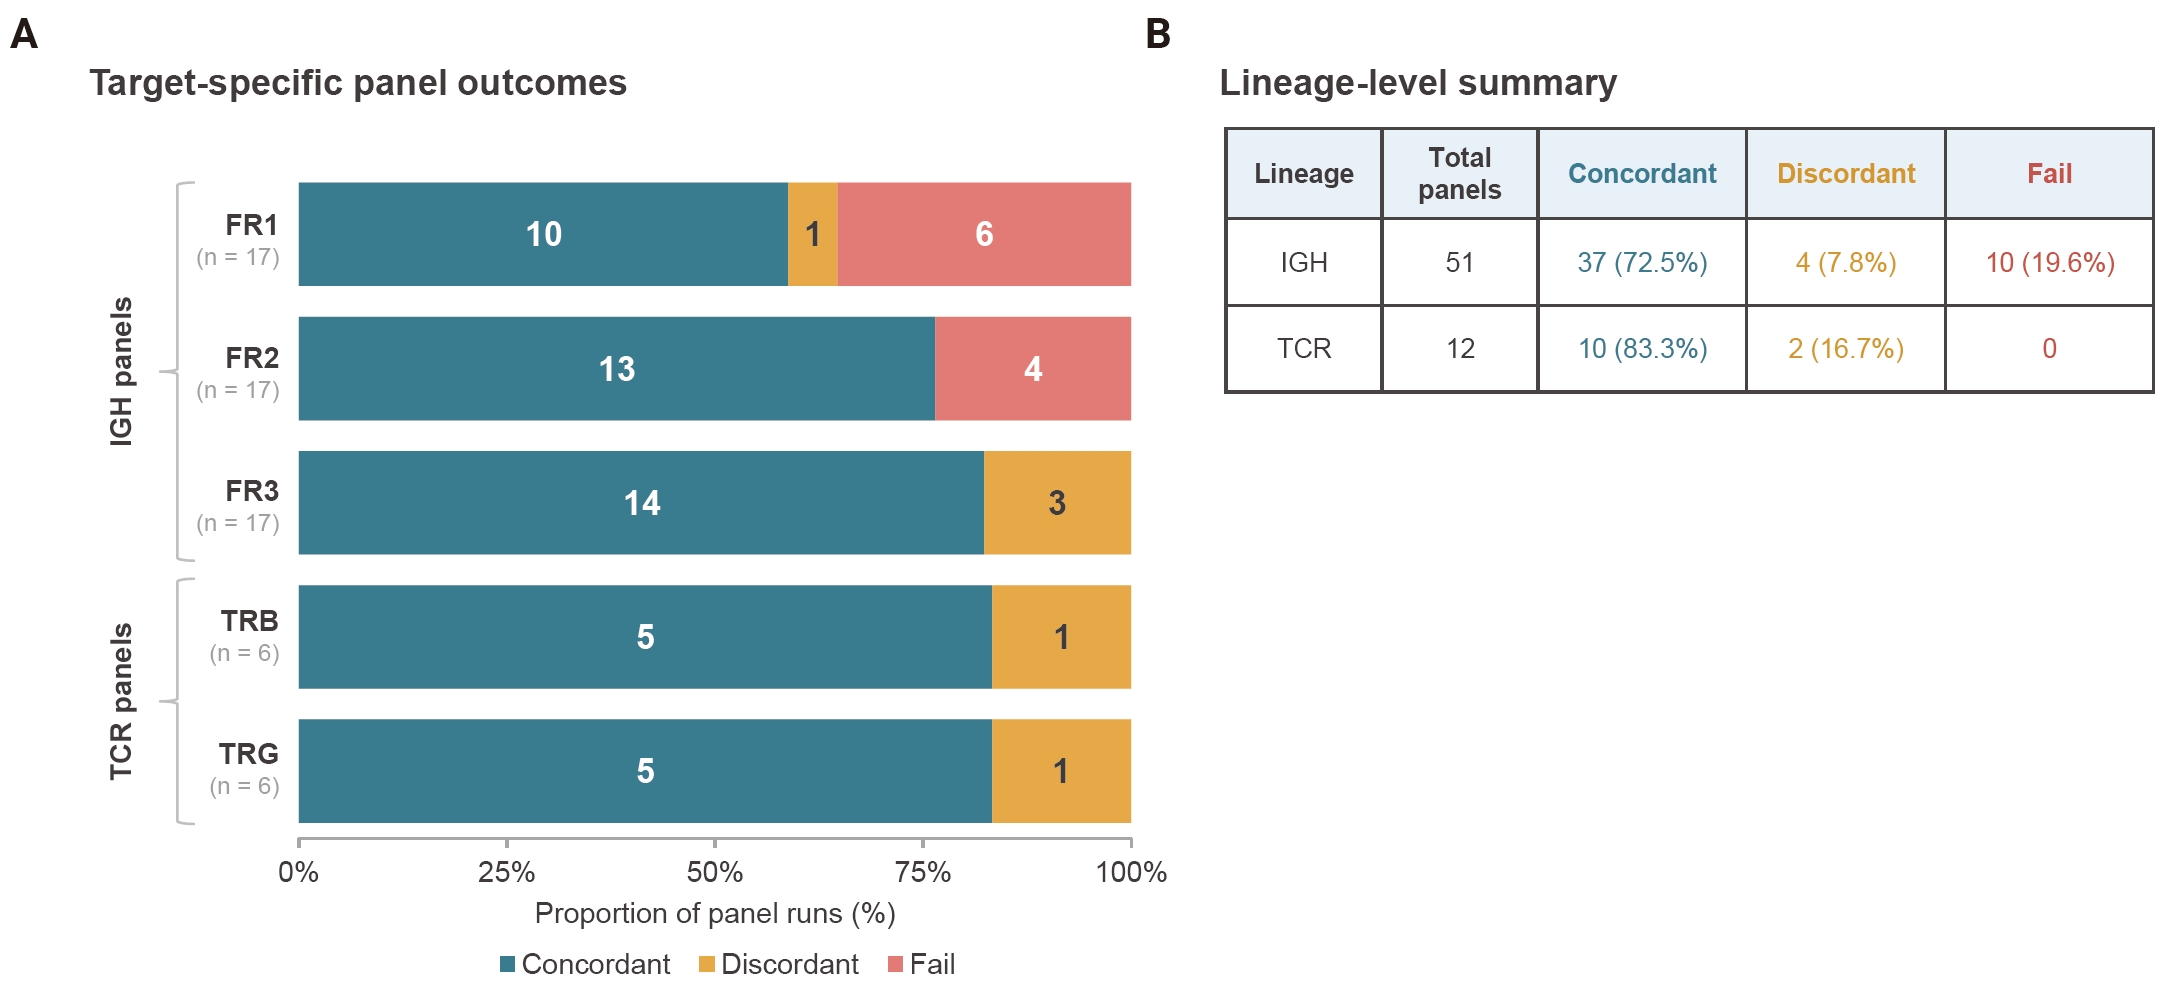
- Among the 51 IGH panel runs, 37 (72.5%) were concordant with the corresponding specimen-level fragment-analysis interpretation, four (7.8%) were discordant, and 10 (19.6%) were classified as Fail. All 10 Fail results occurred in FR1 or FR2, whereas no Fail results were observed in FR3. Detailed target-specific distributions are shown in Fig. 1A.
- Among the 12 TCR panel runs, 10 (83.3%) were concordant and two (16.7%) were discordant, with no Fail results. Five of six TRB runs and five of six TRG runs were concordant. The discordant TRB and TRG results arose from the same specimen. Overall IGH and TCR panel-level outcomes are summarized in Fig. 1B.
- Lineage-specific specimen-level agreement
- At the lineage-specific specimen level, 16 of 17 IGH interpretations were concordant between LymphoTrack and fragment analysis, corresponding to an agreement of 94.1% (95% confidence interval [CI], 73.0% to 99.0%). LymphoTrack classified four IGH specimens as monoclonal and 13 as polyclonal, whereas fragment analysis classified five as monoclonal and 12 as polyclonal. The single IGH specimen-level discordance was a polyclonal LymphoTrack interpretation based on incomplete panel coverage (FR1 Fail, FR2 Fail, and FR3 Negative) versus a monoclonal fragment-analysis result.
- Five of the six TCR specimen-level interpretations were concordant, corresponding to an agreement of 83.3% (95% CI, 43.6% to 97.0%). LymphoTrack classified three TCR specimen-level results as monoclonal and three as polyclonal. Fragment analysis classified two as monoclonal, three as polyclonal, and one as oligoclonal. The single TCR specimen-level discordance corresponded to the specimen classified as oligoclonal by fragment analysis.
- Integrated IGH panel interpretation patterns
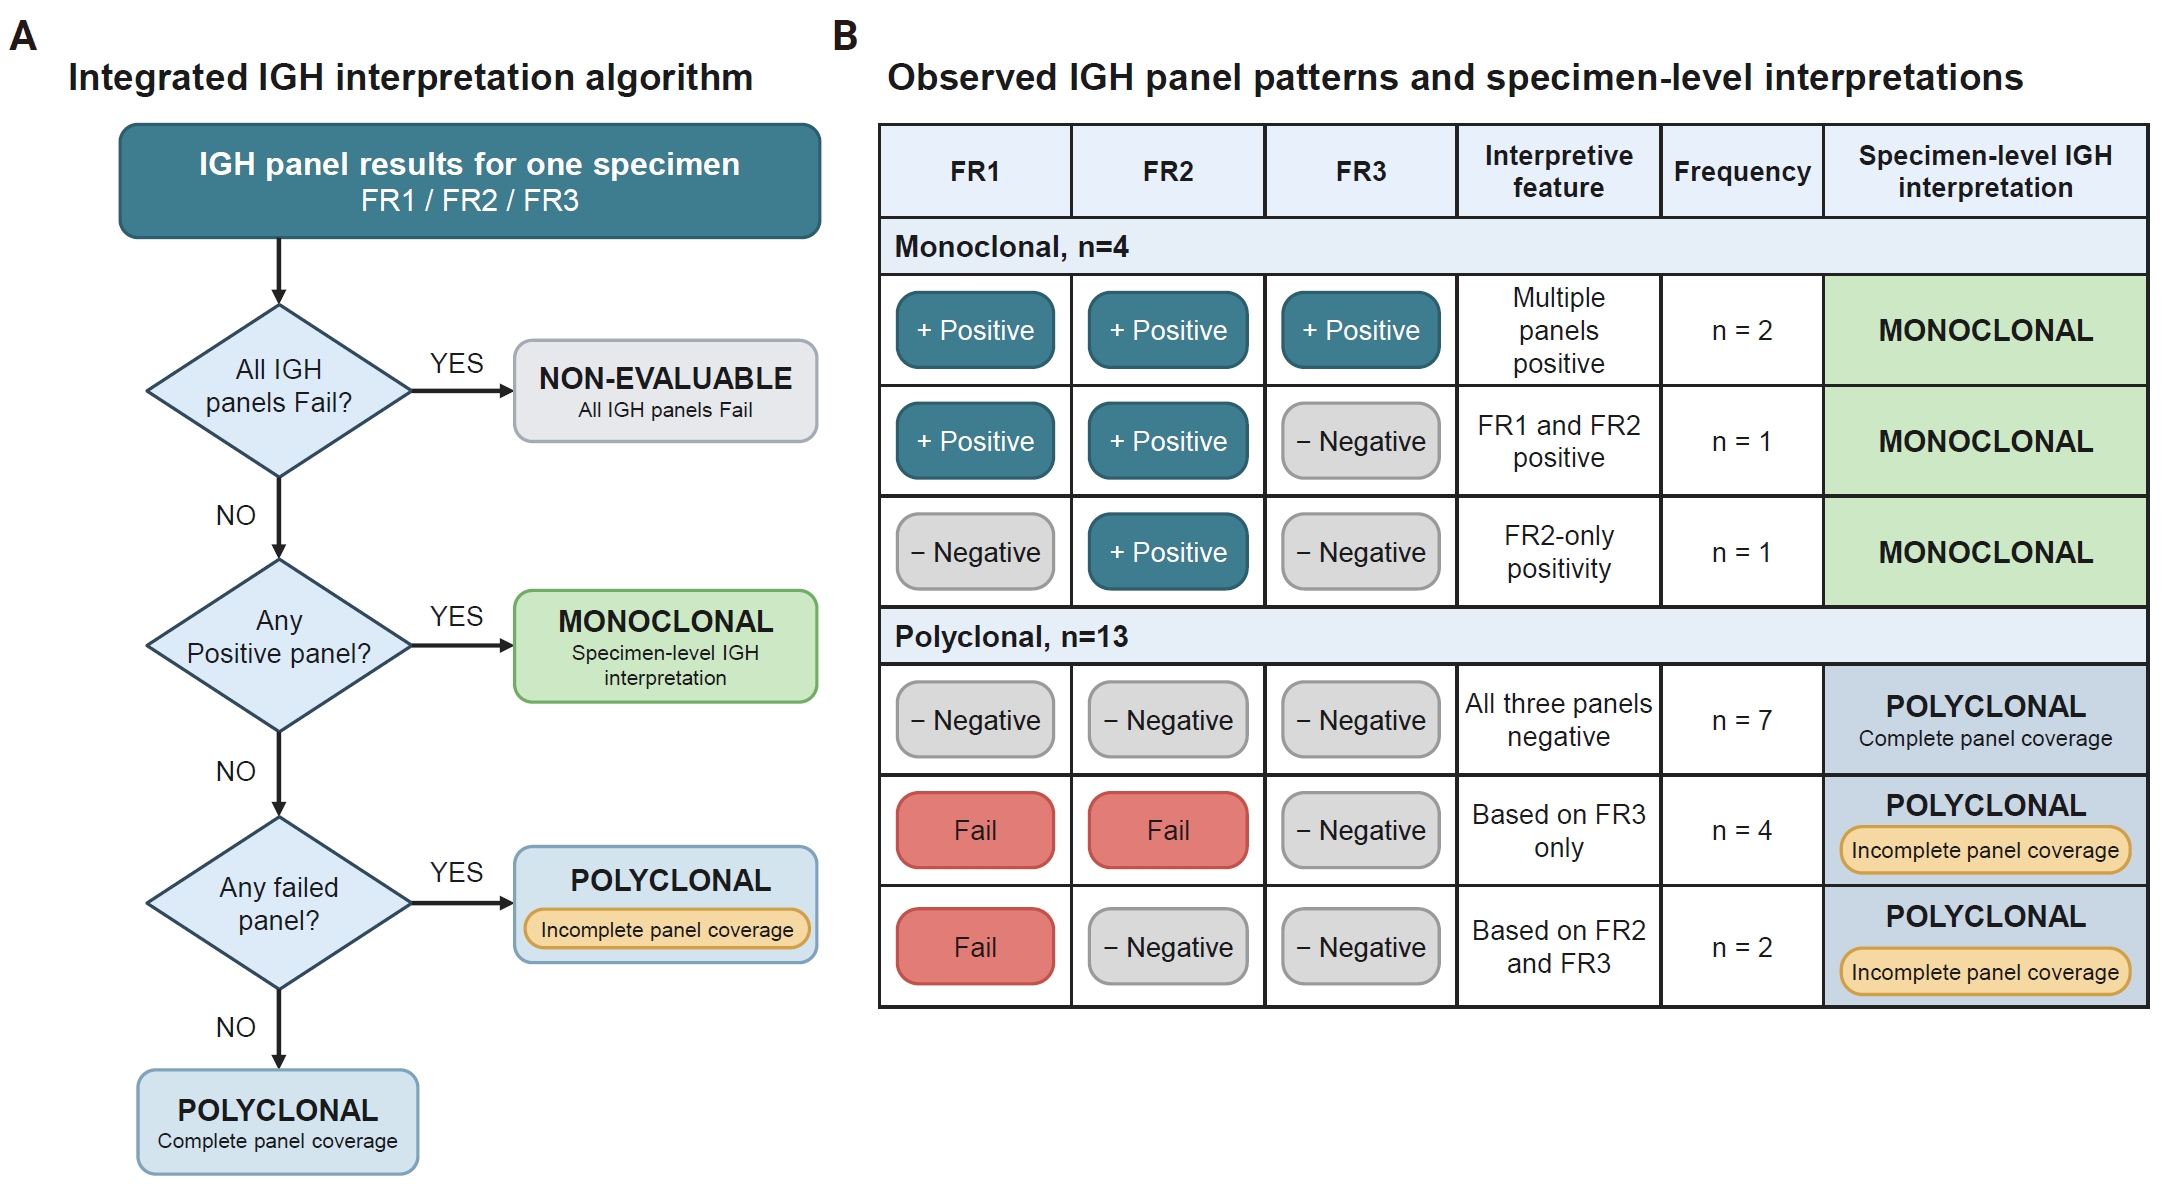
- The integrated interpretation algorithm and observed IGH panel-result patterns are summarized in Fig. 2. Among the four specimens with a monoclonal LymphoTrack IGH interpretation, three had Positive results in multiple panels and one was classified as monoclonal based on isolated FR2 positivity.
- Among the 13 specimens with a polyclonal LymphoTrack IGH interpretation, seven had complete panel coverage, with Negative results across all three panels, whereas six had incomplete panel coverage because one or more panels had failed. Five of these six interpretations were concordant with a polyclonal fragment-analysis result; the remaining specimen represented the single IGH specimen-level discordance. No specimen had all three IGH panels classified as Fail. Detailed panel-result patterns are provided in Fig. 2B and Supplementary Table S3.
- Technical characteristics of failed panels
- The 10 IGH Fail panels represented two distinct technical patterns. Seven were library-generation failures without a measurable maximum library peak. The remaining three generated measurable library peaks but yielded insufficient total sequencing reads for diagnostic interpretation. These three panels were therefore classified as Fail after laboratory review despite an initial software output of Negative.
- The low-read uninterpretable panels included FR1 and FR2 from one specimen, with total read counts of 2,904 and 7,649, respectively, and one additional FR1 panel with 15,779 total reads. The corresponding maximum library peak sizes were 448, 384, and 442 bp, respectively. Thus, the Fail category included both failure to generate an adequate library and insufficient sequencing output despite generation of a measurable library product.
- Representative discordant TCR specimen
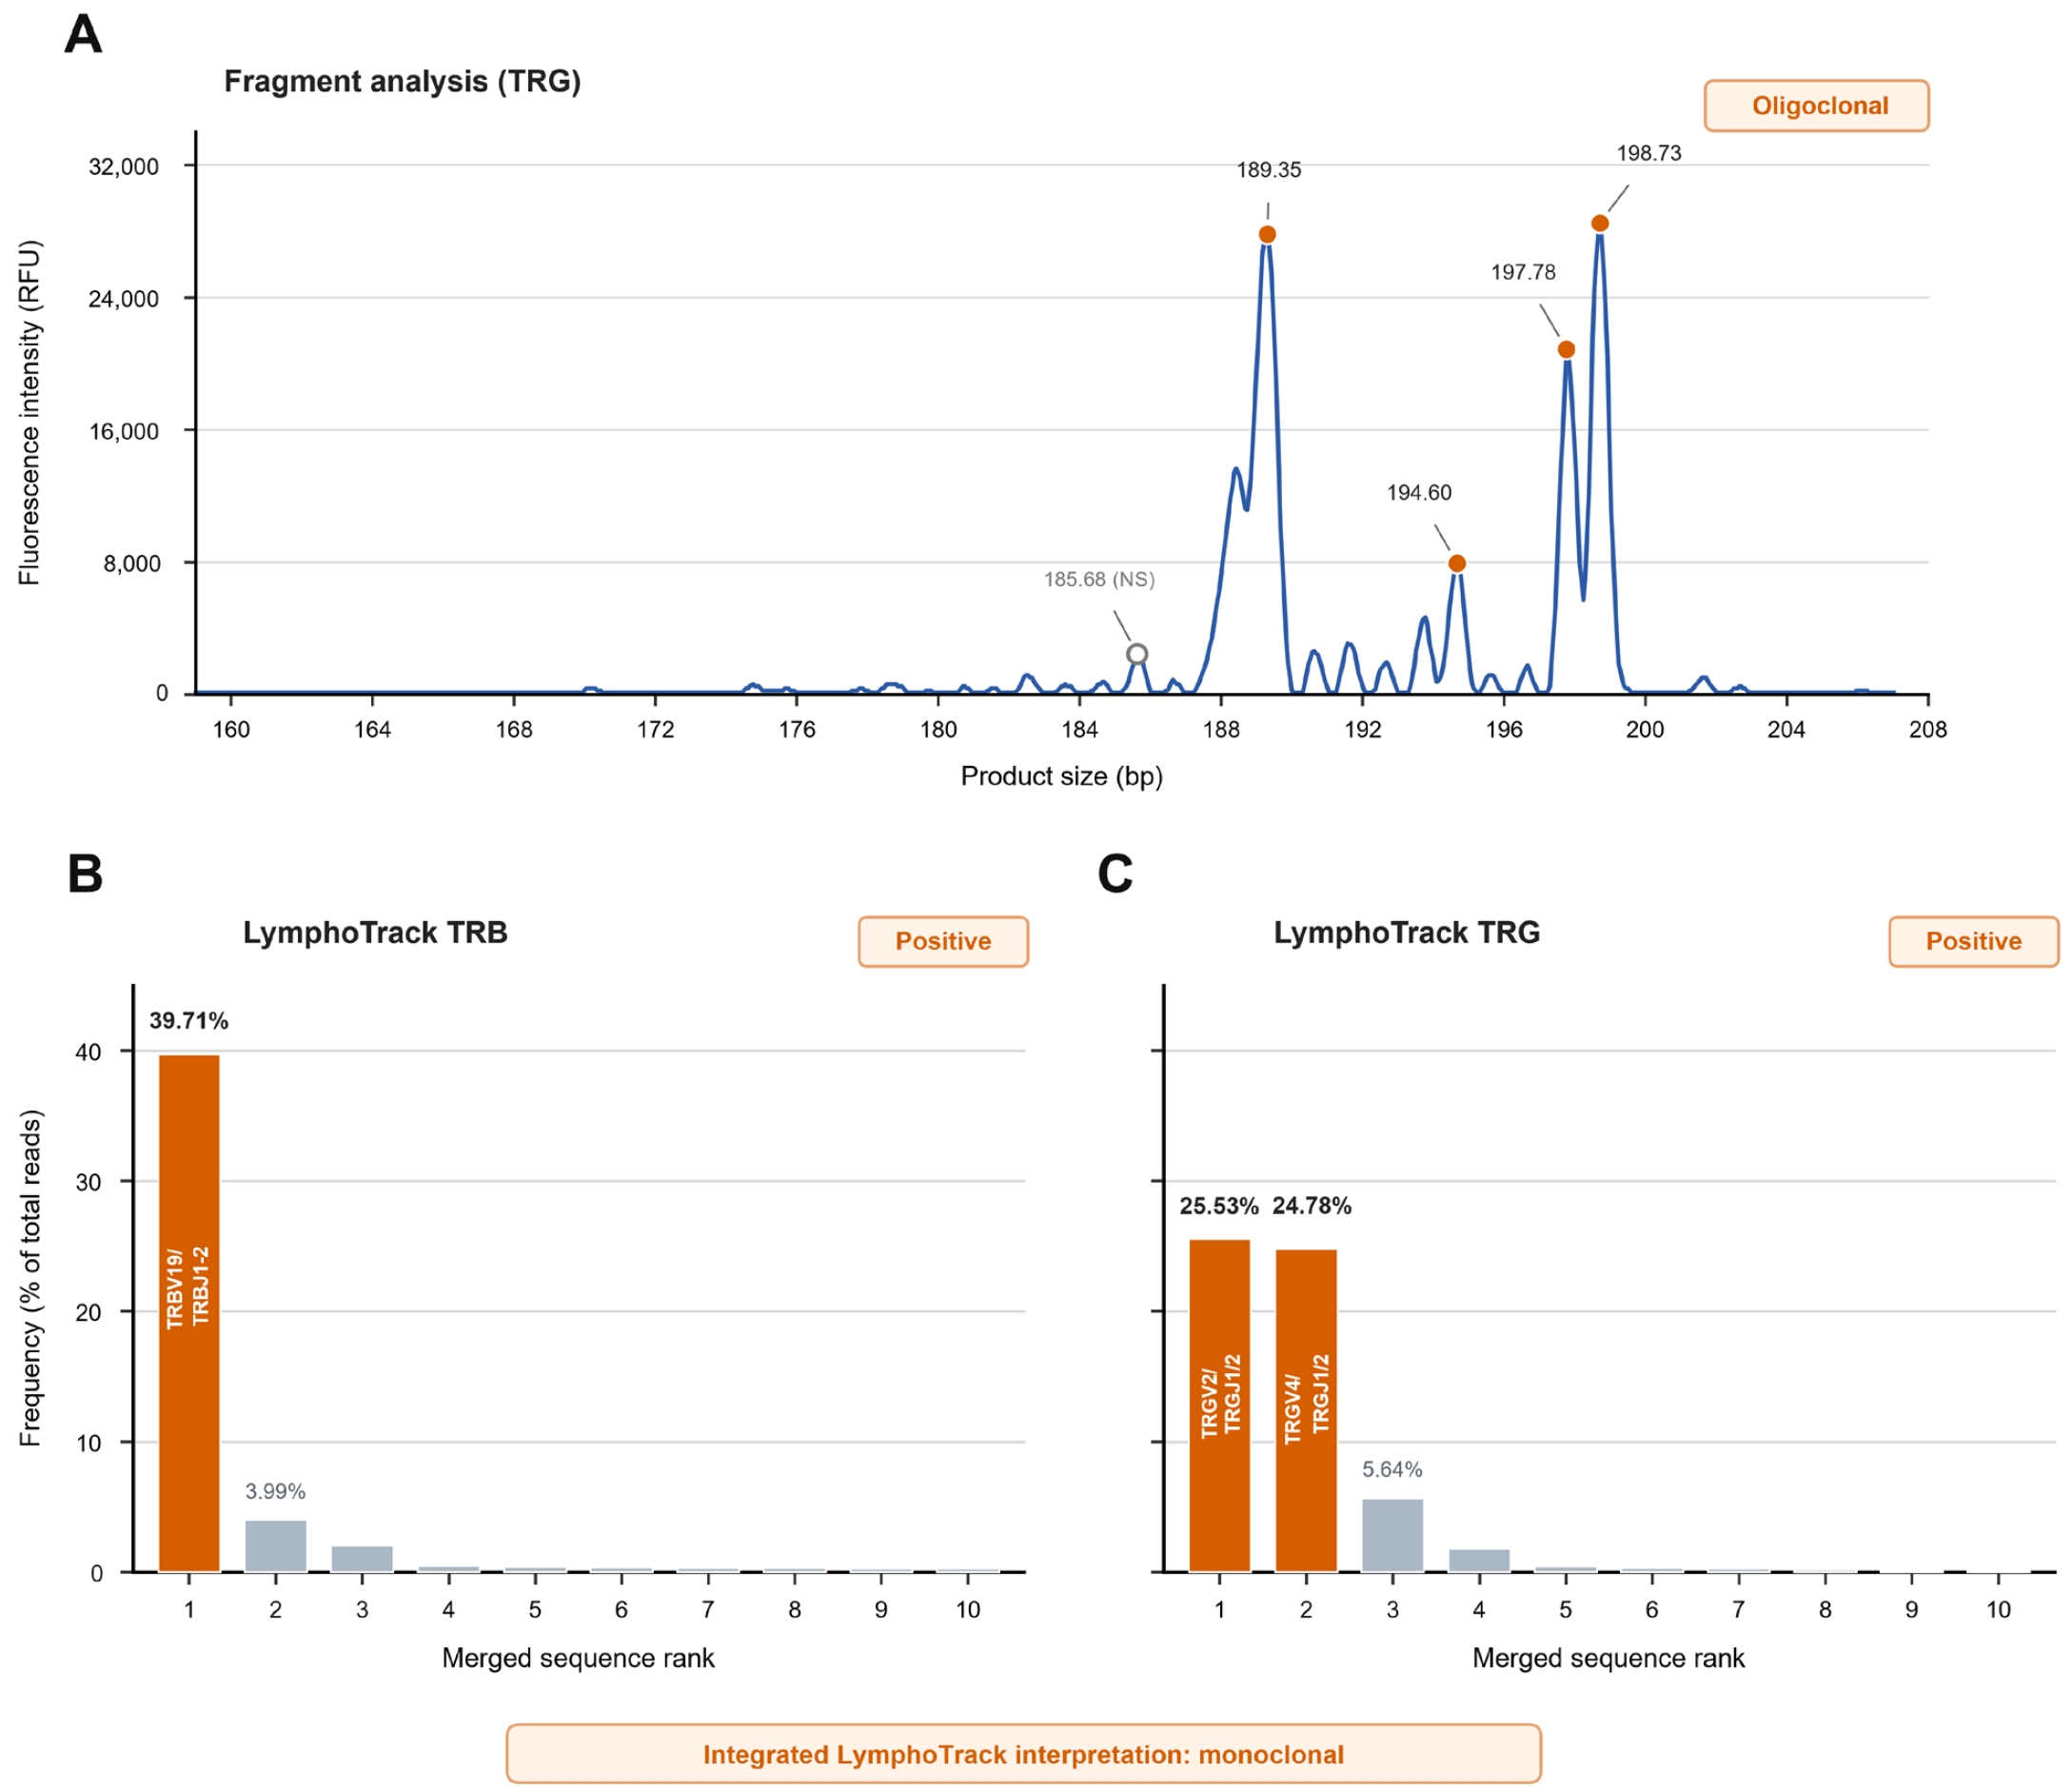
- The single discordant TCR specimen was a parotid gland lesion diagnosed as lymphocyte-variant hypereosinophilic syndrome (LV-HES) (Fig. 3). Fragment analysis showed an oligoclonal TRG pattern. In contrast, the LymphoTrack TRG panel was interpreted as Positive, with two co-dominant TRG sequences accounting for 25.53% and 24.78% of total reads, respectively. The LymphoTrack TRB panel was also Positive, with a dominant clonotype accounting for 39.71% of total reads. Integration of the Positive TRG and TRB results yielded a monoclonal TCR specimen-level interpretation. Targeted NGS identified an activating STAT3 S614R variant.
- Exploratory association of quality control metrics with panel failure
- Post-PCR library concentration was evaluated as an exploratory warning metric for panel failure. A candidate threshold of ≤4.5 ng/µL identified all 10 Fail panels but also flagged 22 of 53 non-Fail panels, corresponding to a recall of 100%, specificity of 58.5%, precision of 31.3%, and balanced accuracy of 0.792 (Supplementary Fig. S1A).
- Adding a maximum library peak size criterion of ≥440 bp did not improve the warning rule. When a panel was flagged if either post-PCR library concentration ≤4.5 ng/µL or maximum library peak size ≥440 bp was met, no additional Fail panels were identified, whereas the number of flagged non-Fail panels increased from 22 to 25. The combined rule retained a recall of 100% but yielded a specificity of 52.8%, precision of 28.6%, and balanced accuracy of 0.764 (Supplementary Fig. S1B). The complete panel-level quality control (QC) data and performance metrics are provided in Supplementary Table S1. Because the candidate thresholds were selected and evaluated in the same dataset, these results were considered exploratory and were not interpreted as validated decision criteria.
RESULTS
- LymphoTrack demonstrated high specimen-level agreement with conventional fragment analysis despite target-dependent technical variability at the individual panel level. All 10 technical Fail events occurred in the longer IGH FR1 or FR2 panels, whereas no FR3 panel failed. After integrated interpretation, 16 of 17 IGH specimen-level results were concordant with fragment analysis. The single IGH discordance occurred in a polyclonal interpretation based on incomplete panel coverage, in which FR1 and FR2 failed and FR3 was Negative, whereas fragment analysis was monoclonal. Importantly, the consequences of panel failure were asymmetric. Under the integrated interpretation scheme, a monoclonal specimen-level interpretation could still be assigned when any one IGH panel was Positive, even if another panel failed. In contrast, a polyclonal interpretation based on incomplete panel coverage could not exclude the possibility that a clonal rearrangement might have been detected in a failed panel, as illustrated by the sole IGH discordance in this cohort. Thus, multi-panel integration mitigated the impact of panel failure in most specimens but did not eliminate the possibility of discordance when a polyclonal interpretation was based on incomplete panel coverage.
- Previous studies have demonstrated high concordance between NGS-based clonality assays and conventional fragment analysis. Large-scale clinical implementation of LymphoTrack IGH and multicenter validation of EuroClonality-NGS IG testing have shown robust performance for B-cell clonality assessment [6,10], while subsequent phase 3 studies have demonstrated high diagnostic accuracy of LymphoTrack IGH and TRG assays [9,11]. More recently, Wiredja et al. [13] evaluated combined LymphoTrack TRB and TRG testing in a large clinical cohort and showed that integrating both TCR targets improved assay sensitivity, while insufficient reads from one target contributed to a subset of false-negative results. Although these studies demonstrated the diagnostic performance and practical feasibility of NGS-based clonality testing, the panel-specific technical performance of individual LymphoTrack IGH targets in FFPE tissue and the consequences of partial IGH panel failure for specimen-level interpretation remain incompletely characterized. Our findings extend previous validation studies by showing that multi-panel integration can mitigate the effect of panel-level failures while also showing that polyclonal interpretations based on incomplete panel coverage may still be discordant with conventional fragment analysis.
- The preferential failure of FR1 and FR2 observed in our cohort is consistent with the expected effects of DNA degradation in FFPE tissue and with EuroClonality recommendations. Formalin fixation introduces DNA fragmentation and cross-linking, reducing the amplification efficiency of longer PCR products and increasing the likelihood of amplicon dropout in degraded FFPE DNA [14]. Accordingly, the EuroClonality/BIOMED-2 guidelines recommend smaller amplicon targets, such as IGH FR3, for specimens with compromised DNA quality, whereas longer targets, including FR1 and FR2, are expected to be more susceptible to technical failure [2]. The observed FR1/FR2 failures should therefore not necessarily be interpreted as a platform-specific limitation of LymphoTrack. Length-dependent amplification failure is a general consequence of degraded FFPE DNA and would be expected to affect other PCR-based clonality assays using similarly long targets. In the present study, fragment analysis served as a lineage-level clinical comparator, and reaction-level technical failure of individual fragment-analysis targets was not systematically evaluated; therefore, direct comparison of target-specific failure rates between the two methods was not possible. NGS-based testing additionally introduces library-generation and sequencing-depth requirements, which represent potential failure points beyond PCR amplification itself.
- Our findings were consistent with these technical expectations: all technical Fail events occurred in FR1 or FR2, whereas no FR3 panel failed. Accordingly, the single discordant IGH specimen cannot by itself distinguish between a LymphoTrack-specific limitation and a shared vulnerability of longer amplicons in degraded FFPE DNA. However, the greater technical robustness of FR3 does not diminish the complementary value of the other IGH panels. In our cohort, one specimen showed clonality exclusively in the FR2 panel, supporting the complementary rather than interchangeable roles of individual IGH targets and the value of assessment across multiple targets whenever technically feasible.
- Our findings also reinforce the importance of integrated interpretation rather than isolated evaluation of individual panel results. The EuroClonality guidelines emphasize that clonality testing should be interpreted at the level of the overall molecular conclusion rather than according to the outcome of individual PCR reactions [2]. More recent EuroClonality-NGS recommendations similarly emphasize evaluation of individual IG targets followed by integration into an overall molecular clonality conclusion [12]. Under our integrated interpretation scheme, a single Positive IGH panel was sufficient for a monoclonal specimen-level interpretation, as illustrated by the specimen with isolated FR2 positivity. Conversely, when no panel was Positive, specimens with at least one interpretable Negative panel were classified as polyclonal even when one or more other panels had failed; such interpretations were considered to be based on incomplete panel coverage. One of the six polyclonal IGH interpretations based on incomplete panel coverage was discordant with fragment analysis, highlighting the importance of distinguishing these results from polyclonal interpretations based on complete panel coverage. In routine diagnostic practice, a polyclonal result based on incomplete IGH panel coverage may prompt consideration of repeat testing or assessment of additional clonality targets such as IGK [2,5]. When such a result is reported, explicitly noting the failed panel(s) or incomplete panel coverage may help communicate the residual uncertainty associated with the polyclonal interpretation. From a practical reporting perspective, IGH results may be categorized as monoclonal, polyclonal, or non-evaluable, with panel completeness used as an additional qualifier for polyclonal interpretations. A specimen in which all IGH panels are classified as Fail would be considered non-evaluable rather than polyclonal. Fig. 2 summarizes both the integrated interpretation algorithm and the IGH panel patterns observed in this cohort.
- A further practical consideration is specimen DNA consumption. The intended input was 200 ng per LymphoTrack panel, corresponding to approximately 600 ng for a complete three-panel IGH evaluation and approximately 1 µg when both TRB and TRG panels were also performed. This requirement may be clinically relevant in small biopsies or other DNA-limited FFPE specimens, particularly when extracted DNA must be shared with other ancillary molecular assays. Because DNA input requirements for the conventional fragment-analysis comparator were not systematically evaluated in this study, direct comparison of specimen consumption between the two methods was not possible. In DNA-limited specimens, a tiered testing strategy could potentially reduce DNA consumption by prioritizing technically robust or clinically informative targets. However, the isolated FR2-positive specimen in our cohort indicates that an FR3-only approach may miss clonal rearrangements. Therefore, any reduced-panel or tiered strategy would require prospective validation before routine implementation.
- The discordant LV-HES case illustrates the additional sequence-level information provided by NGS-based clonality analysis. LV-HES is a T-cell-driven form of hypereosinophilic syndrome characterized by an immunophenotypically aberrant, often clonal T-cell population that produces eosinophilopoietic cytokines, particularly interleukin-5; demonstration of TCR clonality is therefore an important supportive feature of this disease [15,16]. Conventional fragment analysis demonstrated an oligoclonal TRG pattern, whereas the LymphoTrack TRG panel itself was Positive, with two co-dominant TRG clonotypes; the TRB panel additionally identified a dominant clonotype. Thus, although the overall TCR comparison was asymmetric because conventional testing assessed TRG only while LymphoTrack integrated both TRG and TRB, the discordance could not be attributed solely to the addition of the TRB target. In addition, targeted sequencing identified an activating STAT3 S614R variant, which has previously been reported in LV-HES and an LV-HES–like T-cell lymphoproliferative disorder [17,18]. In this clinicopathologic context, the clonotype findings together with the STAT3 S614R variant provided further molecular support for an underlying clonal T-cell population. These findings illustrate how sequence-resolved clonotype analysis may clarify clonality when fragment analysis produces an oligoclonal or otherwise equivocal pattern. More broadly, direct identification of clonotype sequences may also facilitate comparison of lesions obtained at different time points or anatomical sites, although such applications require dedicated validation.
- The exploratory QC analysis identified low post-PCR library concentration as a potential warning feature for panel failure. The candidate threshold identified all Fail panels in the present cohort; however, it also flagged 22 of 53 non-Fail panels, indicating limited specificity for panel failure. Adding maximum library peak size did not improve the performance of the warning rule. Given the limited specificity and the use of the same cohort for threshold selection and evaluation, these QC metrics should be considered exploratory. Independent cohorts are needed to assess their reproducibility and practical utility.
- Several limitations should be acknowledged. First, this was a retrospective single-center study with a relatively small number of specimens, particularly for TCR clonality testing. The cohort was enriched for diagnostically challenging specimens that had undergone conventional clonality testing, which may limit the generalizability of the observed agreement and panel-failure rates. Second, assay performance was evaluated using conventional fragment analysis as the clinical comparator rather than an independent molecular reference method. For TCR testing specifically, the conventional comparator was limited to TRG fragment analysis, whereas the LymphoTrack specimen-level interpretation integrated both TRG and TRB results, resulting in an asymmetric comparison between methods. Reaction-level technical failure of individual fragment-analysis targets was not systematically evaluated, precluding direct comparison of target-specific failure rates between the two methods. In addition, DNA input requirements for the fragment-analysis comparator were not systematically assessed, limiting direct comparison of specimen consumption. Third, polyclonal IGH interpretations based on incomplete panel coverage were not further evaluated by IGK reflex testing or repeat analysis; consequently, the clonality status of the single discordant IGH specimen could not be independently confirmed. In addition, panel interpretability incorporated expert laboratory review, including review of borderline sequencing output, which may limit reproducibility across laboratories.
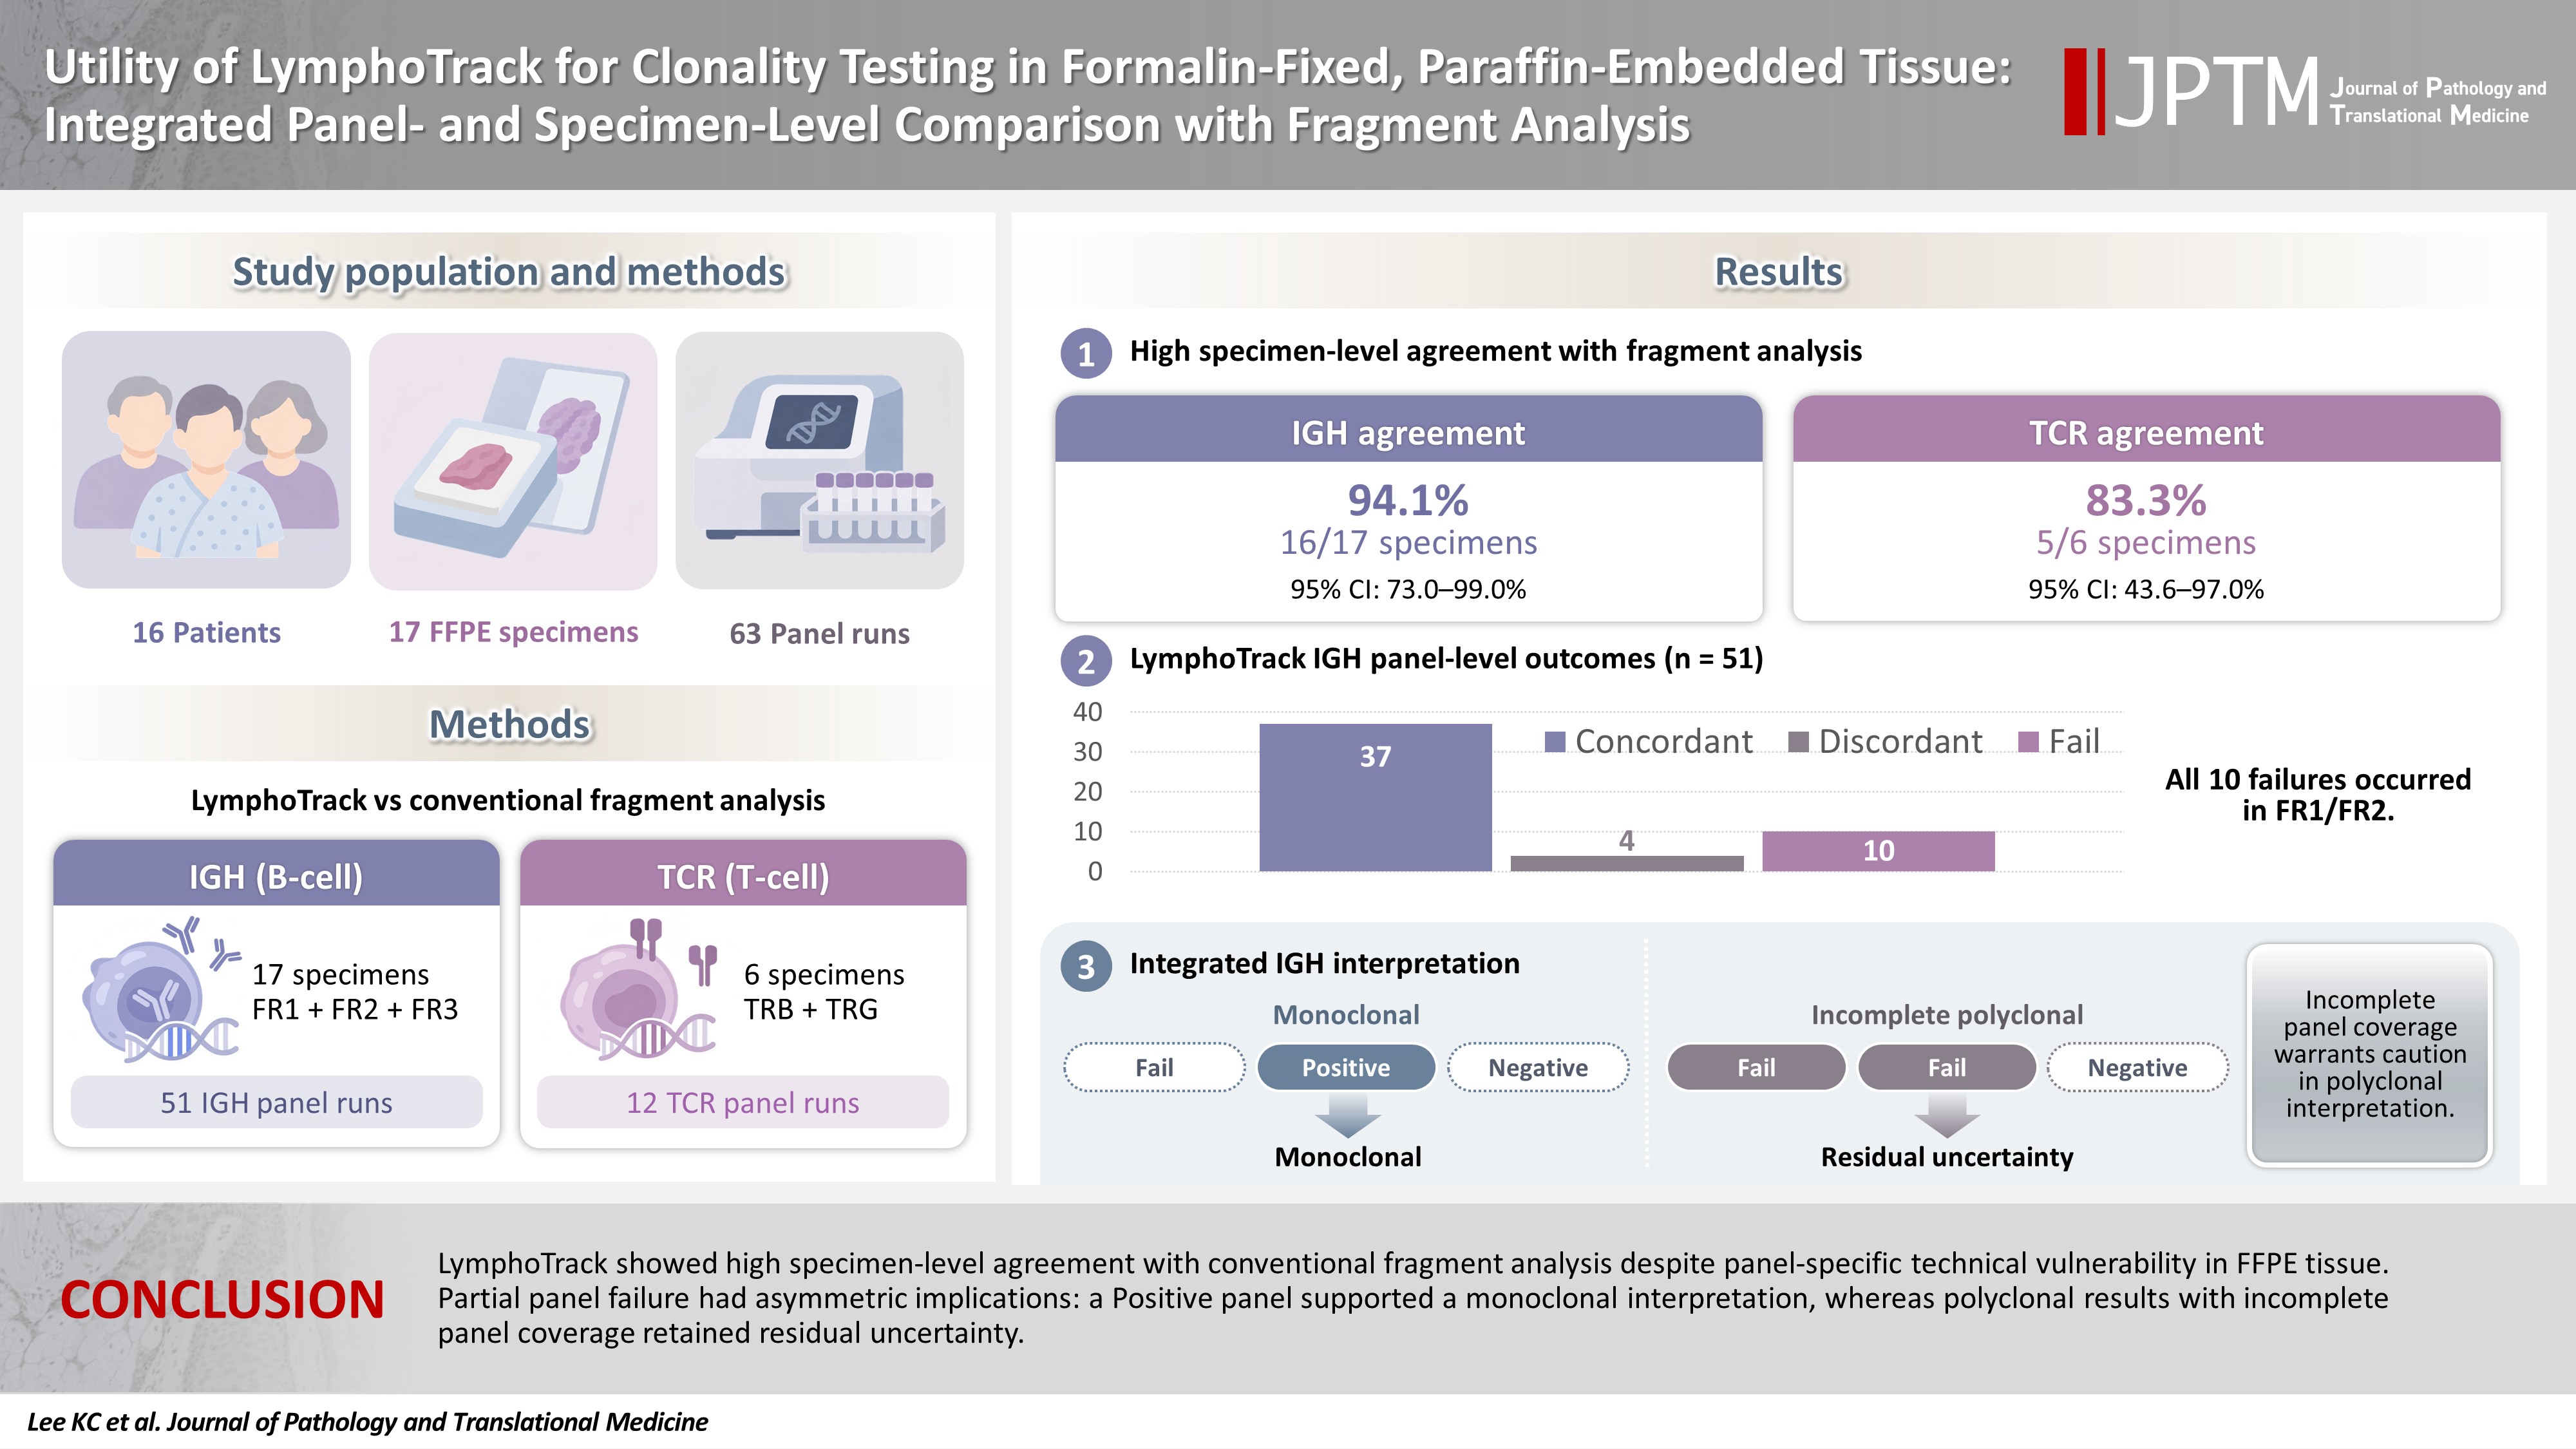
- In conclusion, LymphoTrack showed high specimen-level agreement with conventional fragment analysis in this FFPE cohort despite panel-specific technical vulnerability. Integrated interpretation across complementary IGH panels mitigated the impact of individual panel failure, although one polyclonal interpretation based on incomplete panel coverage was discordant with fragment analysis. These findings underscore the value of integrated multi-panel interpretation and suggest that noting incomplete panel coverage may help communicate the limitations of polyclonal IGH results.
DISCUSSION
Supplementary Information
Ethics Statement
This study was approved by the Institutional Review Board of Seoul National University Hospital (IRB No. 1905-115-1035). The requirement for written informed consent was waived because of the retrospective study design and the use of archived clinical specimens and laboratory data. The study was conducted in accordance with the principles of the Declaration of Helsinki and applicable institutional guidelines.
Availability of Data and Material
The data supporting the findings of this study are available from the corresponding authors upon reasonable request, subject to applicable institutional and ethical restrictions.
Code Availability
Not applicable.
Author Contributions
Conceptualization: YKJ. Formal analysis: KCL, HAK, SGS. Funding acquisition: YKJ. Methodology: HAK, JK, JMB, CL. Supervision: JK, JMB, CL, SGS, YKJ. Visualization: KCL, SGS. Writing—original draft: KCL, SGS. Writing—review & editing: KCL, HAK, JK, JMB, CL, SGS, YKJ. Approval of final manuscript: all authors.
Conflicts of Interest
Hyun-A Kim is an employee of Dow Biomedica Inc., which provided technical support for LymphoTrack testing and data analysis. The other authors declare no potential conflicts of interest.
Funding Statement
This research was supported in part by The Korean Society of Pathologists Grant No. KSPG2021-03 and by the Development Fund of Seoul National University, funded by the HUNKIM Family Charitable Foundation.
Acknowledgments
Dow Biomedica Inc. provided technical support for LymphoTrack testing and data analysis.
Data are shown as counts unless otherwise indicated. Agreement denotes concordance between the final lineage-specific specimen-level LymphoTrack and fragment-analysis interpretations. For TCR, the fragment-analysis interpretation was based on TRG testing, whereas the LymphoTrack specimen-level interpretation integrated TRB and TRG results. The 95% confidence intervals were calculated using the Wilson method.
CI, confidence interval; IGH, immunoglobulin heavy chain; TCR, T-cell receptor; TRG, T-cell receptor gamma; TRB, T-cell receptor beta.
- 1. van Dongen JJ, Langerak AW, Bruggemann M, et al. Design and standardization of PCR primers and protocols for detection of clonal immunoglobulin and T-cell receptor gene recombinations in suspect lymphoproliferations: report of the BIOMED-2 Concerted Action BMH4-CT98-3936. Leukemia 2003; 17: 2257-317. ArticlePubMedPMCPDF
- 2. Langerak AW, Groenen PJ, Bruggemann M, et al. EuroClonality/BIOMED-2 guidelines for interpretation and reporting of Ig/TCR clonality testing in suspected lymphoproliferations. Leukemia 2012; 26: 2159-71. ArticlePubMedPMCPDF
- 3. Ho CC, Tung JK, Zehnder JL, Zhang BM. Validation of a next-generation sequencing-based T-cell receptor gamma gene rearrangement diagnostic assay: transitioning from capillary electrophoresis to next-generation sequencing. J Mol Diagn 2021; 23: 805-15. ArticlePubMedPMC
- 4. Srinivasan M, Sedmak D, Jewell S. Effect of fixatives and tissue processing on the content and integrity of nucleic acids. Am J Pathol 2002; 161: 1961-71. ArticlePubMedPMC
- 5. Evans PA, Pott C, Groenen PJ, et al. Significantly improved PCR-based clonality testing in B-cell malignancies by use of multiple immunoglobulin gene targets. Report of the BIOMED-2 Concerted Action BHM4-CT98-3936. Leukemia 2007; 21: 207-14. ArticlePubMedPDF
- 6. Arcila ME, Yu W, Syed M, et al. Establishment of immunoglobulin heavy (IGH) chain clonality testing by next-generation sequencing for routine characterization of B-cell and plasma cell neoplasms. J Mol Diagn 2019; 21: 330-42. ArticlePubMedPMC
- 7. Kansal R, Grody WW, Zhou J, Dong L, Li X. The value of T-cell receptor gamma (TRG) clonality evaluation by next-generation sequencing in clinical hematolymphoid tissues: a descriptive study of 41 cases from a single institution. Am J Clin Pathol 2018; 150: 193-223. ArticlePubMed
- 8. Nollet F, Vanhouteghem K, Vermeire S, et al. Evaluation of next-generation sequencing-based clonality analysis of T-cell receptor gamma gene rearrangements based on a new interpretation algorithm. Int J Lab Hematol 2019; 41: 242-9. ArticlePubMedPDF
- 9. Donelli R, Gazzola A, Mannu C, Etebari M, Navari M, Piccaluga PP. Conventional PCR-based versus next-generation sequencing-based approach for T-cell receptor gamma gene clonality assessment in mature T-cell lymphomas: a phase 3 diagnostic accuracy study. J Biol Methods 2024; 11: e99010013. ArticlePubMedPMC
- 10. van den Brand M, Rijntjes J, Mobs M, et al. Next-generation sequencing-based clonality assessment of Ig gene rearrangements: a multicenter validation study by EuroClonality-NGS. J Mol Diagn 2021; 23: 1105-15. ArticlePubMed
- 11. Gazzola A, Navari M, Mannu C, Donelli R, Etebari M, Piccaluga PP. Single-step IGHV next-generation sequencing detects clonality and somatic hypermutation in lymphoid malignancies: a phase III diagnostic accuracy study. Cancers (Basel) 2023; 15: 4624.ArticlePubMedPMC
- 12. van den Brand M, Mobs M, Otto F, et al. EuroClonality-NGS recommendations for evaluation of B-cell clonality analysis by next-generation sequencing: a structured approach with the DEPART algorithm. J Mol Diagn 2023; 25: 729-39. ArticlePubMed
- 13. Wiredja D, Libert D, Jangam D, Ho C, Tung J, Zhang BM. Performance evaluation of a next-generation sequencing-based T-cell receptor gene rearrangement assay. J Mol Diagn 2025; 27: 465-74. ArticlePubMed
- 14. Groenen PJ, van den Brand M, Kroeze LI, Amir AL, Hebeda KM. Read the clonotype: next-generation sequencing-based lymphocyte clonality analysis and perspectives for application in pathology. Front Oncol 2023; 13: 1107171.ArticlePubMedPMC
- 15. Shi Y, Wang C. What we have learned about lymphocytic variant hypereosinophilic syndrome: a systematic literature review. Clin Immunol 2022; 237: 108982.ArticlePubMed
- 16. Carpentier C, Schandene L, Dewispelaere L, Heimann P, Cogan E, Roufosse F. CD3(-)CD4(+) lymphocytic variant hypereosinophilic syndrome: diagnostic tools revisited. J Allergy Clin Immunol Pract 2021; 9: 2426-39. ArticlePubMed
- 17. King RL, Tan B, Craig FE, et al. Reactive eosinophil proliferations in tissue and the lymphocytic variant of hypereosinophilic syndrome. Am J Clin Pathol 2021; 155: 211-38. ArticlePubMedPDF
- 18. Marinelli L, Johnson E, Witzig T, et al. T-cell lymphoproliferative disorder with a STAT3 mutation causing a lymphocytic variant of hypereosinophilic-like syndrome without eosinophilia. J Hematop 2025; 18: 6.ArticlePubMedPDF
REFERENCES
Figure & Data
References
Citations

 PubReader
 ePub Link
-
 Cite this Article
- Cite this Article
-
- Close
- Download Citation
- Close
 XML Download
- Figure
-
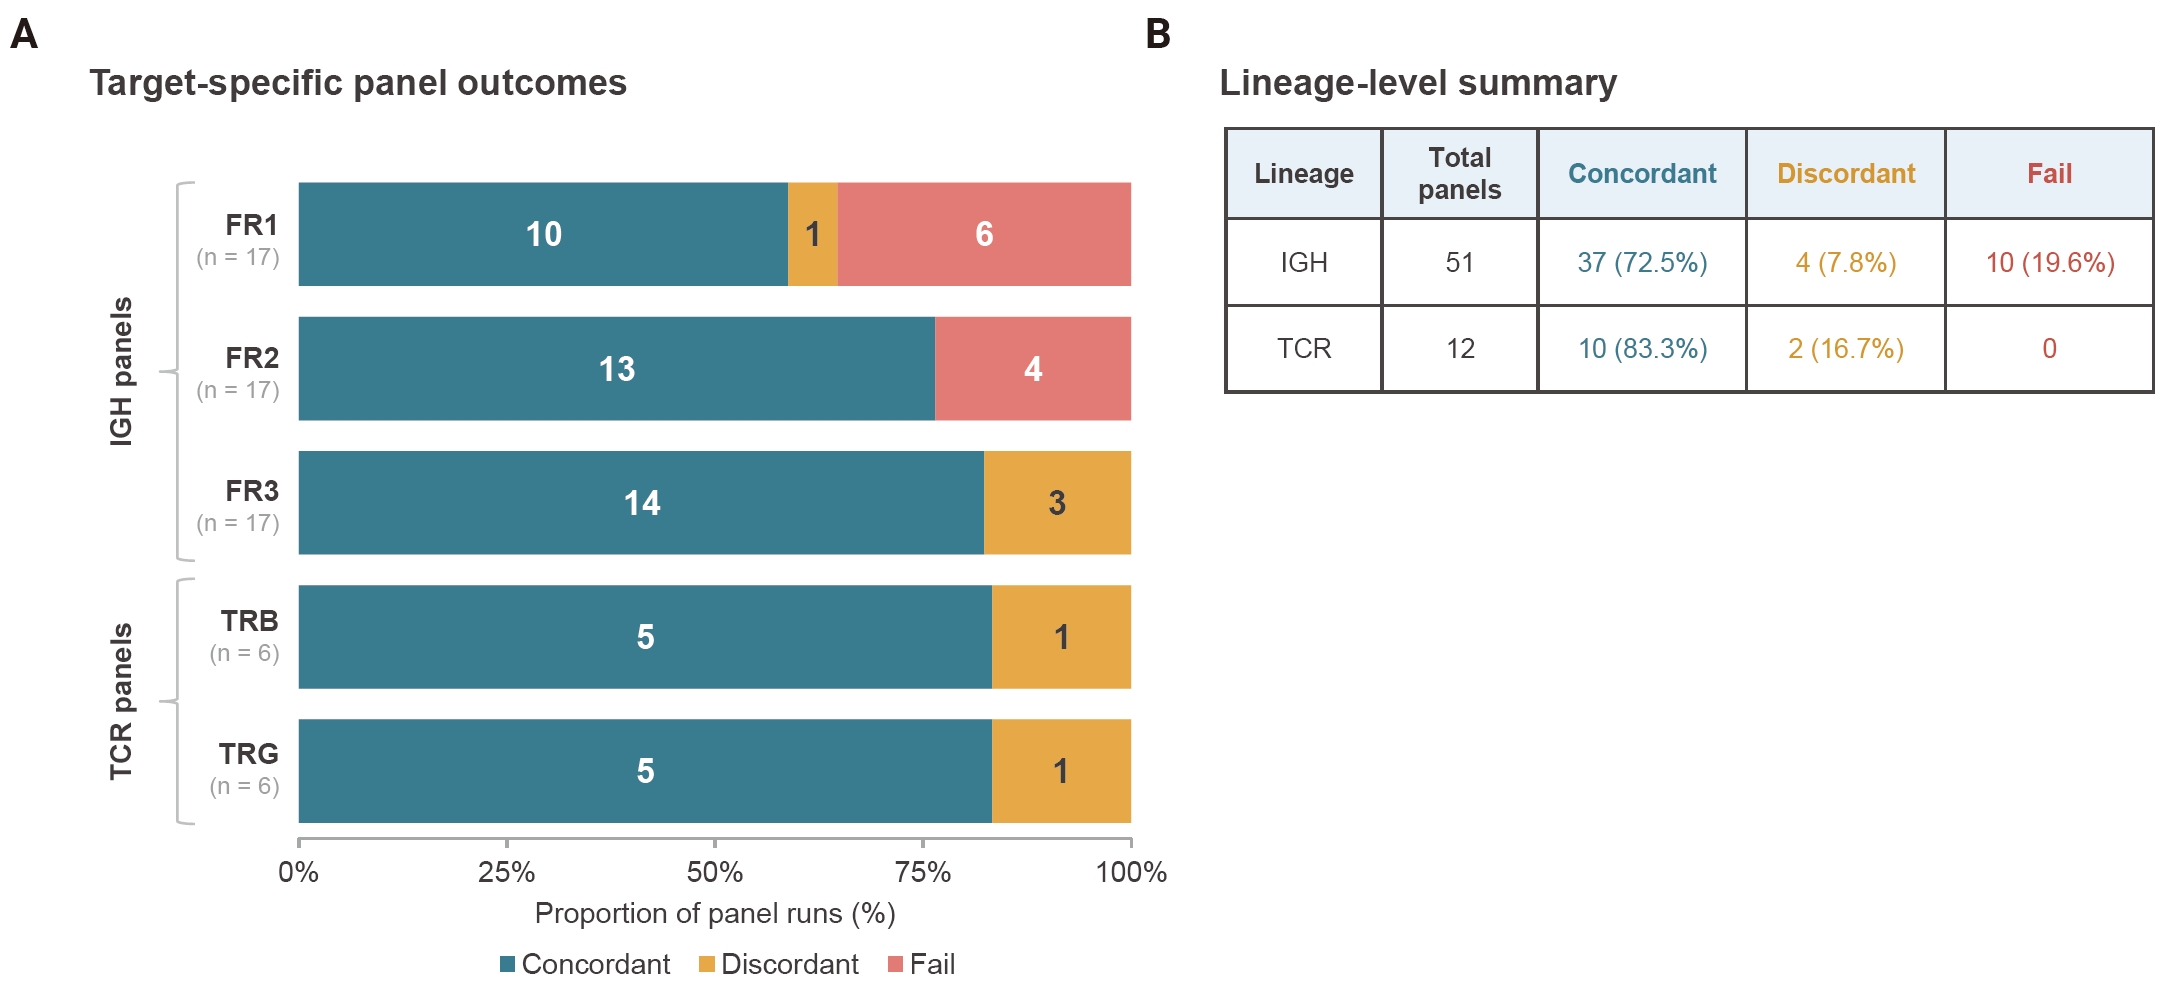
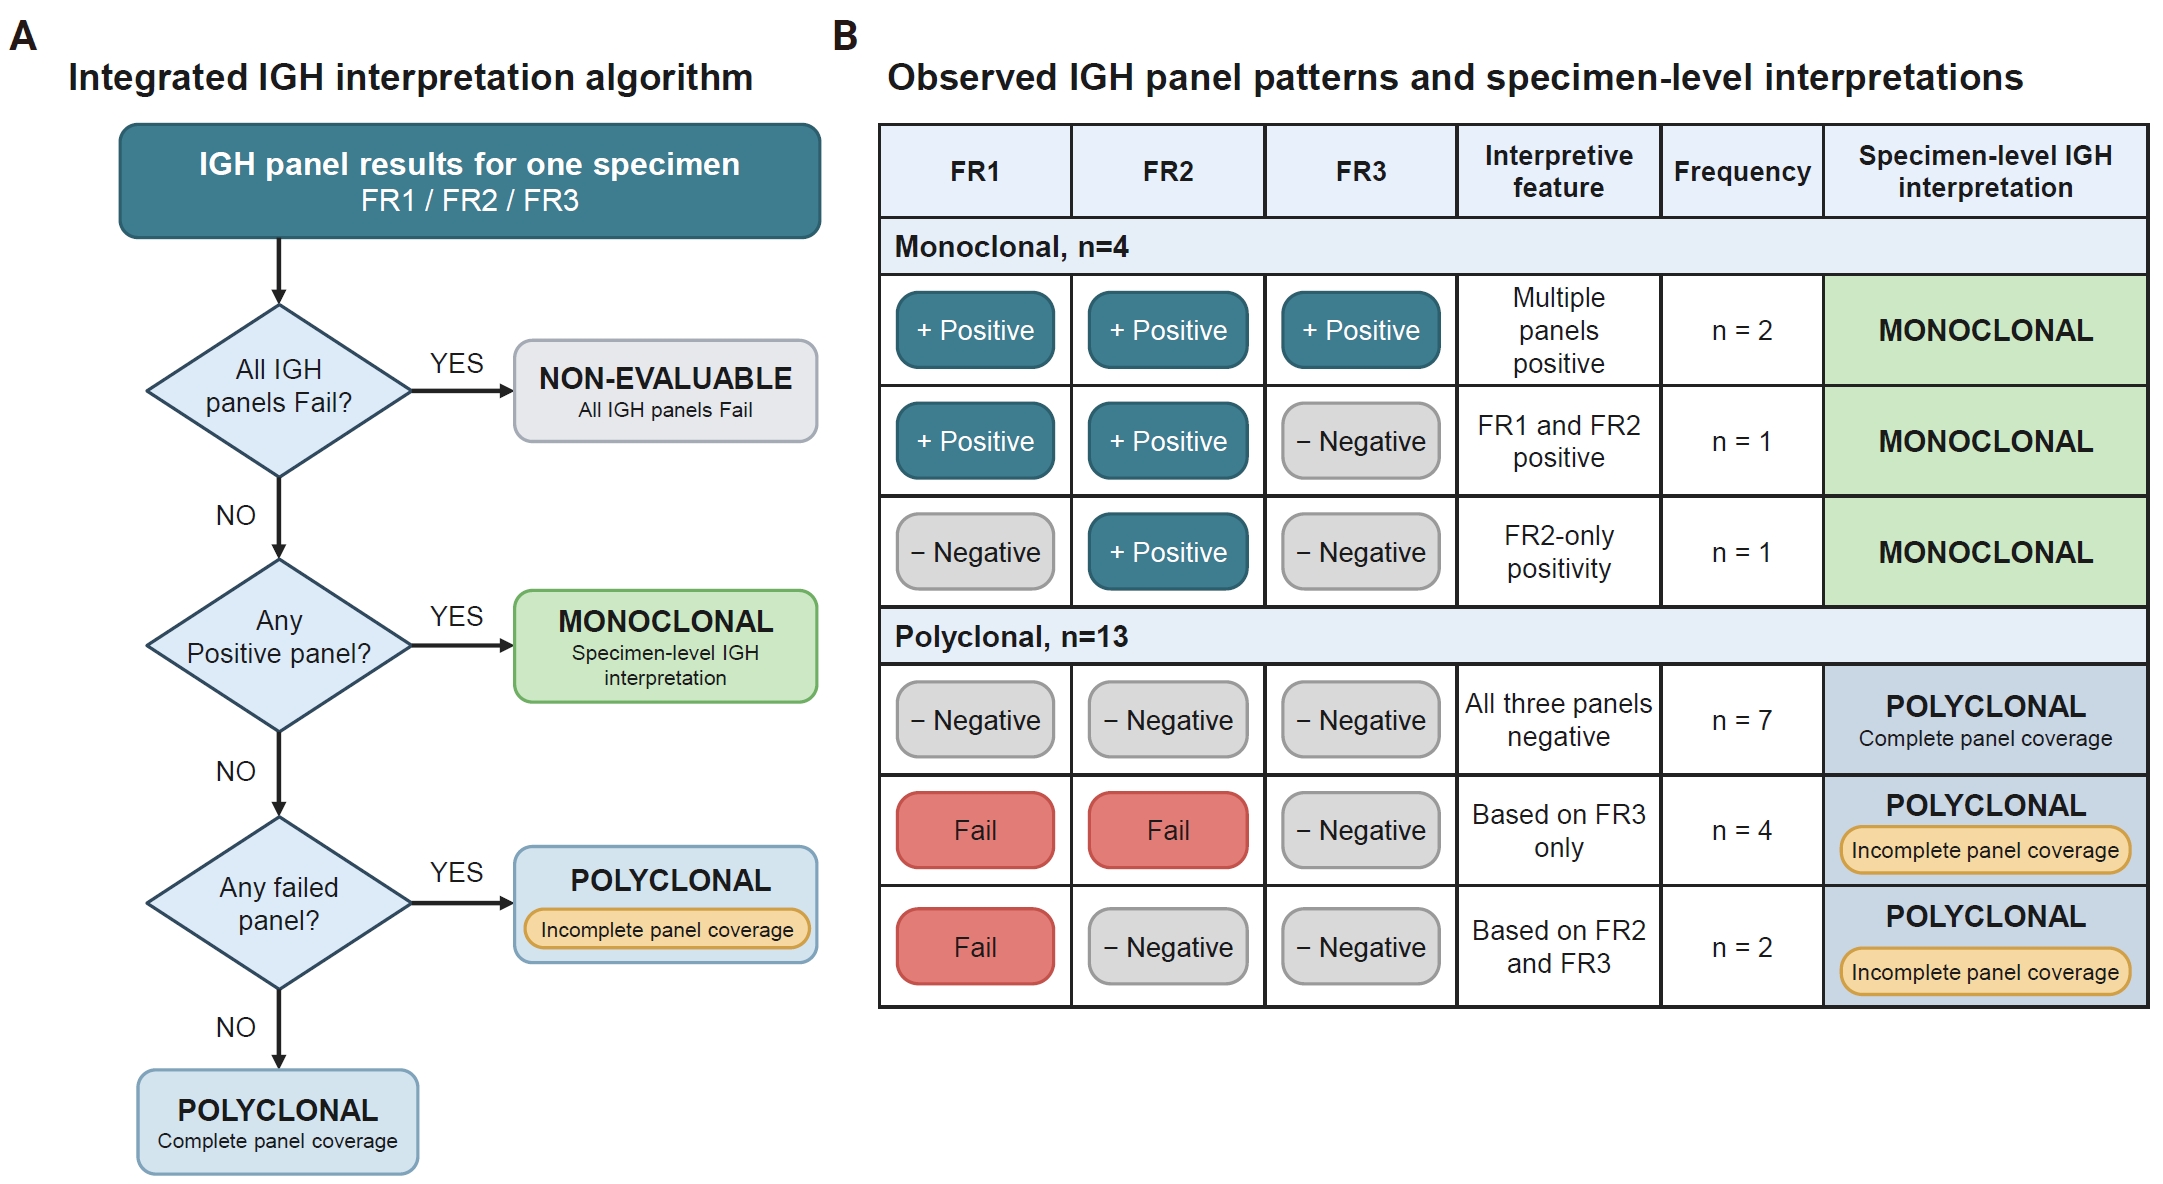
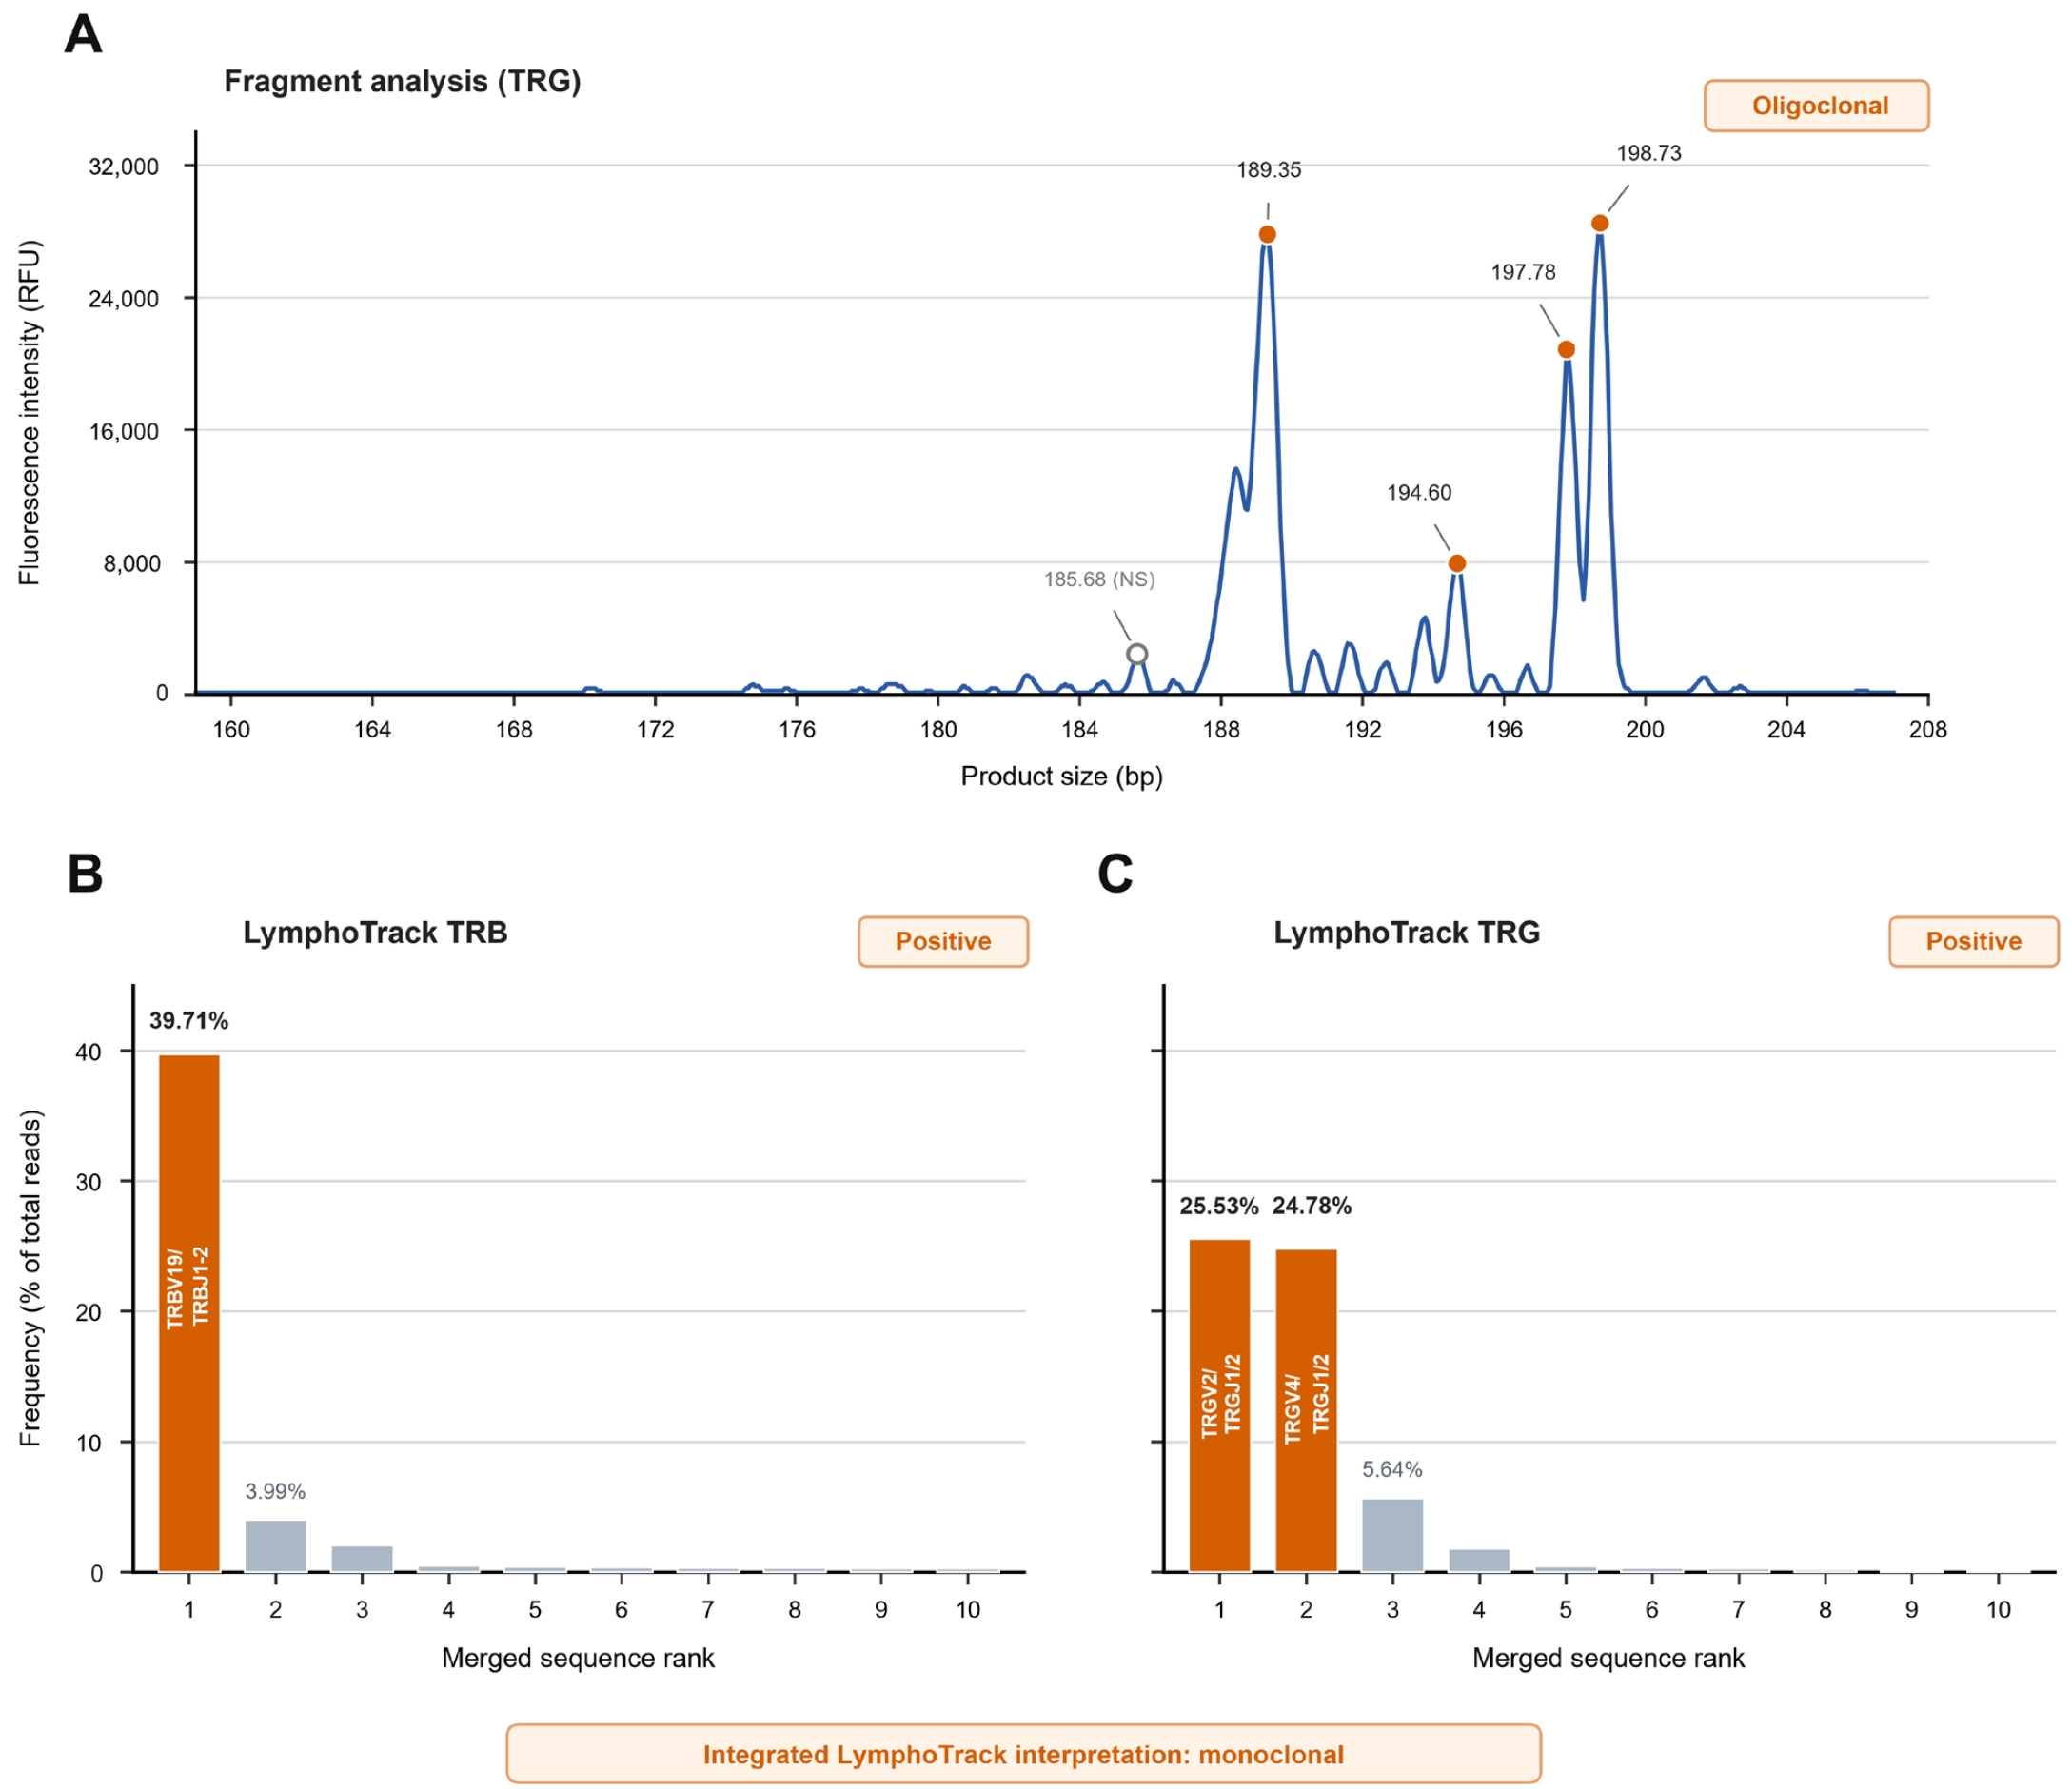
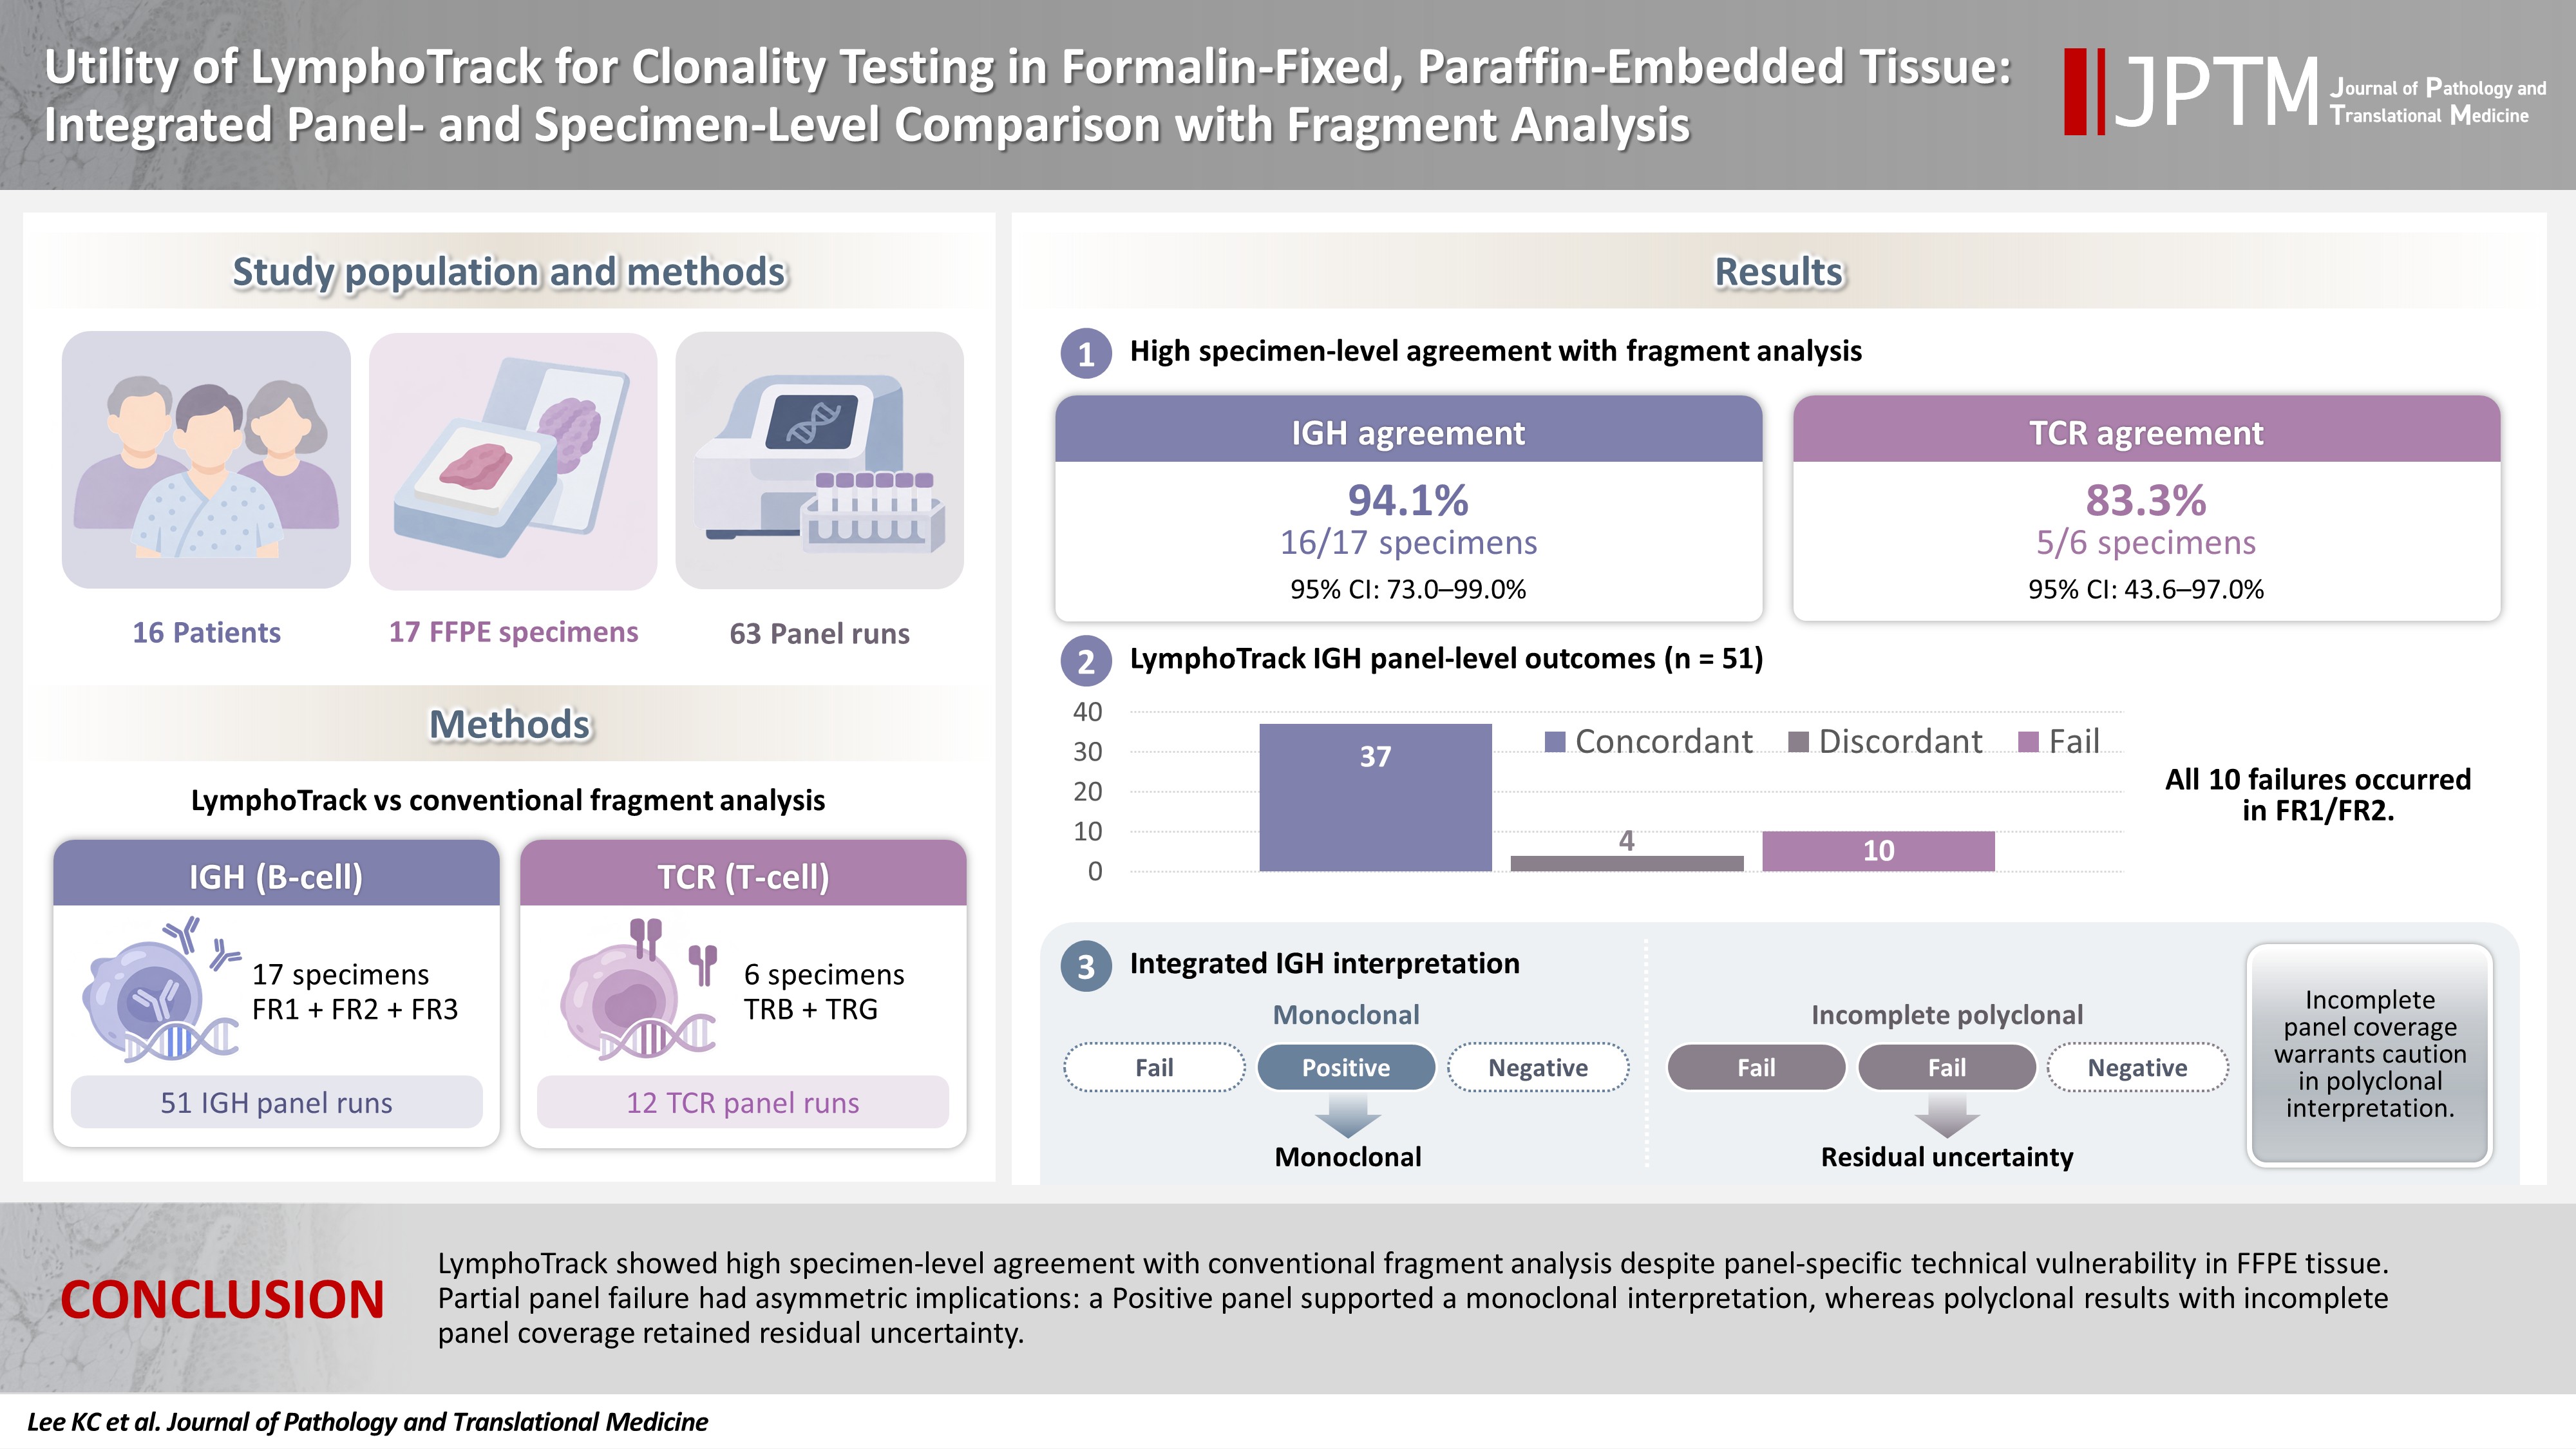




Fig. 1.
Fig. 2.
Fig. 3.
Graphical abstract
| Characteristic | No. |
|---|---|
| Patients | 16 |
| Distinct FFPE specimens | 17 |
| IGH-tested specimens | 17 |
| TCR-tested specimens | 6 |
| Lineage-specific specimen-level interpretations | 23 |
| Individual LymphoTrack panel runs | 63 |
| IGH panel runs | 51 |
| TCR panel runs | 12 |
| Lineage | No. of specimens | LymphoTrack interpretation, n | Fragment analysis interpretation, n | Concordant, n | Agreement (%) | 95% CI (%) | |||
|---|---|---|---|---|---|---|---|---|---|
| Monoclonal | Polyclonal | Monoclonal | Polyclonal | Oligoclonal | |||||
| IGH | 17 | 4 | 13 | 5 | 12 | 0 | 16 | 94.1 | 73.0–99.0 |
| TCR | 6 | 3 | 3 | 2 | 3 | 1 | 5 | 83.3 | 43.6–97.0 |
FFPE, formalin-fixed, paraffin-embedded; IGH, immunoglobulin heavy chain; TCR, T-cell receptor.
Data are shown as counts unless otherwise indicated. Agreement denotes concordance between the final lineage-specific specimen-level LymphoTrack and fragment-analysis interpretations. For TCR, the fragment-analysis interpretation was based on TRG testing, whereas the LymphoTrack specimen-level interpretation integrated TRB and TRG results. The 95% confidence intervals were calculated using the Wilson method. CI, confidence interval; IGH, immunoglobulin heavy chain; TCR, T-cell receptor; TRG, T-cell receptor gamma; TRB, T-cell receptor beta.


