E-submission
Articles
- Page Path
- HOME > J Pathol Transl Med > Volume 60(2); 2026 > Article
-
Original Article
Deep learning–driven immunohistochemical analysis of renal lymphatics for chronic kidney disease: bioinformatic and histopathological study -
Xin Xu1
 , YanPing Lin1, Guangchang Pei1, Rui Zeng1,2,3,4, Gang Xu1,2,3,4
 -
Journal of Pathology and Translational Medicine 2026;60(2):220-230.
DOI: https://doi.org/10.4132/jptm.2025.12.15
Published online: March 13, 2026
1Division of Nephrology, Tongji Hospital, Tongji Medical College, Huazhong University of Science and Technology, Wuhan, China
2Key Laboratory of Organ Transplantation, Ministry of Education, Chinese Academy of Medical Sciences, Wuhan, China
3NHC Key Laboratory of Organ Transplantation, Chinese Academy of Medical Sciences, Wuhan, China
4Key Laboratory of Organ Transplantation, Chinese Academy of Medical Sciences, Wuhan, China
-
Corresponding Authors: Gang Xu, MD, PhD Division of Nephrology, Department of Internal Medicine, Tongji Hospital, Tongji Medical College, Huazhong University of Science and Technology, 1095# Jiefang Ave., Wuhan 430030, China Tel: +86-27-8366-8406, Fax: +86-27-8366-8406, E-mail: xugang@tjh.tjmu.edu.cn
Rui Zeng, MD, PhD Division of Nephrology, Department of Internal Medicine, Tongji Hospital, Tongji Medical College, Huazhong University of Science and Technology, 1095# Jiefang Ave., Wuhan 430030, China Tel: +86-27-8366-8406, Fax: +86-27-8366-8406, E-mail: zengrui@tjh.tjmu.edu.cn
© The Korean Society of Pathologists/The Korean Society for Cytopathology
This is an Open Access article distributed under the terms of the Creative Commons Attribution Non-Commercial License (https://creativecommons.org/licenses/by-nc/4.0) which permits unrestricted non-commercial use, distribution, and reproduction in any medium, provided the original work is properly cited.
- 1,789 Views
- 90 Download
Abstract
-
Background
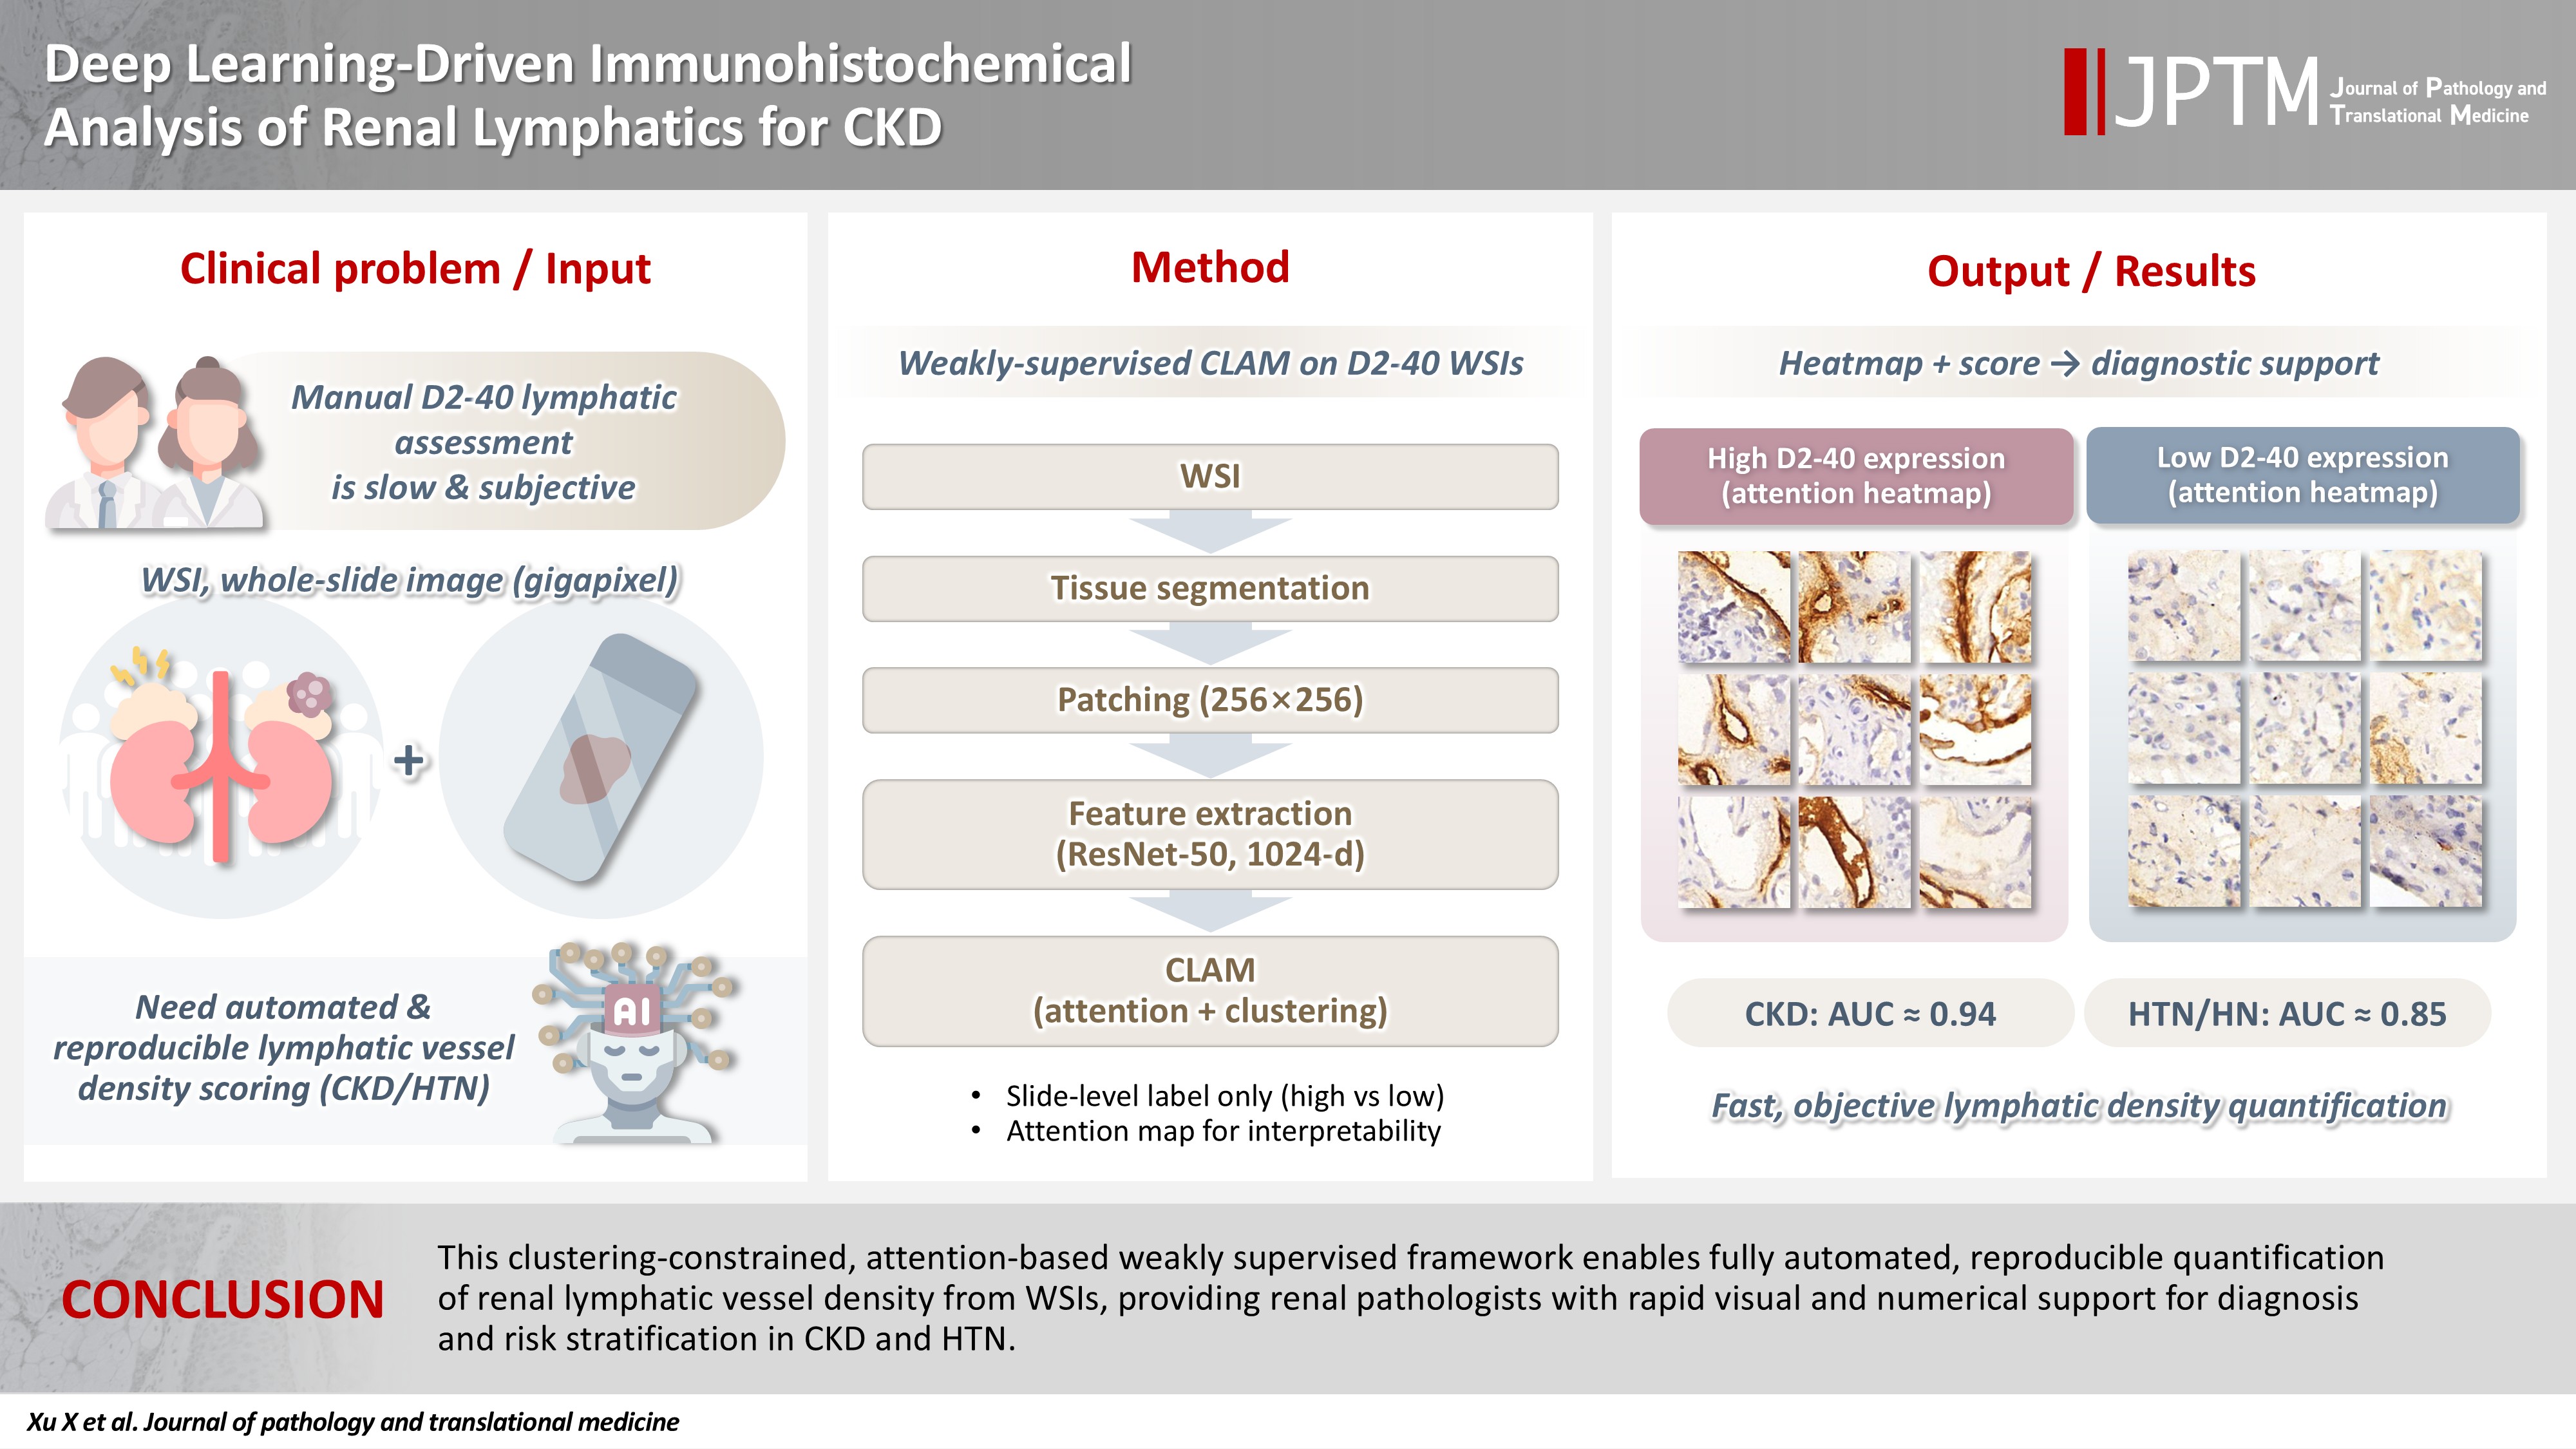
- Renal lymphatic vessel density is clinically relevant in kidney disease but is still assessed by slow, subjective visual estimation. We evaluated a weakly supervised, attention‑based multiple‑instance learning framework for automated detection and quantification of renal lymphatic vessel density on D2‑40‑stained whole‑slide images (WSIs).
-
Methods
- Two independent internal datasets from Tongji Hospital were collected, including 198 cases of chronic kidney disease (CKD) and 50 cases of hypertensive nephropathy (HTN). All biopsies were immunohistochemically stained for D2‑40 and digitized as WSIs. Pathologists provided only slide‑level labels (D2‑40 high vs. D2‑40 low). Tissue regions were automatically segmented, tiled into patches, and encoded using a pretrained convolutional neural network. Patch embeddings were then analyzed with a clustering‑constrained attention multiple‑instance learning (CLAM) model. Unlike conventional multiple-instance learning (MIL) methods that only weight instances, CLAM jointly performs attention‑based instance selection and instance‑level clustering to distinguish positive from negative evidence within each slide, yielding more discriminative slide‑level features and interpretable attention maps. Performance was compared with a classic MIL model trained on the same features.
-
Results
- CLAM achieved area under the receiver operating characteristic curves of 0.942 and 0.858 on the CKD and HTN datasets, respectively, outperforming classic MIL (0.866 and 0.801). Attention maps highlighted lymphatic‑rich regions consistent with renal pathologists’ assessments.
-
Conclusions
- This clustering‑constrained, attention‑based weakly supervised framework enables fully automated, reproducible quantification of renal lymphatic vessel density from WSIs, providing renal pathologists with rapid visual and numerical support for diagnosis and risk stratification in CKD and HTN.
- Artificial intelligence is increasingly used in medical image classification [1], bringing clear benefits to clinical care [2,3]. In this context, digital pathology is transforming traditional pathology workflows [4,5]. Histopathological images—long considered the diagnostic gold standard, especially in oncology [6]—are typically examined manually by pathologists on hematoxylin and eosin (H&E), periodic acid–Schiff, and Masson-stained slides, a process that is highly time‑consuming, labor‑intensive, and dependent on extensive expert training [6].
- Whole‑slide scanning converts tissue on glass slides into high‑resolution digital whole‑slide images (WSIs), which are now widely used for diagnosis in clinical practice. Because disease‑positive regions often occupy only a small fraction of the tissue, WSIs contain a large number of disease‑negative patches, and their typical gigapixel resolution (e.g., 30,000 × 30,000) makes direct analysis challenging. To address this issue, recent work has focused on multi‑level attention‑based frameworks that aim to solve clinical problems using substantially fewer annotations. Notably, seminal multiple-instance learning (MIL)–based approaches—including iterative MIL, task‑specific multi‑level MIL, and deep hierarchical MIL—as well as techniques such as digital pathology image deblurring, have substantially advanced WSI preprocessing and downstream model performance [7-12].
- Through a series of advanced processes, including image auto-detection, annotation, segmentation, training, and evaluation, it progressively extracts features from the input images. This technology transforms imaging information into structured data, ultimately yielding valuable diagnostic insights [13]. Such innovations markedly reduce the workload for pathologists and enhance the efficiency of clinical practice, enabling more timely and accurate diagnoses [14].
- Lymphatic vessels serve as a crucial conduit between adaptive immunity and renal pathology [15,16]. An expanding body of research has confirmed close associations between lymphatic vessels and multiple organ systems, including the central nervous system and the cardiovascular system [17–19]. Similarly, renal lymphatic vessel density is linked to a variety of kidney diseases [15]. For example, increased renal lymphatic density in IgA nephropathy is closely associated with poor prognosis [20]. Our group has also shown correlations between renal lymphatics and IgA nephropathy, membranous nephropathy, and lupus nephritis, and found that lymphatic expansion increases the risk of adverse outcomes such as crescentic glomerulonephritis [15,16].
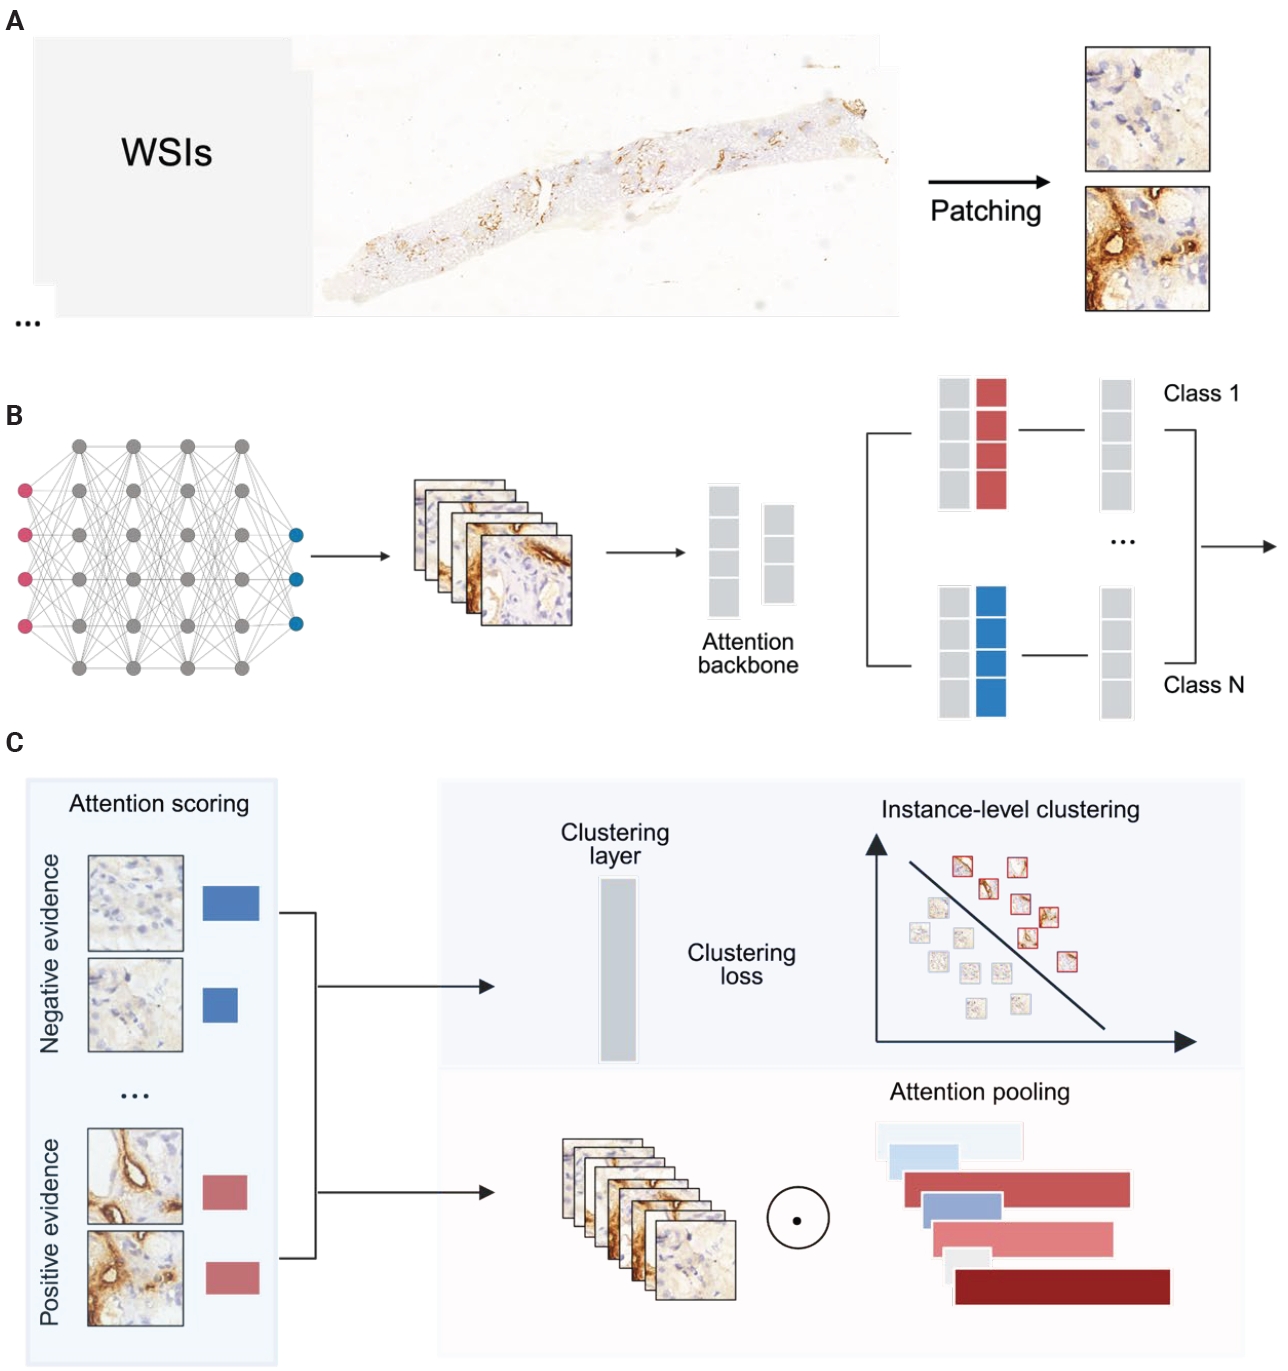
- This study integrates computer vision with weakly supervised learning to analyze renal immunohistochemical WSIs: two independent internal cohorts were collected, all slides were stained for the lymphatic marker D2-40 and digitized, and pathologists provided slide-level annotations classifying WSIs as D2-40 high or D2-40 low; an open-source WSI pipeline automatically segmented tissue and extracted patches, which were passed through a pre-trained convolutional neural network (CNN) to obtain feature vectors that were then fed into an attention-based model, and finally the clustering‑constrained attention multiple‑instance learning (CLAM) algorithm aggregated local patch information into a global slide representation to distinguish slides with high versus low D2-40 expression.
INTRODUCTION
- Renal biopsy specimens
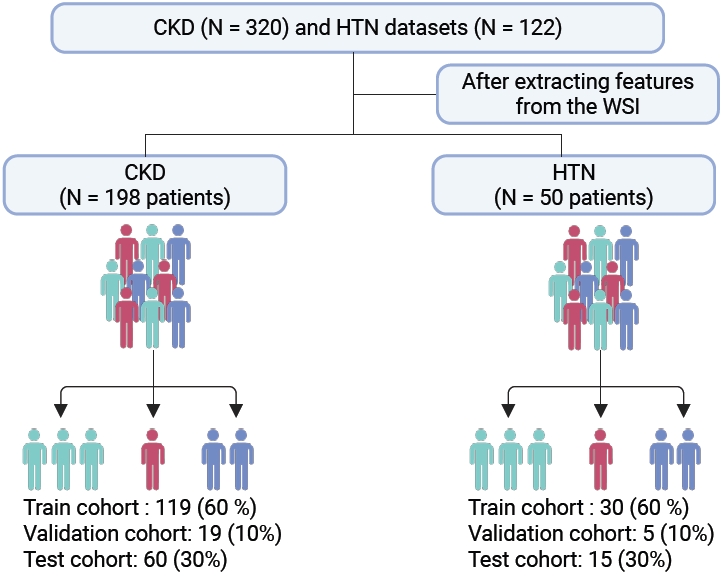
- This study complied with the Declaration of Helsinki and was approved by the Clinical Research Ethics Committee of Huazhong University of Science and Technology (TJ-IRB202303121); all human kidney biopsy specimens were obtained from hospitalized patients in the nephrology department of Tongji Hospital with written informed consent. The cohort comprised 320 chronic kidney disease (CKD) patients and 122 hypertensive nephropathy patients. The inclusion and screening flow of the cohort is shown in Fig. 1.
- Immunohistochemistry
- Paraffin sections were baked at 60°C for 1 hour, dewaxed through graded xylene/ethanol immersions, and subjected to microwave-mediated antigen retrieval. Endogenous peroxidase was blocked with H₂O₂, followed by serum blocking. Slides were incubated with D2-40 antibodies, then treated with secondaries. Imaging employed an Olympus DP73 microscope (Tokyo, Japan); digitization utilized a 3DHistech Pannoramic SCAN platform (3DHISTECH Ltd., Budapest, Hungary).
- Manual annotation
- Three pathology experts independently reviewed and annotated all stained slides. A diagnosis was accepted as ground truth when at least two pathologists agreed. WSIs were labeled as high or low renal lymphatic expression based on D2-40 staining.
- WSIs preprocess
- WSIs were downsampled by 32× and converted from RGB to HSV. Tissue masks were generated using saturation thresholds, refined with median blur and morphological closing. Slides with failed segmentation were excluded, removing 122 slides from dataset 1 and 72 from dataset 2.
- From each tissue mask, 256 × 256 pixel patches were extracted and stored with coordinates and metadata in .h5 files. We used a ResNet-50 pretrained on ImageNet to extract image features during training. Patch size and stride were 256 × 256 and 256, respectively. Each patch was converted into a 1,024-dimensional feature vector. Training was performed on a single consumer-grade GPU with a batch size of 8 (Fig. 2).
- Deep-learning algorithm
- We trained a CLAM framework on slide-level labels and, for comparison, a classical MIL model on the same data. During training, patches were randomly sampled with a batch size of 512. For validation and testing, per-patch predictions within each slide were computed and averaged to obtain slide-level scores. Performance was evaluated every 100,000 patches; early stopping was triggered after 20 epochs without improvement in validation loss. The checkpoint with the lowest validation loss was used for test evaluation for both CLAM and MIL. We utilized the cross-entropy loss function and optimized model parameters using stochastic gradient descent with the Adam optimizer, setting the learning rate at 2 × 10⁻⁴ and a weight decay of 1 × 10⁻⁵. The hyperparameters were configured as follows: β1 = 0.9, β2 = 0.999, and ε = 1 × 10⁻⁸. All models were trained for a minimum of 50 epochs, with the potential to extend training up to 200 epochs if the early stopping criterion was not met. The validation loss was continuously monitored, and early stopping was triggered if no decrease was observed from a previous low for more than 20 consecutive epochs.
- Computational hardware and software
- Segmentation and stitching ran on an Intel i9-13900K CPU; feature extraction and model training used a single NVIDIA RTX 4090 GPU with batch parallelization and SSD-backed streaming. The pipeline was implemented in Python 3.10 using OpenSlide 3.4.1, OpenCV 4.9.0.8, and Pillow 10.3.0. Deep learning models were implemented in PyTorch (CUDA 12.1). Visualizations used matplotlib 3.8.4 and seaborn 0.13.2. The complete processing pipeline for WSIs, alongside the training and evaluation of deep learning models, is accessible at https://github.com/mahmoodlab/CLAM.
- Interpretability and visualization
- Model performance was assessed by area under the receiver operating characteristic (ROC) curve (AUC) and average classification error. Principal component analysis (PCA) was applied to patch-level features to visualize separation between D2-40 high and low WSIs. Data efficiency was examined using 25%, 50%, 75%, and 100% subsets. To illustrate discriminative regions, attention-derived heatmaps were generated to map lymphatic-rich areas across high and low D2-40 expression slides.
- Statistical analysis
- The AUC of the receiver-operating-characteristic curve was estimated using the Mann-Whitney U statistic, for which the algorithmic implementation is provided in the scikit-learn scientific computing library. For comparisons of multiple AUCs, we used the nonparametric Friedman test.
MATERIALS AND METHODS
Segmentation
Patching and feature extracting
- Model performance
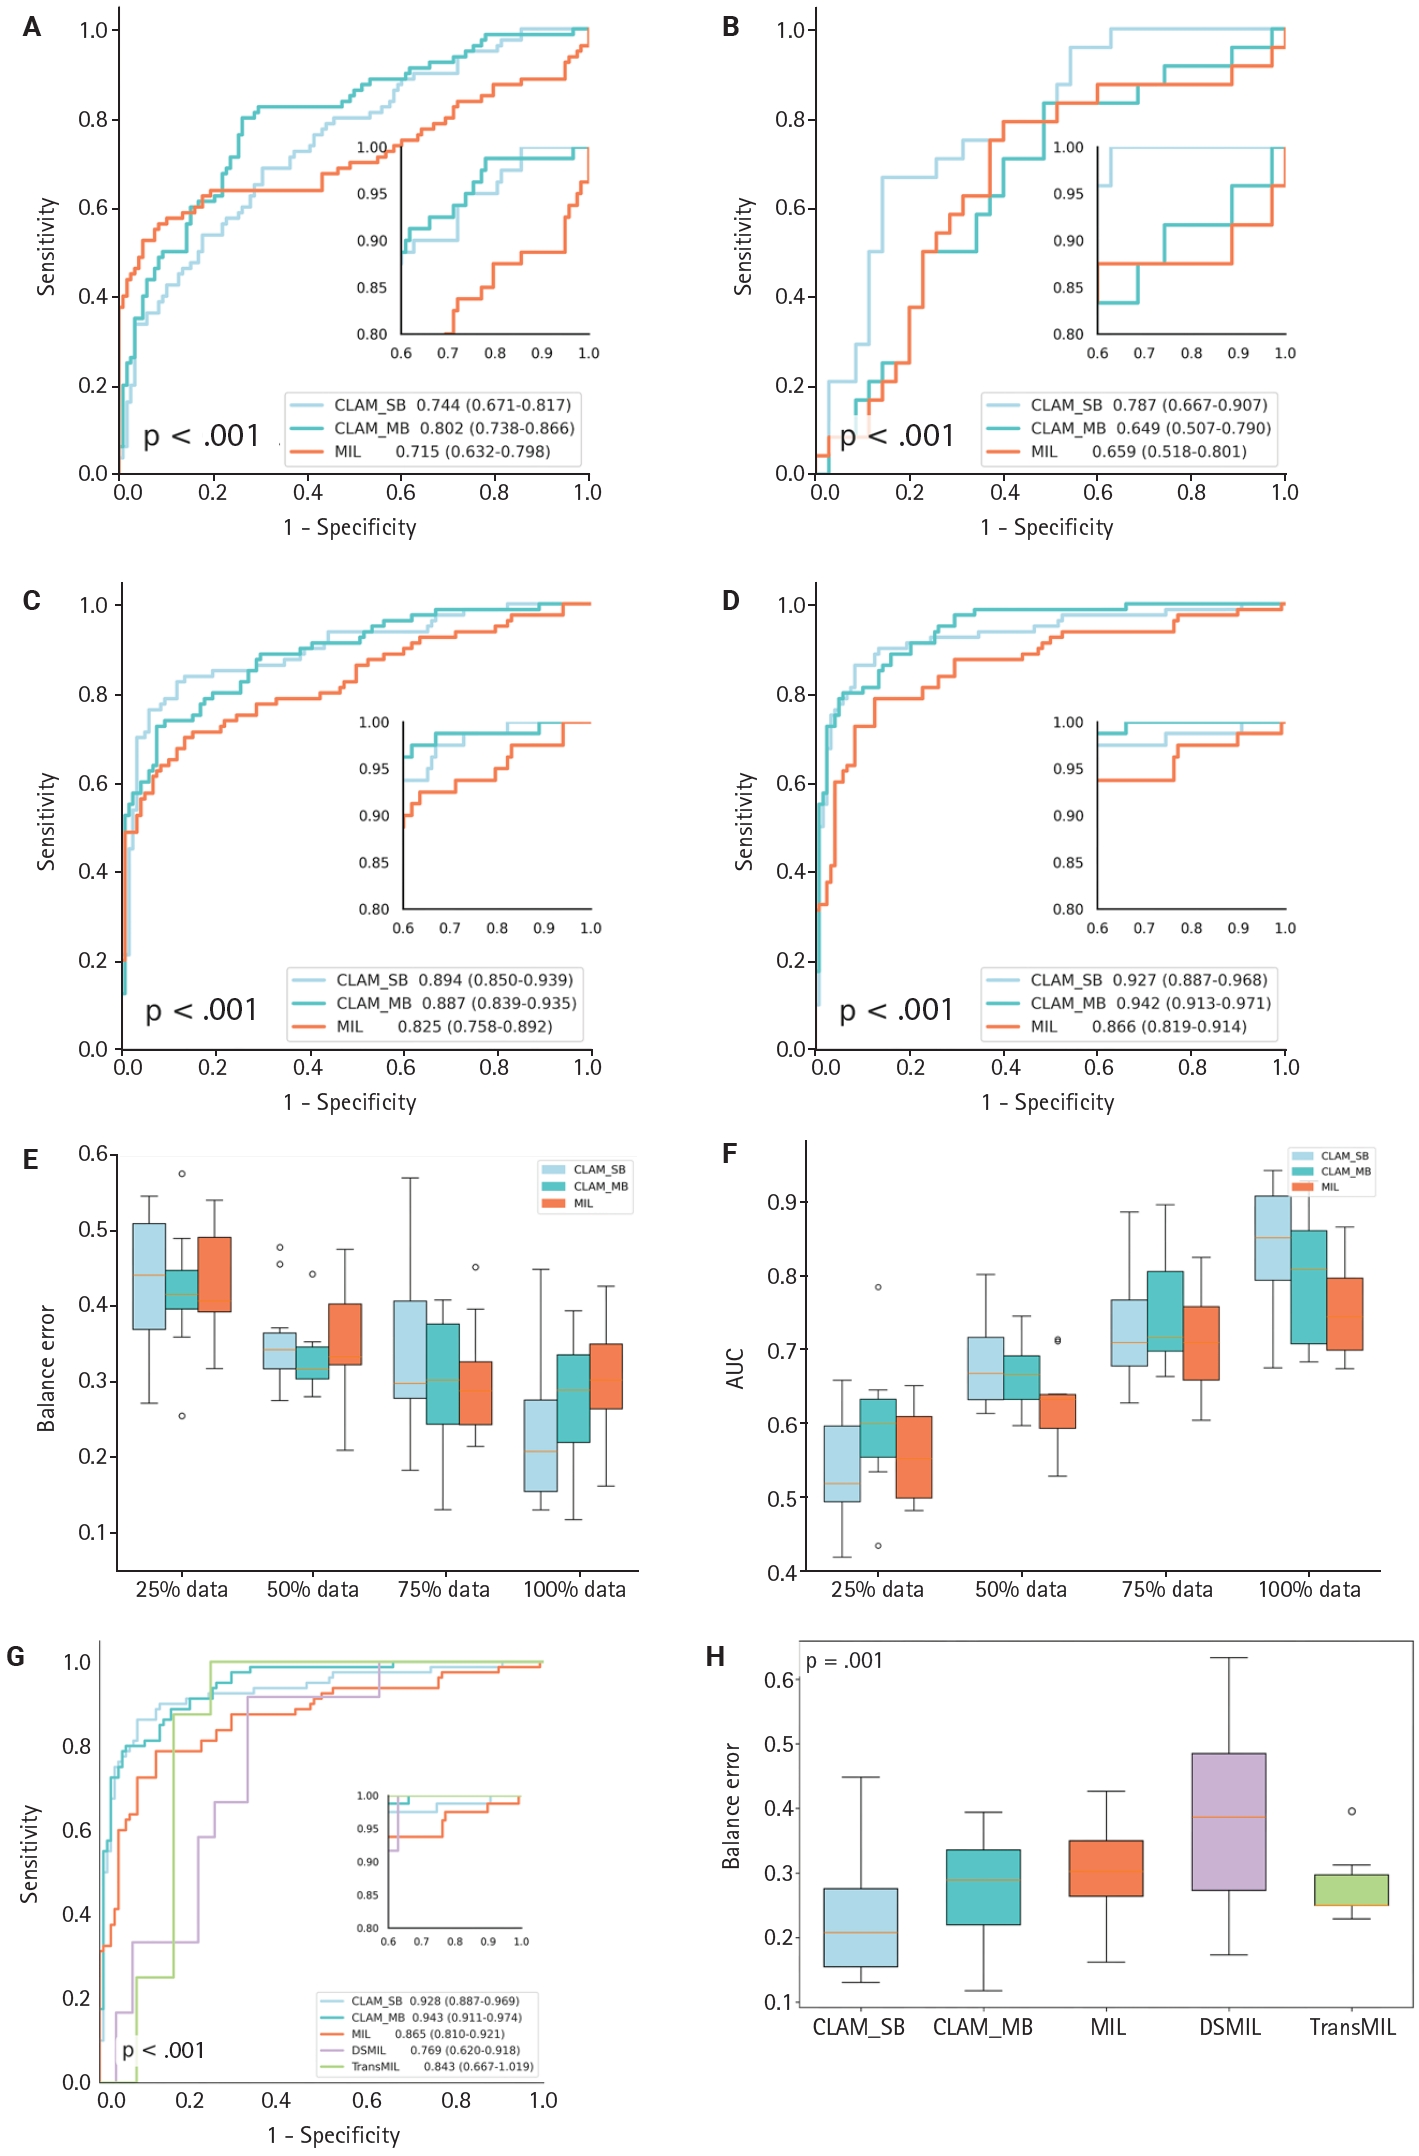
- To evaluate the CLAM algorithm with different attention branches, we trained models using a single attention branch (CLAM_SB) and multiple attention branches (CLAM_MB). On a WSI dataset of CKD, CLAM_MB achieved an AUC of 0.942 (0.913–0.971) (Fig. 3D), while CLAM_SB reached an AUC of 0.927 (0.887–0.968); the classic MIL method obtained an AUC of 0.866 (0.819–0.914). Although CLAM_MB yielded the highest AUC, CLAM_SB produced better sensitivity and specificity across datasets (Fig. 3A–C, F) and a lower balanced error (Fig. 3E) compared with both CLAM_MB and MIL (Fig. 3F). We also compared the performance of two additional attention‑mechanism variants—dual‑stream MIL (DSMIL) and Transformer MIL (TransMIL)—on the CKD dataset. Their AUCs were 0.769 (0.620–0.918) and 0.843 (0.667–1.000), respectively, and both showed higher balanced error than CLAM (Fig. 3G, H).
- To assess the effect of data volume on performance, we compared the CLAM model trained with 50 (25%), 99 (50%), 148 (75%), and 198 (100%) cases. The model exceeded an AUC of 90% on the CKD dataset only when trained with the full dataset (198 cases) (Supplementary Fig. S1). PCA visualization showed that after using more than 75% of the data (148 cases), classification of high-expression and low-expression D2-40 WSIs reached saturation, with no appreciable difference in category separation between the 75% and 100% training sets.
- Model generalization
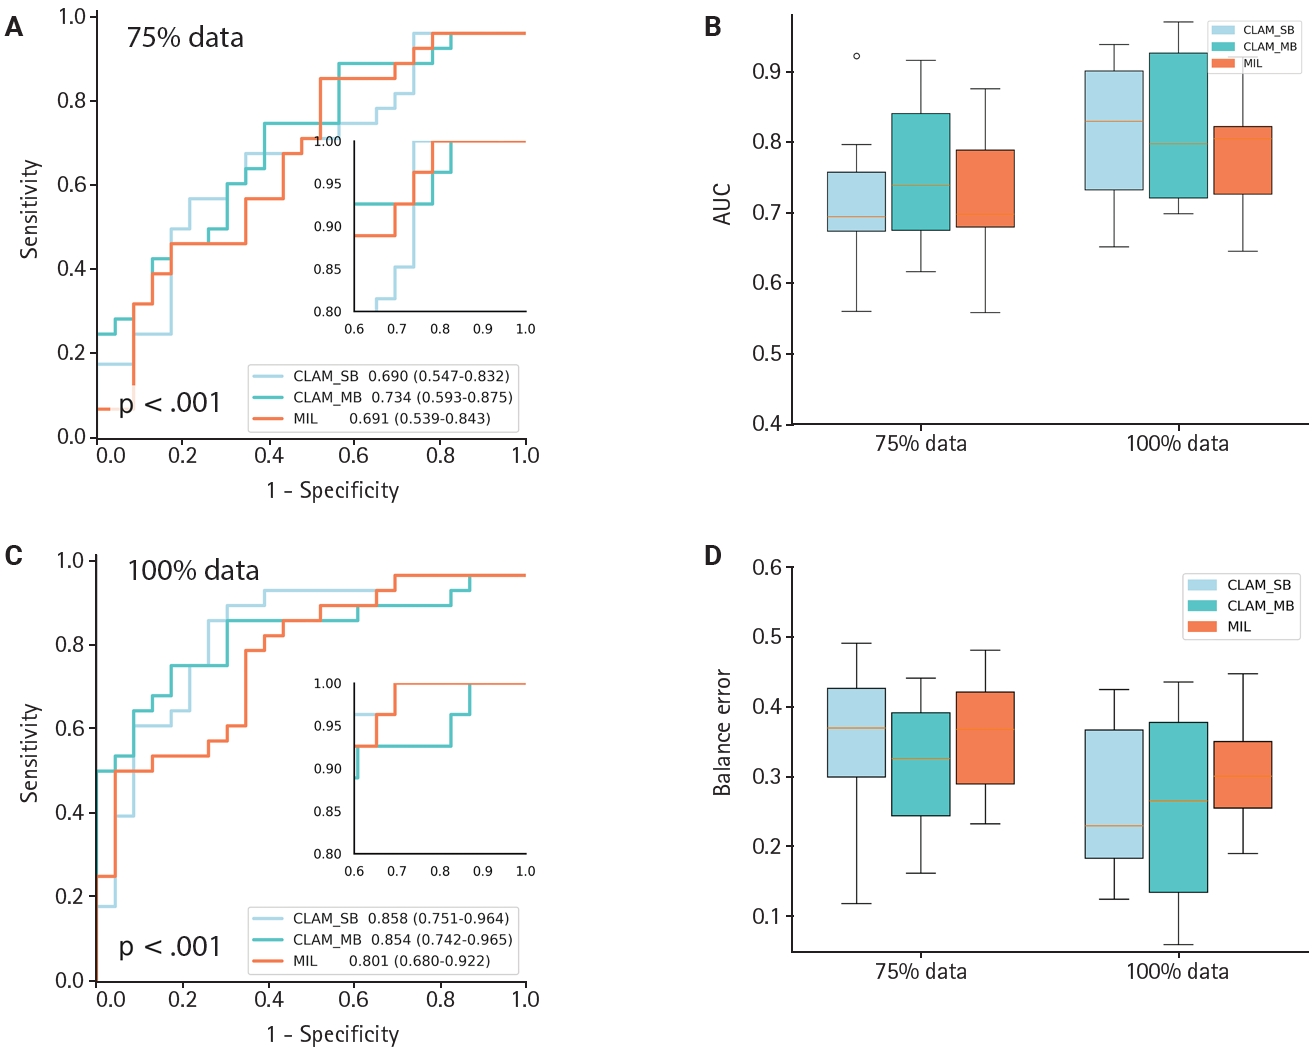
- To evaluate generalization across datasets, we collected an independent set of hypertensive nephropathy WSIs stained with the lymphatic marker D2-40 and scanned at pixel resolution. The CLAM algorithm showed comparable discriminative performance on this hypertensive nephropathy cohort, achieving an AUC of 0.854 (0.742–0.965) (Fig. 4C) and a low balanced error of ~0.22 (Fig. 4D), regardless of whether CLAM_SB or CLAM_MB was used. When comparing models trained with 75% versus 100% of the data, CLAM_SB had an AUC of 0.690 (0.547–0.837), lower than CLAM_MB which reached 0.734 (0.593–0.875) at 75% (Fig. 4A, B); however, CLAM_SB outperformed CLAM_MB when trained on the full dataset, a difference that may reflect the small sample size. Overall, the weakly supervised CLAM algorithm demonstrated strong generalization across model variants. In contrast, the MIL model yielded an AUC of 0.801 (0.680–0.922) with a balanced error near 0.3. Because of sample-size constraints, PCA visualization was generated only for the 75% and 100% scenarios (Supplementary Fig. S2); notably, CLAM maintained robust discrimination even with as few as 50 cases.
- Interpretation and visualization
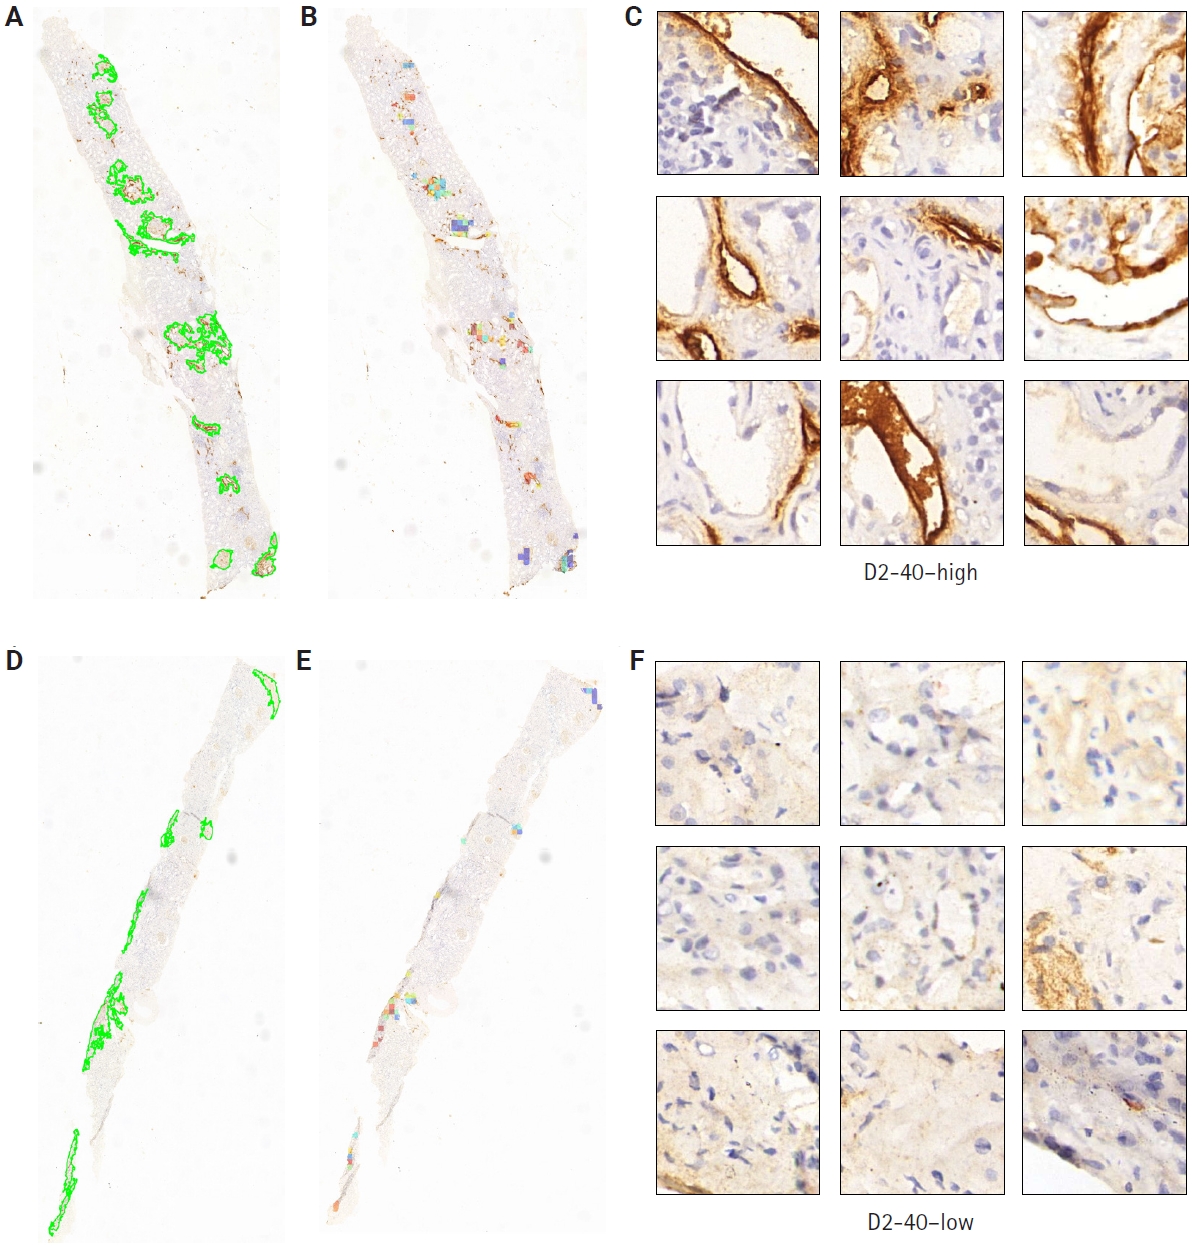
- Clinical pathologists base their diagnoses on staining patterns and cellular morphology observed under high magnification. To clarify how our deep learning model differentiates pathological slides, we incorporated an attention mechanism. Patches with high attention scores from CLAM were converted into percentages to create a normalized focus map that was mapped back to the original WSI coordinates, corresponding to high D2-40 expression regions, while low-attention areas corresponded to low D2-40 expression. This spatial attention map closely matched assessments made by simulated renal pathologists. From the automatically segmented D2-40 high and D2-40 low WSI labels, we selected nine high-magnification views for comparison: the nine high-attention patches showed markedly more prominent and darker lymphatic structures and staining than the low-attention patches (Fig. 5). To further demonstrate discriminative performance for the binary task, we overlaid heat maps to highlight color-coded regions; these heat maps offer supplementary diagnostic information that can aid pathologists’ interpretation.
RESULTS
- This study employed a weakly supervised learning algorithm to identify renal lymphatic vessel density in a CKD dataset and found that this deep learning approach outperformed traditional MIL algorithms as well as MIL variants DSMIL and TransMIL in terms of model performance. It offers a potential alternative to the current inefficient and subjective manual annotation of pathology slides.
- Since the introduction of large language models like ChatGPT in 2022 [17], a new era of artificial intelligence in computational pathology has begun. Open-source WSI-based pathology models such as cPath, TriPath, and Prov-GigaPath have sped up progress and reduced the need for manual annotations [18-21]. However, these models are mainly trained on H&E-stained tumor slide databases (e.g., TCGA, CAMELYON16/17) [22-24]. In renal pathology, most cases are non-tumor CKDs—such as IgA nephropathy, membranous nephropathy, and hypertensive nephropathy—and their diagnosis still depends on detailed pathological evaluation.
- Lymphatic vessels serve as key immune conduits in kidney disease. Our 2019 study showed that renal injury triggers lymphatic endothelial cells to secrete CCL21 (C–C motif chemokine ligand 21), recruiting CCR7+ (C–C chemokine receptor type 7–positive) dendritic cells from renal lymph nodes. These dendritic cells activate lymph node–resident immune cells that return to the kidney via lymphatics, exacerbating inflammation and fibrosis [15]. Lopez Gelston et al. [25] further demonstrated that renal lymphatic expansion in hypertension promotes sodium and water excretion, reducing blood pressure. These findings highlight the dual roles of lymphatic vessels in immune signaling and fluid homeostasis in renal pathophysiology. Between 2020 and 2021, several studies elucidated key functions of renal lymphatic vessels in disease pathogenesis [26,27]. Increased renal lymphatic vessel density serves as an immune sentinel and is closely associated with fibrosis and inflammation. Recent investigations show that lymphangiogenesis regulates blood pressure in salt-sensitive hypertension by promoting renal sodium excretion [28]. Enhanced lymphatic vessel formation accelerates sodium ion excretion, thereby lowering blood pressure [29]. Therefore, renal lymphatic vessel expression is clinically important for diagnosing and treating CKD.
- In routine practice, pathologists select several fields for immunostaining rather than reviewing every high-magnification field, introducing subjectivity. To reduce bias and workload, we integrated machine learning with pathology using a CNN with attention scoring to predict pixel-level signals on WSIs. We applied the Mahmood lab's CLAM algorithm to an internal CKD dataset for the first time [30]. This high-throughput, interpretable method classifies WSIs with slide-level labels, avoiding region of interest extraction and patch annotations [31,32]. CLAM achieved an ROC of 0.99 on H&E renal tumor slides and supports binary and multiclass tasks with ROCs above 0.95 [33]. On CKD datasets, CLAM performed with ROC values near 0.95 and consistently outperformed classical MIL methods across different data sizes [33-36]. Similar advantages were observed in an internal hypertensive nephropathy dataset. Overall, CLAM generalizes well across datasets with different distributions and sample sizes, demonstrating successful integration of deep learning with CKD research.
- Although our CKD slides are limited, studying renal lymphatic vessels is important. Our dataset can serve as an internal resource to boost future large‑scale models for lymphatic analysis in kidney disease. Clinically, lymphatic vessel expression is still scored manually; integrating our model into workflows could aid pathologists and save resources. This workflow can be broadly divided into the following components: First, we can label and scan patients' renal lymphatic-stained slides. Next, import the WSI pixel data into an image-analysis pipeline built on a pretrained model to perform patching, feature extraction, semantic segmentation, attention scoring, and visualization with heatmaps on renal biopsy specimens. Finally, the system provides lymphatic vessel count grading and risk stratification. This approach not only reduces patients' waiting time for results but also assists experienced pathologists in analyzing more challenging images.
- However, this work still has certain limitations. For example, the WSI data come from a single center and there is staining variability between slides; finally, the determination of lymphatic vessel counts involves a degree of subjectivity.
- In summary, this study applied a weakly supervised learning algorithm to a CKD dataset to quantify renal lymphatic vessel density, yielding a tool that can support clinical diagnosis and risk stratification in kidney disease.
DISCUSSION
Supplementary Information
Ethics Statement
This research was conducted in accordance with the principles outlined in the Declaration of Helsinki. The use of all human tissue samples received approval from the Clinical Research Ethics Committee of Huazhong University of Science and Technology (TJ-IRB202303121). Human kidney biopsy specimens were obtained from hospitalized patients in the nephrology department of Tongji Hospital, with the informed consent of the patients secured through signed consent forms.
Availability of Data and Material
All the information required to assess the conclusions of this paper can be found within the paper itself and the Supplementary Materials. Any further data related to this study can be obtained by contacting the authors.
Code Availability
Not applicable.
Author Contributions
Conceptualization: XX, GX. Data curation: YL. Formal analysis: GP. Investigation: XX. Funding acquisition: GX. Methodology: XX. Project administration: RZ. Resources: GX. Software: XX. Supervision: RZ, GX. Validation: GP. Visualization: XX. Writing—original draft: XX. Writing—review & editing: GP. Approval of final manuscript: all authors.
Conflicts of Interest
The authors declare that they have no potential conflicts of interest.
Funding Statement
This work was supported in part by projects from National Nature Science Foundation of China (No. 82070739) and the Major Research Plan of the National Natural Science Foundation of China (No. 82230021).

- 1. Nagendran M, Chen Y, Lovejoy CA, et al. Artificial intelligence versus clinicians: systematic review of design, reporting standards, and claims of deep learning studies. BMJ 2020; 368: m689.ArticlePubMedPMC
- 2. Litjens G, Kooi T, Bejnordi BE, et al. A survey on deep learning in medical image analysis. Med Image Anal 2017; 42: 60-88. ArticlePubMed
- 3. Chen RJ, Wang JJ, Williamson DF, et al. Algorithmic fairness in artificial intelligence for medicine and healthcare. Nat Biomed Eng 2023; 7: 719-42. ArticlePubMedPMCPDF
- 4. Madabhushi A, Lee G. Image analysis and machine learning in digital pathology: challenges and opportunities. Med Image Anal 2016; 33: 170-5. ArticlePubMedPMC
- 5. Niazi MK, Parwani AV, Gurcan MN. Digital pathology and artificial intelligence. Lancet Oncol 2019; 20: e253-61. ArticlePubMedPMC
- 6. Swanson K, Wu E, Zhang A, Alizadeh AA, Zou J. From patterns to patients: Advances in clinical machine learning for cancer diagnosis, prognosis, and treatment. Cell 2023; 186: 1772-91. ArticlePubMed
- 7. Zhou Y, Lu Y. Deep hierarchical multiple instance learning for whole slide image classification. In: 2022 IEEE 19th International Symposium on Biomedical Imaging (ISBI); 2022 Mar 28-31; Kolkata, India. Article
- 8. Zhou Y, Lu Y. Multiple instance learning with critical instance for whole slide image classification. In: 2023 IEEE 20th International Symposium on Biomedical Imaging (ISBI); 2023 Apr 18-21; Cartagena, Colombia. Article
- 9. Li B, Li Y, Eliceiri KW. Dual-stream multiple instance learning network for whole slide image classification with self-supervised contrastive learning. Conf Comput Vis Pattern Recognit Workshops 2021; 2021: 14318-28. ArticlePubMedPMC
- 10. Zhou Y, Lu Y. Multiple instance learning with task-specific multi-level features for weakly annotated histopathological image classification. In: ICASSP 2022 - 2022 IEEE International Conference on Acoustics, Speech and Signal Processing (ICASSP); 2022 May 23-27; Singapore. Article
- 11. Zhou Y, Che S, Lu F, et al. Iterative multiple instance learning for weakly annotated whole slide image classification. Phys Med Biol 2023; 68: 155007.ArticlePDF
- 12. Shao Z, Bian H, Chen Y, et al. TransMIL: transformer based correlated multiple instance learning for whole slide image classification. Adv Neural Inf Process Syst 2021; 34: 2136-47.
- 13. van der Laak J, Litjens G, Ciompi F. Deep learning in histopathology: the path to the clinic. Nat Med 2021; 27: 775-84. ArticlePubMedPDF
- 14. Huang Z, Yang E, Shen J, et al. A pathologist-AI collaboration framework for enhancing diagnostic accuracies and efficiencies. Nat Biomed Eng 2025; 9: 455-70. ArticlePubMedPDF
- 15. Pei G, Yao Y, Yang Q, et al. Lymphangiogenesis in kidney and lymph node mediates renal inflammation and fibrosis. Sci Adv 2019; 5: eaaw5075. ArticlePubMedPMC
- 16. Hu D, Wang Z, Wang S, et al. Lymphatic vessels in patients with crescentic glomerulonephritis: association with renal pathology and prognosis. J Nephrol 2024; 37: 1285-98. ArticlePubMedPDF
- 17. Vaswani A, Shazeer N, Parmar N, et al. Attention is all you need. arXiv 1706.03762 [Preprint]. 2017 [cited 2025 Oct 30]. Available from: https://doi.org/10.48550/arXiv.1706.03762. Article
- 18. Vaidya A, Chen RJ, Williamson DF, et al. Demographic bias in misdiagnosis by computational pathology models. Nat Med 2024; 30: 1174-90. ArticlePubMedPDF
- 19. Song AH, Williams M, Williamson DF, et al. Analysis of 3D pathology samples using weakly supervised AI. Cell 2024; 187: 2502-20. ArticlePubMedPMC
- 20. Xu H, Usuyama N, Bagga J, et al. A whole-slide foundation model for digital pathology from real-world data. Nature 2024; 630: 181-8. ArticlePubMedPMCPDF
- 21. Wang CW, Huang SC, Lee YC, Shen YJ, Meng SI, Gaol JL. Deep learning for bone marrow cell detection and classification on whole-slide images. Med Image Anal 2022; 75: 102270.ArticlePubMed
- 22. Kather JN, Heij LR, Grabsch HI, et al. Pan-cancer image-based detection of clinically actionable genetic alterations. Nat Cancer 2020; 1: 789-99. ArticlePubMedPMCPDF
- 23. Fu Y, Jung AW, Torne RV, et al. Pan-cancer computational histopathology reveals mutations, tumor composition and prognosis. Nat Cancer 2020; 1: 800-10. ArticlePubMedPDF
- 24. Litjens G, Bandi P, Ehteshami Bejnordi B, et al. 1399 H&E-stained sentinel lymph node sections of breast cancer patients: the CAMELYON dataset. Gigascience 2018; 7: giy065.ArticlePubMedPMCPDF
- 25. Lopez Gelston CA, Balasubbramanian D, Abouelkheir GR, et al. Enhancing renal lymphatic expansion prevents hypertension in mice. Circ Res 2018; 122: 1094-101. ArticlePubMed
- 26. Barisoni L, Lafata KJ, Hewitt SM, Madabhushi A, Balis UG. Digital pathology and computational image analysis in nephropathology. Nat Rev Nephrol 2020; 16: 669-85. ArticlePubMedPMCPDF
- 27. Donnan MD, Kenig-Kozlovsky Y, Quaggin SE. The lymphatics in kidney health and disease. Nat Rev Nephrol 2021; 17: 655-75. ArticlePubMedPDF
- 28. Zhuang T, Lei Y, Chang JJ, et al. A2AR-mediated lymphangiogenesis via VEGFR2 signaling prevents salt-sensitive hypertension. Eur Heart J 2023; 44: 2730-42. ArticlePubMedPMCPDF
- 29. Goodlett BL, Balasubbramanian D, Navaneethabalakrishnan S, et al. Genetically inducing renal lymphangiogenesis attenuates hypertension in mice. Clin Sci (Lond) 2022; 136: 1759-72. ArticlePubMedPMCPDF
- 30. Lu MY, Williamson DF, Chen TY, Chen RJ, Barbieri M, Mahmood F. Data-efficient and weakly supervised computational pathology on whole-slide images. Nat Biomed Eng 2021; 5: 555-70. ArticlePubMedPMCPDF
- 31. Nagpal K, Foote D, Liu Y, et al. Development and validation of a deep learning algorithm for improving Gleason scoring of prostate cancer. NPJ Digit Med 2019; 2: 48.ArticlePubMedPMCPDF
- 32. Ehteshami Bejnordi B, Veta M, Johannes van Diest P, et al. Diagnostic assessment of deep learning algorithms for detection of lymph node metastases in women with breast cancer. JAMA 2017; 318: 2199-210. ArticlePubMedPMC
- 33. Nan T, Zheng S, Qiao S, et al. Deep learning quantifies pathologists' visual patterns for whole slide image diagnosis. Nat Commun 2025; 16: 5493.ArticlePubMedPMCPDF
- 34. Hu D, Dong Z, Liang K, Yu H, Wang S, Liu X. High-order topology for deep single-cell multiview fuzzy clustering. IEEE Trans Fuzzy Syst 2024; 32: 4448-59. Article
- 35. Hu D, Alshalali TA, Xu X, Yee PL, Shaikh ZA, Yang J. PAGM: partially-aligned global and marginal multi-view contrastive clustering for facial recognition in consumer electronics. IEEE Trans Consum Electron 2025 Oct 28 [Epub]. https://doi.org/10.1109/TCE.2025.3626525. Article
- 36. Quan H, Li X, Hu D, Nan T, Cui X. Dual-channel prototype network for few-shot pathology image classification. IEEE J Biomed Health Inform 2024; 28: 4132-44. ArticlePubMed
REFERENCES
Figure & Data
References
Citations
 PubReader
 ePub Link
-
 Cite this Article
- Cite this Article
-
- Close
- Download Citation
- Close
- Figure
-