Digital image analysis–based quantification of p53 immunohistochemistry in gastric cancer: a systematic comparison of three-tier cutoff-derivation strategies in tissue microarrays
Article information

Abstract
Background
p53 immunohistochemistry (IHC) is a common surrogate for TP53 alteration, but in gastric cancer, its concordance is imperfect and depends on a non-standardized cutoff. Digital pathology enables H-score quantification, yet neither its reproducibility nor the choice of cutoff-derivation strategy has been systematically compared.
Methods
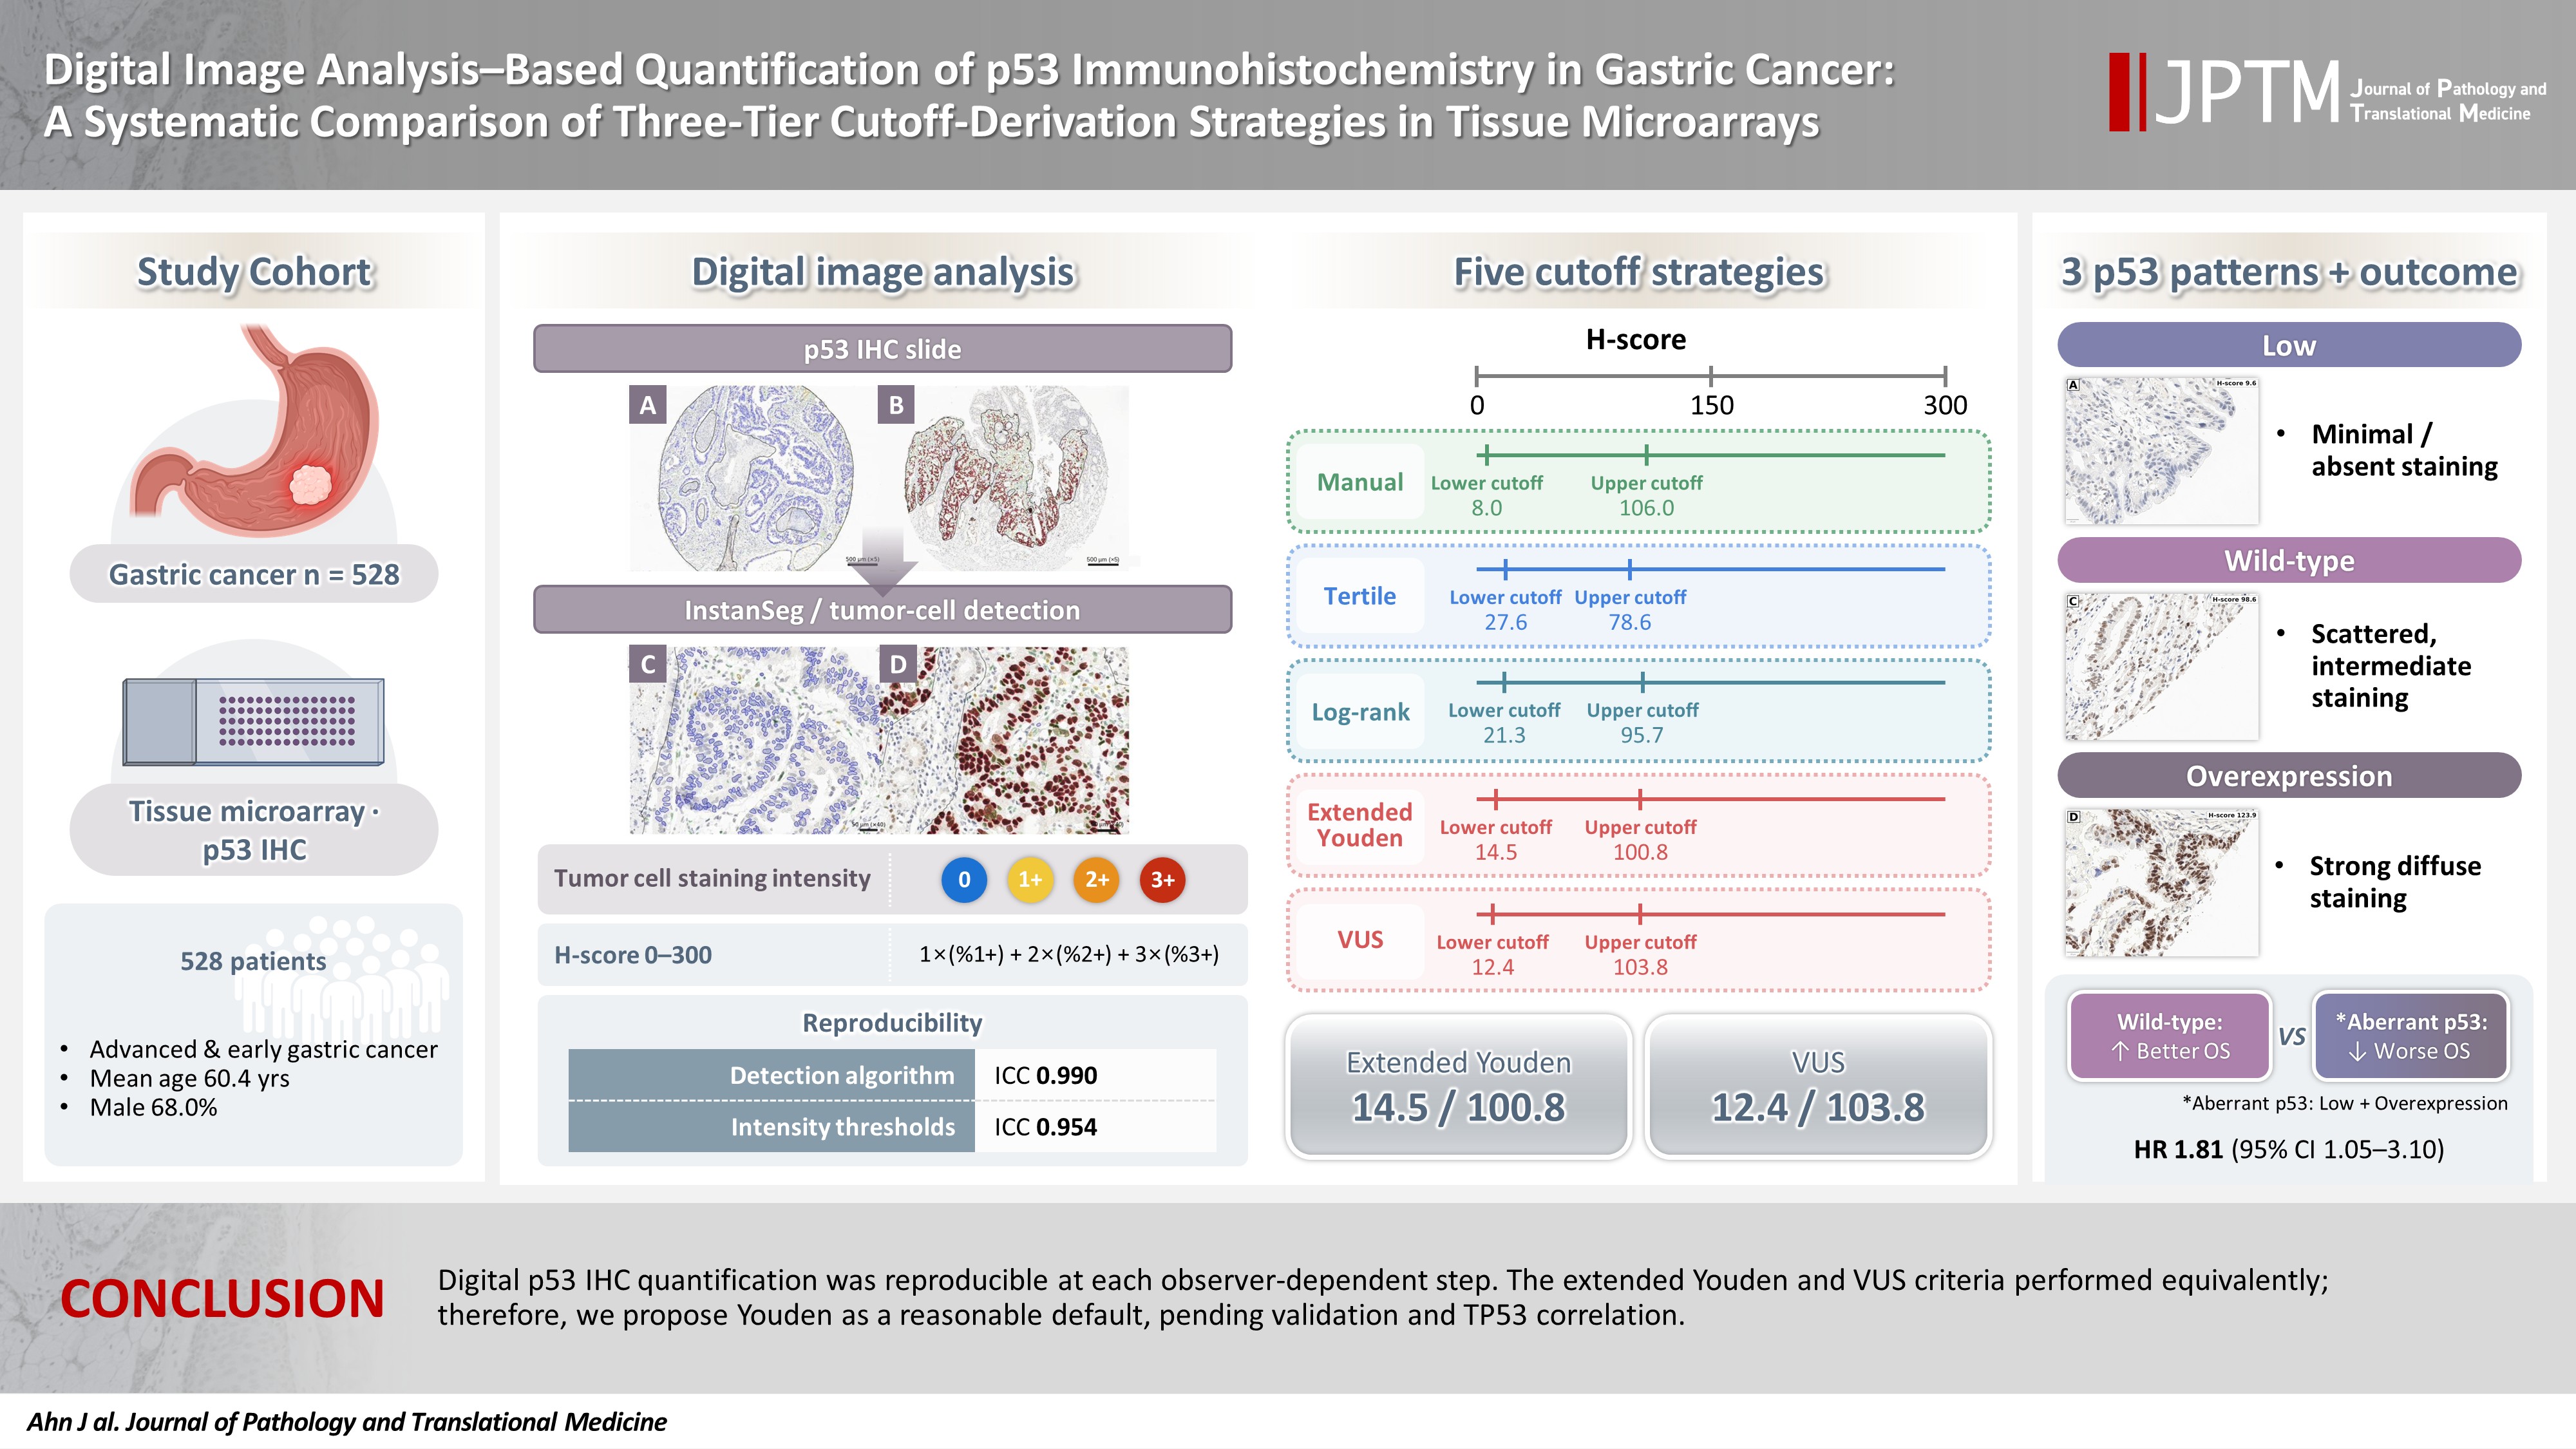
A semi-automated digital workflow quantified p53 IHC in tissue microarrays from 528 gastric cancer patients. Tumor cells were detected with a deep-learning model (InstanSeg), and nuclear staining was expressed as a continuous H-score (0–300). Reproducibility was assessed at each observer-dependent step. Five thresholding strategies were compared: manual cutoffs, tertiles, log-rank optimization, the extended Youden index, and volume under the receiver operating characteristic surface (VUS). The latter two strategies used the manual three-tier IHC interpretation as the reference standard.
Results
Quantification was reproducible: two independent manual interpretations agreed in 91.7% of cores (κ = 0.845). The H-score was robust to the detection algorithm (intraclass correlation coefficient, 0.990) and to repeated threshold determination (0.954). H-scores were right-skewed (median, 45.5), and the strategies yielded distinct cutoffs (8.0–27.6 and 78.6–106.0). Log-rank optimization provided the widest separation but lost significance after multiplicity adjustment (p = .168). The extended Youden and VUS cutoffs were statistically indistinguishable. As a supporting check, all classifications showed nominal overall-survival separation, with low and overexpression faring similarly worse than wild-type.
Conclusions
Digital p53 IHC quantification was reproducible at each observer-dependent step. The extended Youden and VUS criteria performed equivalently; therefore, we propose Youden as a reasonable default, pending validation and TP53 correlation.
INTRODUCTION
Gastric cancer remains the fifth most frequently diagnosed malignancy and the fifth leading cause of cancer-related mortality worldwide, according to 2022 global statistics [1]. The tumor suppressor gene TP53 is among the most frequently mutated genes in this malignancy [2]. As a central regulator of cell cycle arrest, DNA repair, and apoptosis, the loss of normal p53 function is a critical hallmark of carcinogenesis [3,4].
Aberrant p53 immunohistochemical phenotypes, particularly the complete null-type and diffuse nuclear overexpression patterns, correlate with TP53 mutational status in gastric adenocarcinoma and can serve as a putative molecular surrogate. However, the concordance is imperfect and varies with the immunohistochemical positivity cutoff and the molecular-histologic subtype [5-10]. These alterations are frequently, though not invariably, associated with more aggressive tumor behavior and a less favorable prognosis, and the strength of this association can vary by tumor type [11,12]. Therefore, precise evaluation of p53 status is important for understanding tumor biology and informing prognosis.
Historically, the status of the p53 protein has been assessed using immunohistochemistry (IHC), with pathologists manually examining samples under a microscope. In clinical practice, p53 IHC results are usually classified into three categories: “null” (no staining), “wild-type” (scattered, weak-to-moderate staining), and “overexpression” (widespread, strong nuclear staining) [13-16]. However, this conventional methodology is subject to significant limitations. Visual assessment is inherently subjective, leading to substantial inter-observer variability, particularly when distinguishing weak staining intensities [17]. Manual grading also often depends on arbitrary thresholds, such as 10%, 50%, or 60% positivity in tumor cells [12,18-20]. This lack of standardized and objective criteria hinders the reproducibility of p53 assessments.
With whole-slide imaging, computational pathology, and automated image analysis, researchers can quantify biomarker expression with high precision and reproducibility [21,22]. Open-source platforms like QuPath [23] enable cell-by-cell detection, classification, and quantification of individual cell staining intensity. This allows for the calculation of continuous metrics like the H-score, which combines staining intensity with the percentage of positive tumor cells. Such an approach significantly reduces the subjectivity associated with manual scoring and offers a reproducible alternative to the arbitrary cutoffs that hinder p53 assessment [24].
Despite these technological advances, a major gap remains in the application of quantitative digital pathology for p53 assessment in gastric cancer. Although modern algorithms can efficiently generate H-scores, there is no widely accepted method for translating these continuous values into clinically useful categories. Previous studies have relied on study-specific cutoffs derived from individual cohorts [25,26], which may lack generalizability or biological intuition. Furthermore, the reproducibility of such digital workflows—across cell-detection algorithms, intensity-threshold determinations, and observers—has rarely been quantified.
To address this deficiency, we analyzed a clinically annotated cohort of 528 gastric cancer patients, assembled on tissue microarrays, to perform a digital assessment of nuclear p53 expression. We applied a semi-automated workflow to calculate p53 H-scores and subsequently evaluated five distinct strategies for defining expression cutoffs: manual H-score cutoffs, tertile-based statistical distribution, exhaustive log-rank survival optimization, an extended Youden index for three-group classification, and a three-dimensional receiver operating characteristic (ROC) surface (volume under the ROC surface [VUS]) method.
The aim of this study was to establish a framework for translating continuous p53 H-scores into three-tier categories. We achieved this by systematically comparing five cutoff-derivation strategies and assessing the reproducibility of the workflow. Survival stratification was used as a supporting check of the resulting cutoffs, rather than as the primary endpoint.
MATERIALS AND METHODS
Patient cohort and tissue microarray construction
The study population comprised patients who underwent curative gastrectomy for primary gastric adenocarcinoma at Kangbuk Samsung Hospital between January 2011 and December 2014. All patients received either a total or subtotal gastrectomy. From an initial pool of 616 consecutive patients, 54 cases were excluded because their corresponding tissue microarray (TMA) cores contained no tumor (e.g., only normal mucosa), leaving 562 evaluable tumor-bearing cores. Since survival data are used only by the log-rank–optimized cutoff among the five strategies, an additional 17 cases with no survival or follow-up data were excluded. This ensured that all methods could be derived and compared on an identical cohort. Finally, 17 cores with fewer than 100 detected tumor cells by either the InstanSeg or Legacy classifier were excluded to ensure reliable H-score quantification [24]. The final analytic cohort therefore consisted of 528 gastric cancer cases (patient flow: 616 → −54, no tumor → −17, no survival data → −17, <100 detected tumor cells → 528) (Supplementary Fig. S1). The cohort included 209 patients with advanced gastric cancer (AGC; 39.6%) and 319 patients with early gastric cancer (EGC; 60.4%). The mean age at surgery was 60.4 ± 12.4 years (range, 29 to 91 years), with a male predominance (359 men, 68.0%; 169 women, 32.0%). Detailed clinicopathologic variables (TNM stage, histologic grade, resection margin status, etc.) were extracted from the hospital’s prospectively maintained cancer registry. The median follow-up duration was 60.5 months (range, 0.3 to 103.9 months; mean ± standard deviation, 55.1 ± 26.0 months).
Representative tumor regions were identified on the corresponding hematoxylin and eosin slide. From each case, a single cylindrical core of 2.0 mm diameter was taken and arrayed into recipient blocks, each accommodating up to 60 cases.
Immunohistochemical staining for p53
Formalin-fixed, paraffin-embedded TMA blocks were sectioned at 4 µm, mounted on glass slides, and baked at 60°C for 1 hour to ensure tissue adherence. Immunostaining for p53 was performed on a Leica BOND-III automated staining platform (Leica Biosystems, Wetzlar, Germany), which carried out on-board dewaxing, heat-induced epitope retrieval, antibody incubation, and detection. Heat-induced epitope retrieval was performed using BOND Epitope Retrieval Solution 1 (ER1, citrate-based, pH 6) for 20 minutes. The primary mouse monoclonal antibody clone DO-7 (Dako, Glostrup, Denmark) was applied at a dilution of 1:300. Immunoreactivity was visualized using the BOND Polymer Refine Detection kit with 3,3′-diaminobenzidine (DAB) as the chromogen, according to the manufacturer’s standard protocol. All TMA blocks were stained in a single run using the same antibody lot to minimize staining batch effects.
Manual three-tier IHC interpretation of p53 expression
The stained TMA slides were independently examined by two pathologists (S.W.C. and K.K.) blinded to all clinicopathologic data. Each pathologist assessed the nuclear p53 immunostaining and assigned one of three intensity grades. Grade 0, a “null pattern,” indicated the complete absence of staining in tumor cell nuclei. Grade 1, a “wild-type pattern,” was assigned when at least 10% of tumor cells exhibited weak to moderate nuclear staining. Grade 2, an “overexpression pattern,” indicated strong nuclear staining in at least 60% of tumor cells [5,6]. For downstream analyses, grade 1 was interpreted as wild-type p53 expression. Grades 0 (complete loss) and 2 (strong overexpression) were regarded as mutant-pattern (aberrant) p53 expression, reflecting the well-established association between TP53 genomic alterations and either total loss or protein accumulation [6,13]. Interobserver agreement between the two independent readings was high: 500 of 545 cores were concordant (91.7%; Cohen’s κ = 0.845; weighted κ = 0.861) (Supplementary Table S1). All 45 discordances occurred between adjacent categories; no core was classified as null by one pathologist and as overexpression by the other. Discordant cores were subsequently reconciled in a joint review by three pathologists (S.W.C., K.K., and J.A.). The resulting consensus classification served as the reference standard for the extended-Youden and VUS analyses.
Digital slide processing and tumor region annotation
Whole-slide images of the TMA blocks were generated on an Aperio GT 450 scanner (Leica Biosystems, Vista, CA, USA) at a resolution of 0.26 µm per pixel. Identical scanning settings were used for all slides to minimize scanner-related batch effects. The resulting high-resolution images were imported into the open-source digital pathology platform QuPath version 0.7.0 (University of Edinburgh) for downstream analysis. The first step in QuPath was a de-arraying procedure that automatically identified and separated each 2.0 mm diameter core from the composite slide, creating individual whole-core images for independent examination. Tumor regions on each core were then manually annotated using QuPath’s polygon drawing tool by two pathologists (K.K. and B.S.) and subsequently reviewed by a third (S.W.C.). Errors identified during review were corrected in consultation with the pathologist who made the original annotation. Normal mucosa, stromal tissue, and necrosis were excluded from the annotations. Because this process yielded a single reviewed annotation set rather than independent duplicate annotations of the same cores, interobserver variability of tumor annotation could not be quantified. Color deconvolution was applied to separate the DAB and hematoxylin channels. A single H-DAB stain vector set (hematoxylin, 0.69466/0.58636/0.41669; DAB, 0.38793/0.56464/0.72848) was defined for this cohort and applied uniformly to every slide (Supplementary Methods). As all slides were stained in a single run and digitized on a single scanner, using one deconvolution matrix ensured that optical-density values, and thus H-scores, were directly comparable across cores. Each core was individually reviewed during de-arraying and annotation; 54 cores with no evaluable tumor were excluded. Within the retained cores, normal mucosa, stroma, necrosis, and staining artifacts were excluded from the annotated tumor regions. Subsequent analyses were performed on these annotated areas.
Cell detection and tumor cell classification
Within the annotated tumor regions, cell detection was performed using two independent algorithms for comparison: a deep-learning instance-segmentation model (InstanSeg) [27] and QuPath’s built-in watershed-based cell detection (“legacy” detection), which utilized the “optical density sum” setting to enhance sensitivity to the DAB chromogenic signal. InstanSeg served as the primary detector, while the legacy watershed detector was retained as a robustness comparator. For each cell in the tumor compartment, the algorithm generated nucleus-centered detection objects. To differentiate tumor cells from non-malignant stromal and immune cells, a Random Trees object classifier was trained on a set of manually labeled cells (539 cells for the InstanSeg classifier). For classifier training, all available morphological and intensity features generated by QuPath were used, with the exception of the DAB optical density itself. This ensured that the classification was based on shape, size, texture, and other independent parameters. The feature set included hematoxylin optical density, nuclear and cell morphometry, and Haralick texture features computed at 1 and 2 µm per pixel. All DAB-derived features were excluded, making tumor-cell identification independent of p53 staining intensity. Pathologists manually labeled representative cells as “tumor” or “other” (encompassing stromal and immune cells) to create the training set for the Random Trees classifier. After training, the classifier was applied to all detected cells, assigning each to either the tumor cell or the “other” class. Its classification accuracy was validated separately for each detection method against a two-pathologist consensus ground truth of 500 independently labeled cells. For the primary InstanSeg detector, the classifier achieved 90.4% accuracy (Cohen’s κ = 0.81; tumor-cell F1 = 0.90), which approached the interobserver agreement of the reference labels themselves (weighted κ ≈ 0.87–0.88). Detailed information regarding the cell-detection settings (InstanSeg model configuration and QuPath watershed parameters), the Random Trees classifier training design (numbers of labeled cells and cases, and the feature set), the full validation procedures with per-class metrics, and the legacy-detector comparison are provided in the Supplementary Methods (Supplementary Tables S2 and S3, Supplementary Fig. S2).
Classification of p53 staining intensity
The staining intensity of each tumor cell was quantified using the mean nuclear DAB optical density. The optical density cut-points for the conventional intensity categories—negative, weak (1+), moderate (2+), and strong (3+)—were determined empirically rather than fixed a priori. For each grade, at least 50 representative tumor cells (typically 50 to 70) were manually labeled by a single pathologist (S.W.C.), and their mean nuclear DAB optical densities were recorded. The cut-point between adjacent grades was set at the midpoint of their mean optical densities. To account for measurement uncertainty, the same pathologist repeated this procedure on three independent sets of cells from different tissue-microarray images, resulting in three threshold sets (v1a, v1b, and v1c). The agreement among these three determinations was high (intraclass correlation coefficient [ICC], 0.954 for InstanSeg and 0.957 for Legacy). The mean of the three thresholds was used to compute the H-scores in all primary analyses; using the median yielded nearly identical values (ICC, 0.997 and 0.996) and identical three-tier assignments in 98.3% and 97.5% of cores (Supplementary Table S4). For visualization, tumor cells were color-coded by intensity (negative, blue; 1+, yellow; 2+, orange; 3+, red), while other cells were labeled in varying shades of green (Fig. 1).
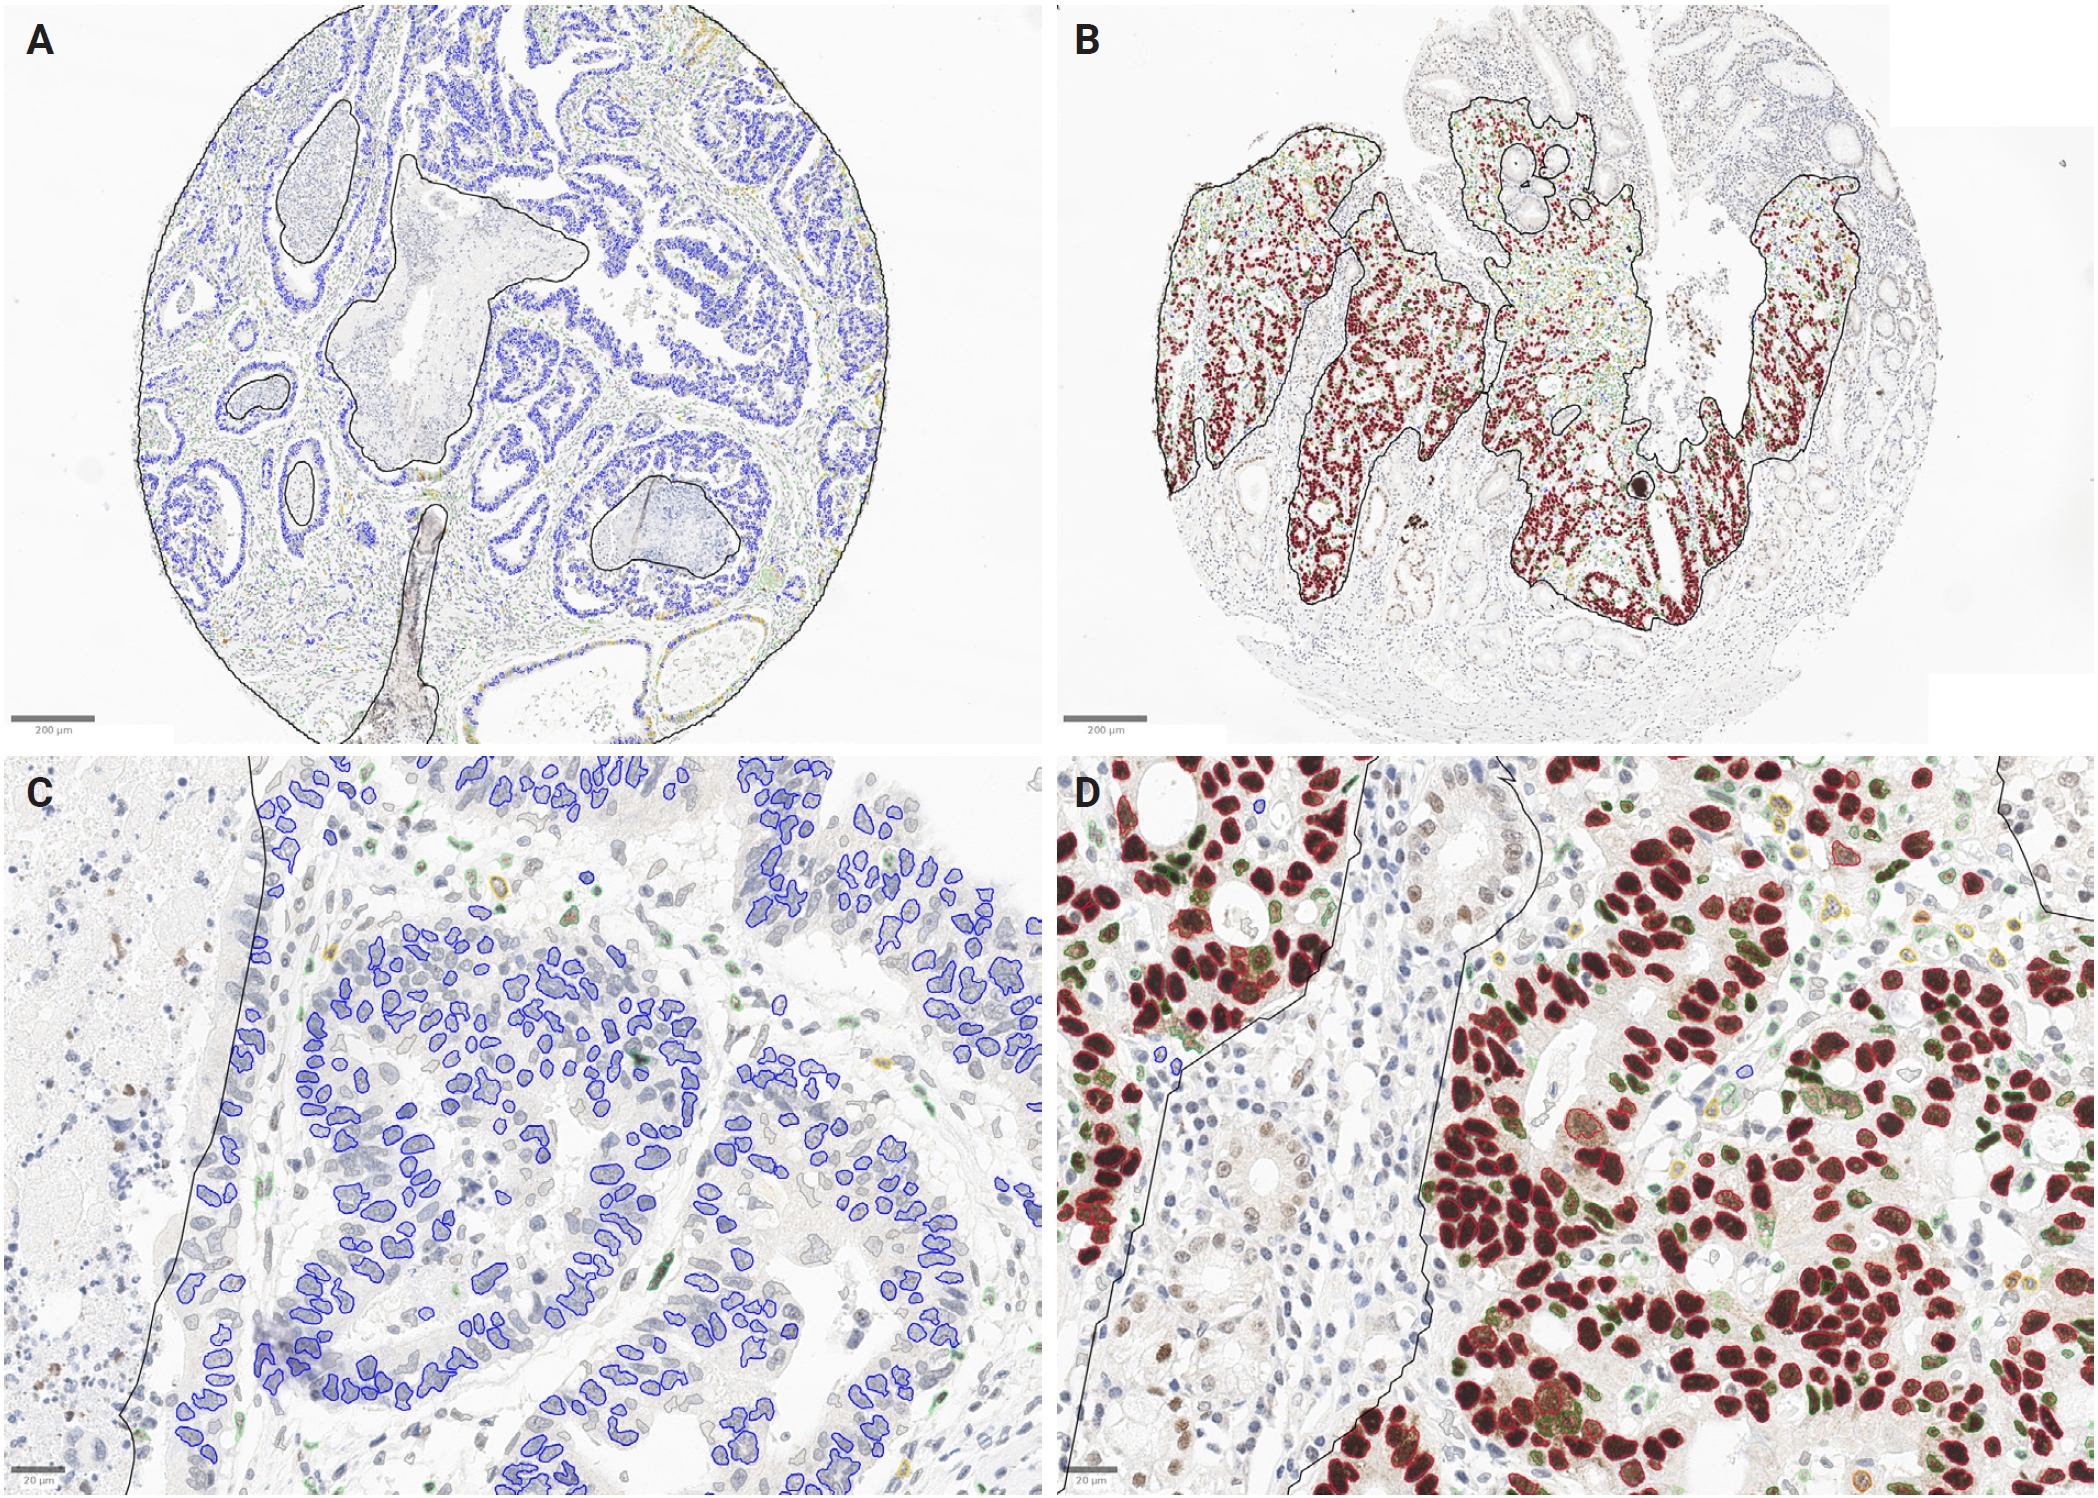
Representative cases and QuPath-based digital quantification of p53 immunohistochemistry. (A, B) Whole tissue-microarray cores (2.0 mm). Tumor regions were manually annotated using the polygon tool, excluding normal mucosa, stroma, and necrosis; the annotation boundary is shown as a black outline. (C, D) Higher-magnification views of the annotated regions in (A) and (B), respectively. Cells were first classified as tumor or non-tumor. Tumor cells were then color-coded by mean nuclear DAB optical density: negative (blue), 1+ (yellow), 2+ (orange), and 3+ (red). Non-tumor (stromal and immune) cells are shown in green. The case in (A) and (C) shows predominantly negative (blue) tumor nuclei, whereas the case in (B) and (D) shows predominantly strongly positive (red) tumor nuclei.
Calculation of p53 H-score
For each annotated tumor core, the percentage of tumor cells in each positive intensity category (1+, 2+, and 3+) was determined. The H-score was calculated by summing the percentages of 1+, 2+, and 3+ cells, multiplied by 1, 2, and 3, respectively. Each core’s H-score reflects the overall nuclear p53 expression across all tumor cells, serving as a single continuous metric to quantify p53 protein expression. Because the intensity cut-points were defined in triplicate (v1a/v1b/v1c), the primary H-score for each core was computed by applying the component-wise mean of the three threshold sets to the detected tumor cells. An H-score was additionally computed for each of the three individual threshold sets and retained for the reproducibility analysis described below.
Manual H-score assessment
Manual H-scores were assessed on each TMA core (one core per case), with the assessor blinded to clinicopathologic data. Scoring was restricted to nuclear staining of tumor cells in well-preserved areas, excluding necrosis, artifacts, and non-neoplastic cells. All assessments referenced the internal control within the same section. For each core, tumor-cell nuclear staining intensity was graded as 0, 1+, 2+, or 3+. The percentage of tumor cells in each intensity category was estimated in 5% increments, summing to 100%. The H-score was calculated as 1 × (% 1+) + 2 × (% 2+) + 3 × (% 3+), with a range of 0 to 300. A single pathologist (S.W.C.) performed the assessment on two separate occasions, 2 weeks apart, and blinded to the first reading. The mean of these two readings was used as the final manual H-score. Intraobserver agreement was high (ICC, 0.955; 95% confidence interval [CI], 0.95 to 0.96; mean bias, −3.6 points; 95% limits of agreement, −57.5 to +50.3) (Supplementary Table S5). All manual assessments were recorded using custom Groovy-based input tools developed in QuPath ver. 0.7.0. Values were stored per core and exported as a per-core comma-separated values for analysis. The scripts are provided as Supplementary Methods.
Determination of H-score cutoff values
To translate the continuous p53 H-score into clinically meaningful expression categories, five distinct strategies were applied to the same set of 2 mm TMA cores. Each method generated a pair of numerical cutoffs that divided the cohort into three groups: p53 low expression (low H-score), wild-type (intermediate H-score), and overexpression (high H-score). For the extended Youden index and VUS analyses, the manual three-tier IHC interpretation (null/wild-type/overexpression) served as the reference standard against which sensitivity, specificity, and correct-classification probabilities were computed. Because this manual three-tier IHC interpretation was performed on the same tissue-microarray images from which the H-scores were derived, the extended Youden and VUS cutoffs are not independent of that reference. The agreement between these cutoffs and the manual three-tier IHC interpretation should therefore be interpreted as a measure of internal consistency rather than as independent validation. We acknowledge this circularity as an inherent limitation of the present design and revisit it in the Discussion. The cutoffs derived from each method were subsequently examined in Kaplan-Meier survival analysis as a supporting check of how each three-group partition related to overall survival, rather than to select the cutoff method with the strongest survival separation.
Manual H-score cutoff method
For the first approach, two pathologists (S.W.C. and J.A.) jointly examined all TMA cores. The cores were ordered from the lowest to the highest p53 H-score, and the pathologists were blinded to patients’ clinical or survival data. They identified the point at which the p53 staining shifted from a complete lack of nuclear labeling (null pattern) to a weak to moderate, diffuse pattern consistent with wild-type expression. Continuing toward higher-scoring cores, a second visual transition was recognized where nuclear staining became uniformly strong in the majority of tumor cells, corresponding to the overexpression phenotype. The H-score values that best demarcated these two visual transitions were recorded as the lower and upper cutoffs, respectively, resulting in thresholds of 8.0 and 106.0 for the digital H-score derived with the primary detector. These two cutoffs were then used to assign each core to one of the three p53 expression groups (low, wild-type, overexpression).
Tertile-based cutoff method
The second strategy relied purely on the distribution of H-scores across all tumor cores. Continuous H-score values were sorted in ascending order and divided into three equally sized groups. Cutoffs were set at the 33.3rd and 66.7th percentiles, corresponding to H-scores of 27.6 and 78.6, respectively. Cores were then classified as p53 low (≤27.6), wild-type (>27.6 to ≤78.6), and overexpression (>78.6).
Log-rank test–based cutoff method
The third approach used overall survival as the biological endpoint to define the two H-score cutoffs. An exhaustive search identified lower and upper cutoffs of 21.3 and 95.7, respectively, defining low (≤21.3), wild-type (>21.3 to ≤95.7), and overexpression (>95.7) groups. Because these cutoffs are derived from the same survival data used for testing, they are prone to optimistic bias. Adjustment for the multiplicity of the "cutpoint" search using maximally selected rank statistics (maxstat package; Lausen-Schumacher approximation) yielded a maximally selected statistic of 2.56 with an adjusted p-value of .168. This confirms that the apparent separation does not withstand correction for multiple testing, and therefore, this cutoff is treated as exploratory.
Extended Youden index method
The fourth strategy employed an extension of the classic Youden index to determine two cut points that simultaneously maximize sensitivity and specificity for a three-category classification. For a binary test, Youden’s index (J) is defined as J = sensitivity + specificity – 1, and the optimal threshold corresponds to the point on the ROC curve that lies farthest from the diagonal line (y = x). To adapt this principle to three ordered groups (low, wild-type, overexpression), the analysis was performed with the Youden3Grp function from the R package DiagTest3Grp. This function determines the pair of cut points that maximizes the extended Youden index, representing the greatest combined discrimination across the three categories. Cut points were estimated using the normal-distribution option of Youden3Grp, which models the H-score distribution of each reference group as Gaussian. This analysis yielded a lower cutoff of 14.5 and an upper cutoff of 100.8, classifying cores as low (≤14.5), wild-type (>14.5 to ≤100.8), or overexpression (>100.8). Because the H-scores of the low-expression group are bounded at zero and right-skewed, an empirical (distribution-free) version of the same criterion was computed as a sensitivity analysis; it yielded cut points of 12.5 and 102.9 (Supplementary Table S6).
ROC surface (VUS)–based method
The fifth approach extended the conventional two-dimensional ROC analysis to three dimensions, reflecting the three categories of p53 expression. In a binary ROC curve, the optimal cut point is the coordinate closest to the upper-left corner (0, 1), which maximizes the true positive rate while minimizing the false positive rate. To apply the same principle to three ordered groups, a three-dimensional ROC surface was constructed. For any candidate pair of H-score cutoffs, the surface is defined by three coordinates: x = P(correctly classified as low) = a/(a + b + c), y = P(correctly classified as wild-type) = d/(d + e + f), and z = P(correctly classified as overexpression) = g/(g + h + i), where a, d, and g denote the numbers of cases correctly assigned to the low, intermediate, and high groups, respectively, and the remaining letters represent the corresponding misclassifications. The ideal classifier would occupy the point (1, 1, 1) on this surface, indicating perfect concordance for all three groups. To locate the pair of cutoffs that brings the observed point closest to (1, 1, 1), the VUS function from the R package DiagTest3Grp was employed. The algorithm evaluates every admissible pair of thresholds, computes the three true classification probabilities, and then calculates the Euclidean distance from (1, 1, 1). The threshold pair with the minimal distance is selected as the optimal cutoffs. The search was performed empirically over all admissible threshold pairs, without distributional assumptions. Application of VUS to the cohort’s H-score distribution yielded a lower cutoff of 12.4 and an upper cutoff of 103.8. Consequently, cores were classified as low (≤12.4), wild-type (>12.4 to ≤103.8), or overexpression (>103.8).
Statistical analysis
Overall survival (OS) was defined as the interval from the date of gastrectomy to the date of all-cause death. Patients alive at last contact were censored at the date of last follow-up. Since only 60 deaths (11.4%) occurred, the median OS was not reached; therefore, the median follow-up duration is reported instead.
All survival analyses were performed using R ver. 4.6.0 (R Foundation for Statistical Computing, Vienna, Austria). H-score cutoffs were derived using the rolr package ver. 1.0.0 (exhaustive log-rank optimization) and the DiagTest3Grp package ver. 1.6 (extended Youden index and ROC-surface [VUS] analyses). Survival analyses utilized the survival (ver. 3.8-6), survminer ver. 0.5.2, and maxstat ver. 0.7-26 packages.
Robustness to the choice of cell-detection method and reproducibility across the three intensity-threshold sets were evaluated against the manual three-tier IHC interpretation (null/wild-type/overexpression) as the reference standard. This assessment uses the continuous H-score without applying any cutoff, making it independent of the cutoff-derivation step and thus not subject to the circularity inherent in Youden- and VUS-derived thresholds. The H-score's ability to discriminate the three reference categories without thresholding was summarized by the VUS, a three-class generalization of the area under the curve (chance, 0.167; perfect, 1.0). Paired between-method differences were tested by case-resampling bootstrap (2,000 replicates). Agreement of the continuous H-score—between detection methods and among threshold sets—was quantified by the two-way absolute-agreement ICC and Lin’s concordance correlation coefficient. Agreement of the resulting three-group classifications was assessed by overall agreement with linear- and quadratic-weighted kappa (for two methods/sets) or Fleiss’ kappa (for three sets).
For each cutoff method, patients were stratified into three p53 expression groups, and a Kaplan-Meier survival curve was generated. Pairwise differences among the three curves were tested with the log-rank test. Univariable and multivariable Cox proportional-hazards models were fitted to estimate hazard ratios (HRs) with 95% confidence intervals.
Because deaths occurred almost exclusively in the AGC group (58 of 60 deaths; only 2 deaths among 319 EGC patients), including stage as an ordinary covariate caused quasi-complete separation and unstable estimates. Tumor stage (EGC/AGC) was therefore handled by stratification (stratified Cox), and a separate AGC-only subgroup analysis was performed. Models were additionally adjusted for age, sex, differentiation (poorly differentiated vs. well or moderately differentiated), and signet-ring cell component.
With only 60 events, the number of covariates that could be reliably estimated was constrained by events-per-variable considerations [28,29]. Covariates were therefore pre-specified and limited to established confounders rather than selected by statistical significance. Lymphatic, venous, and perineural invasion and resection-margin status were not added because they are strongly correlated with tumor stage (used for stratification) and would have reduced the events-per-variable ratio (from approximately 12 to approximately 7).
The proportional-hazards assumption was assessed using scaled Schoenfeld residuals and was satisfied for all terms. The H-score was also analyzed as a continuous variable, and a combined aberrant (low + overexpression) versus wild-type comparison was performed. The continuous H-score was further modeled with a restricted cubic spline (4 knots at the 5th, 35th, 65th, and 95th percentiles) within the stage-stratified Cox model, adjusted for age and sex. This reduced covariate set was chosen to ensure that the additional degrees of freedom of the spline did not lower the events-per-variable ratio. The median H-score served as the reference value, and departure from linearity was assessed by a likelihood-ratio test comparing the spline and linear models. To address the optimism of the log-rank-optimized cutoff [30], a multiplicity-adjusted p-value was obtained using maximally selected rank statistics. Internal stability was assessed by bootstrap resampling, using 2,000 replicates for both the extended-Youden and VUS cut points (Supplementary Table S6) and for the aberrant-versus-wild-type HR. Statistical significance was set at p < .05. The reproducibility and agreement analyses were reported in accordance with the Guidelines for Reporting Reliability and Agreement Studies (GRRAS) guidelines for reliability and agreement studies [31]. The classification of the H-score against the manual three-tier IHC interpretation was reported according to the Standards for Reporting Diagnostic Accuracy Studies (STARD) 2015 guidelines for diagnostic accuracy studies [32]. The supporting survival analysis was reported according to the Reporting Recommendations for Tumor Marker Prognostic Studies (REMARK) recommendations for tumor marker prognostic studies [33].
RESULTS
Patient characteristics
The baseline clinicopathologic characteristics of the 528 patients included in the study are summarized in Table 1. The cohort consisted of 209 patients with AGC and 319 patients with EGC, with a mean age of 60.4 ± 12.4 years and a male predominance of 68.0%. While age and sex did not differ significantly between groups, the AGC group showed a higher frequency of poorly differentiated tumors (63.6%) and aberrant p53 expression (48.3%) compared to the EGC group (53.0% and 33.9%, respectively). Furthermore, patients with AGC had significantly worse OS than those with EGC (p < .001); the median follow-up was 58.6 months in AGC and 60.6 months in EGC.
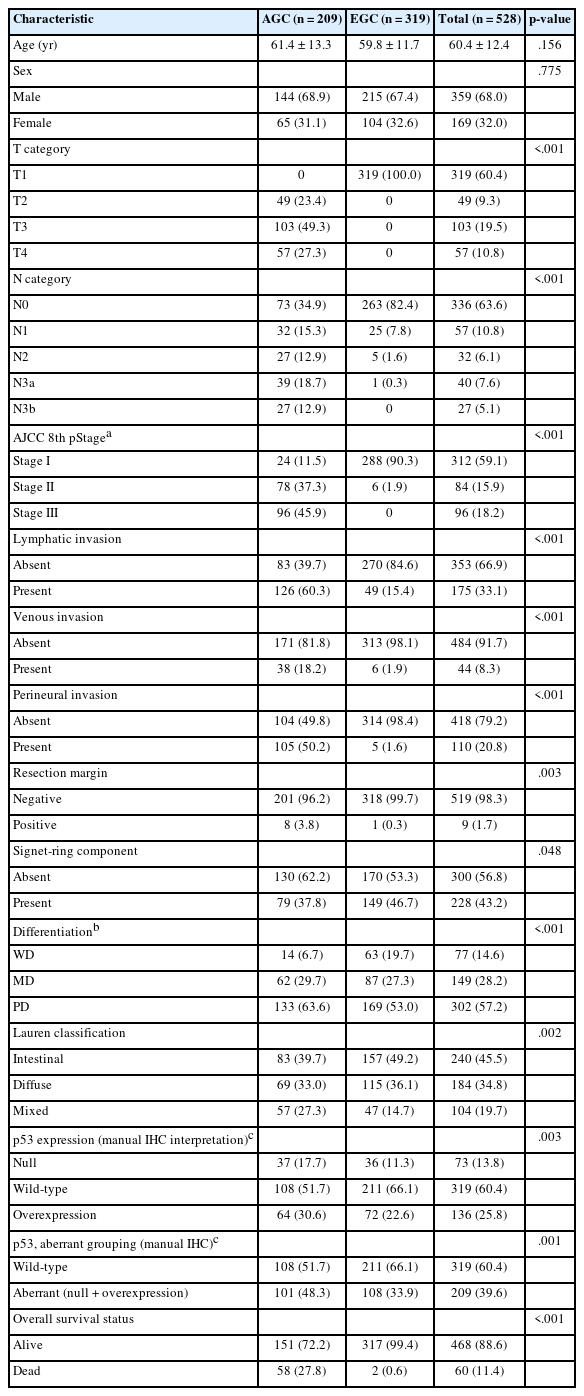
Clinicopathologic characteristics of the study cohort according to tumor stage group
Distribution of p53 H-scores within the gastric cancer cohort
A quantitative assessment of p53 IHC across 528 evaluable 2 mm tissue-microarray cores revealed considerable heterogeneity in nuclear expression. Tumor cell H-scores ranged from 0.09 to 291.03, with a median of 45.51 and a mean of 78.11. The interquartile range, spanning from 21.0 (25th percentile) to 106.6 (75th percentile), indicated significant dispersion across the expression spectrum. The histogram (Fig. 2) shows a markedly right-skewed distribution, with a dense concentration of cores at low H-scores and a long, attenuated upper tail. A secondary rise in density was apparent above an H-score of approximately 200. This pattern mirrors the biological heterogeneity of putative TP53 alteration–associated immunohistochemical patterns, reflecting the coexistence of tumors with little or no p53 staining and those with strong, diffuse overexpression. The cutoffs derived by the five strategies are overlaid on the distribution; the upper thresholds cluster within a narrow range, whereas the lower thresholds are more dispersed.
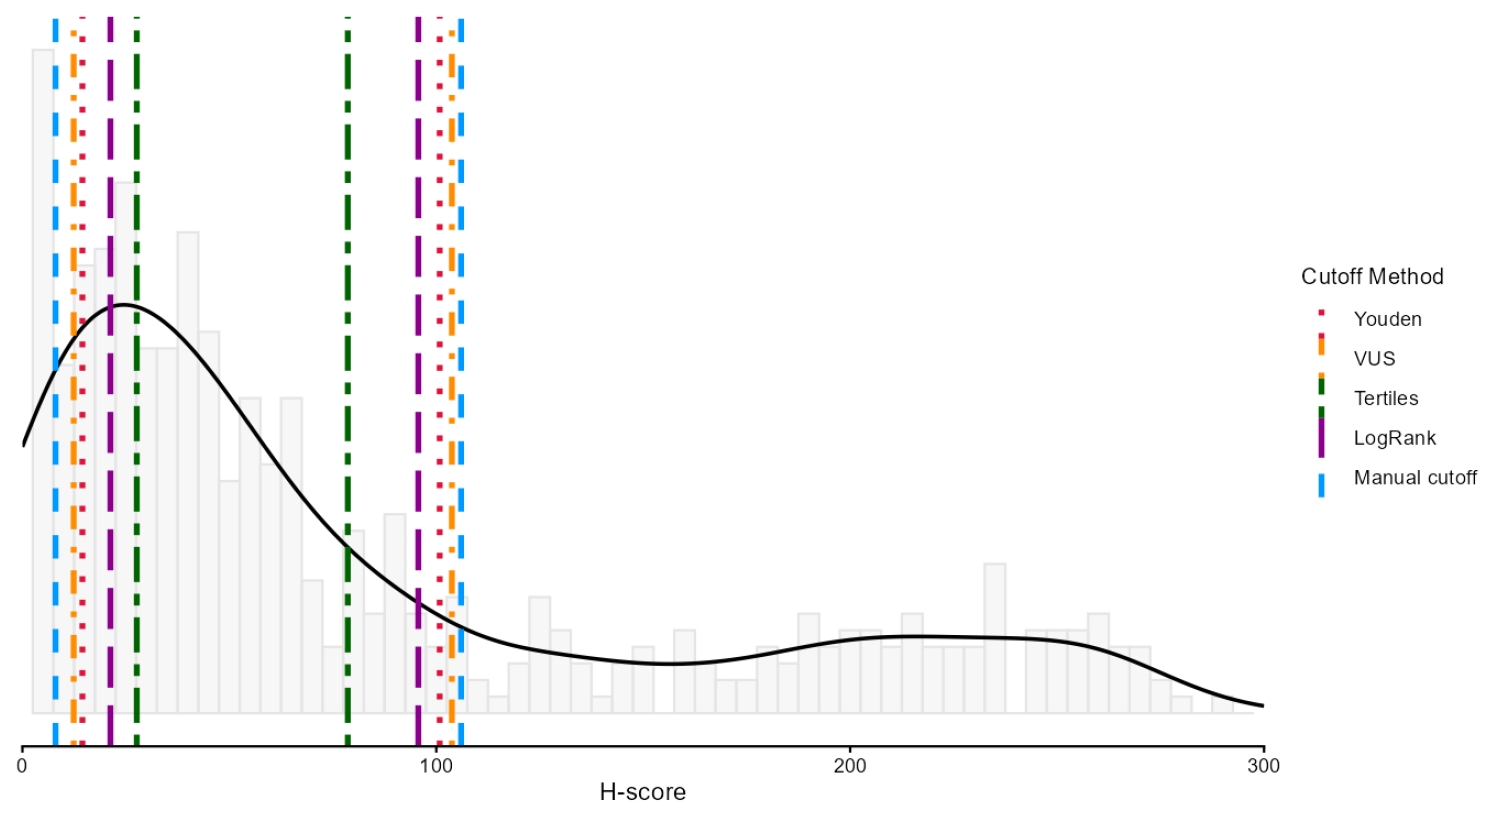
Distribution of the digital p53 H-score in the study cohort (n = 528), computed with the primary detector (InstanSeg) and the mean of the three intensity-threshold determinations. Grey bars show the histogram, and the solid black line represents the kernel density estimate. The distribution is markedly right-skewed, with a dense concentration of cores at low H-scores and a secondary rise in density above an H-score of approximately 200. Vertical lines indicate the lower and upper cutoffs derived by each of the five thresholding strategies: manual (blue), log-rank optimization (purple), tertiles (dark green), extended Youden index (red), and receiver operating characteristic (ROC) surface (volume under the ROC surface [VUS]; orange).
Robustness and reproducibility of the digital H-score
Tumor-cell detection by InstanSeg and the legacy watershed algorithm was highly concordant (Spearman ρ = 0.947), though InstanSeg detected approximately 9% fewer cells per core (median per-core ratio, 0.911). The resulting H-scores agreed closely (Pearson r = 0.996; Spearman ρ = 0.994; ICC, 0.996 for consistency and 0.990; 95% CI, 0.988 to 0.992, for absolute agreement), with the difference between the two coefficients reflecting a systematic offset: InstanSeg yielded slightly lower H-scores (mean bias, −8.6; 95% limits of agreement, −22.2 to +5.0). Cutoff-independent discrimination of the manual three-tier IHC interpretation was comparable between the two algorithms. Under the normal-distribution estimator, the VUS was 0.927 (95% CI, 0.906 to 0.949) for InstanSeg and 0.944 (95% CI, 0.926 to 0.962) for the legacy detector, whereas under an empirical, distribution-free estimator, it was 0.972 (95% CI, 0.955 to 0.985) and 0.967 (95% CI, 0.948 to 0.983), respectively. The two estimators therefore rank the detectors in opposite orders, but neither difference is significant: in a paired case-resampling bootstrap, the between-detector difference in the empirical VUS was +0.005 (95% CI, −0.000 to +0.012). Because the H-score is bounded at zero and right-skewed, the empirical estimator is more appropriate; on either estimate, discrimination is equivalent between the detectors. InstanSeg was adopted as the primary detector because it is a deep-learning method requiring no dataset-specific parameter tuning, with the legacy algorithm retained as a robustness comparator (Supplementary Table S7).
Reproducibility across the three intensity-threshold sets was high for the continuous H-score (ICC, 0.95; median per-core standard deviation ≈ 13 H-score points). It was substantial for the resulting three-tier categories, with identical assignments across all three sets in 85.4% of cores for InstanSeg and 84.3% for the legacy detector (Fleiss' kappa, 0.82 and 0.80, respectively; pairwise quadratic-weighted kappa, 0.78 to 0.96) (Supplementary Table S4). Therefore, the intensity-threshold determination, rather than the detection algorithm, was the principal source of measurement variability, supporting the use of the component-wise mean of the three threshold sets for the primary H-score.
The manual three-tier IHC interpretation, which served as the reference standard, was reproducible between the two pathologists (500 of 545 cores concordant, 91.7%; Cohen’s κ = 0.845; weighted κ = 0.861) (Supplementary Table S1). Additionally, the tumor-cell classifier was formally validated against a two-pathologist consensus ground truth, achieving near pathologist-level accuracy for the primary InstanSeg detector (90.4% accuracy; Cohen’s κ = 0.81) (Supplementary Table S2). The corresponding validation of the legacy classifier is reported in Supplementary Table S2.
Cutoff setting methods
To categorize p53 expression into three groups (low, wild-type, and overexpression), we established H-score thresholds using five different methodologies (Table 2). The manual method set cutoffs at 8.0 and 106.0. Other methods yielded the following cutoffs: tertiles at 27.6 and 78.6; log-rank optimization at 21.3 and 95.7; the extended Youden index at 14.5 and 100.8; and VUS at 12.4 and 103.8. For the upper boundary, the data-derived methods clustered closely around the pathologist-derived threshold of 106.0 (VUS, 103.8; Youden, 100.8; log-rank, 95.7). In contrast, all lower cutoffs were higher than the manual threshold of 8.0, with VUS (12.4) yielding the closest value (Table 3). To confirm that these numerical thresholds correspond to biologically recognizable staining patterns, representative cores immediately flanking the extended-Youden cutoffs are shown in Fig. 3. H-scores of 9.6 and 15.2 bracket the lower cutoff (14.5), while 98.6 and 123.9 bracket the upper cutoff (100.8). These examples illustrate the visual transition from minimal nuclear staining (low) through wild-type to diffuse strong overexpression. Agreement among the five H-score–based cutoff methods, using the manual H-score cutoff method (8.0/106.0) as the common comparator, is summarized in Table 3, with the full confusion matrices provided in Supplementary Table S8. Because the extended-Youden and VUS cutoffs were optimized against the manual three-tier IHC interpretation of these same images, this agreement reflects internal consistency rather than independent validation (see Materials and Methods).
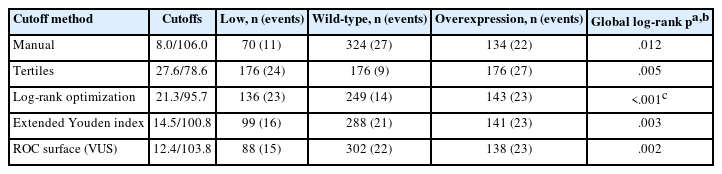
Three-tier classification and overall survival according to five H-score cutoff strategies

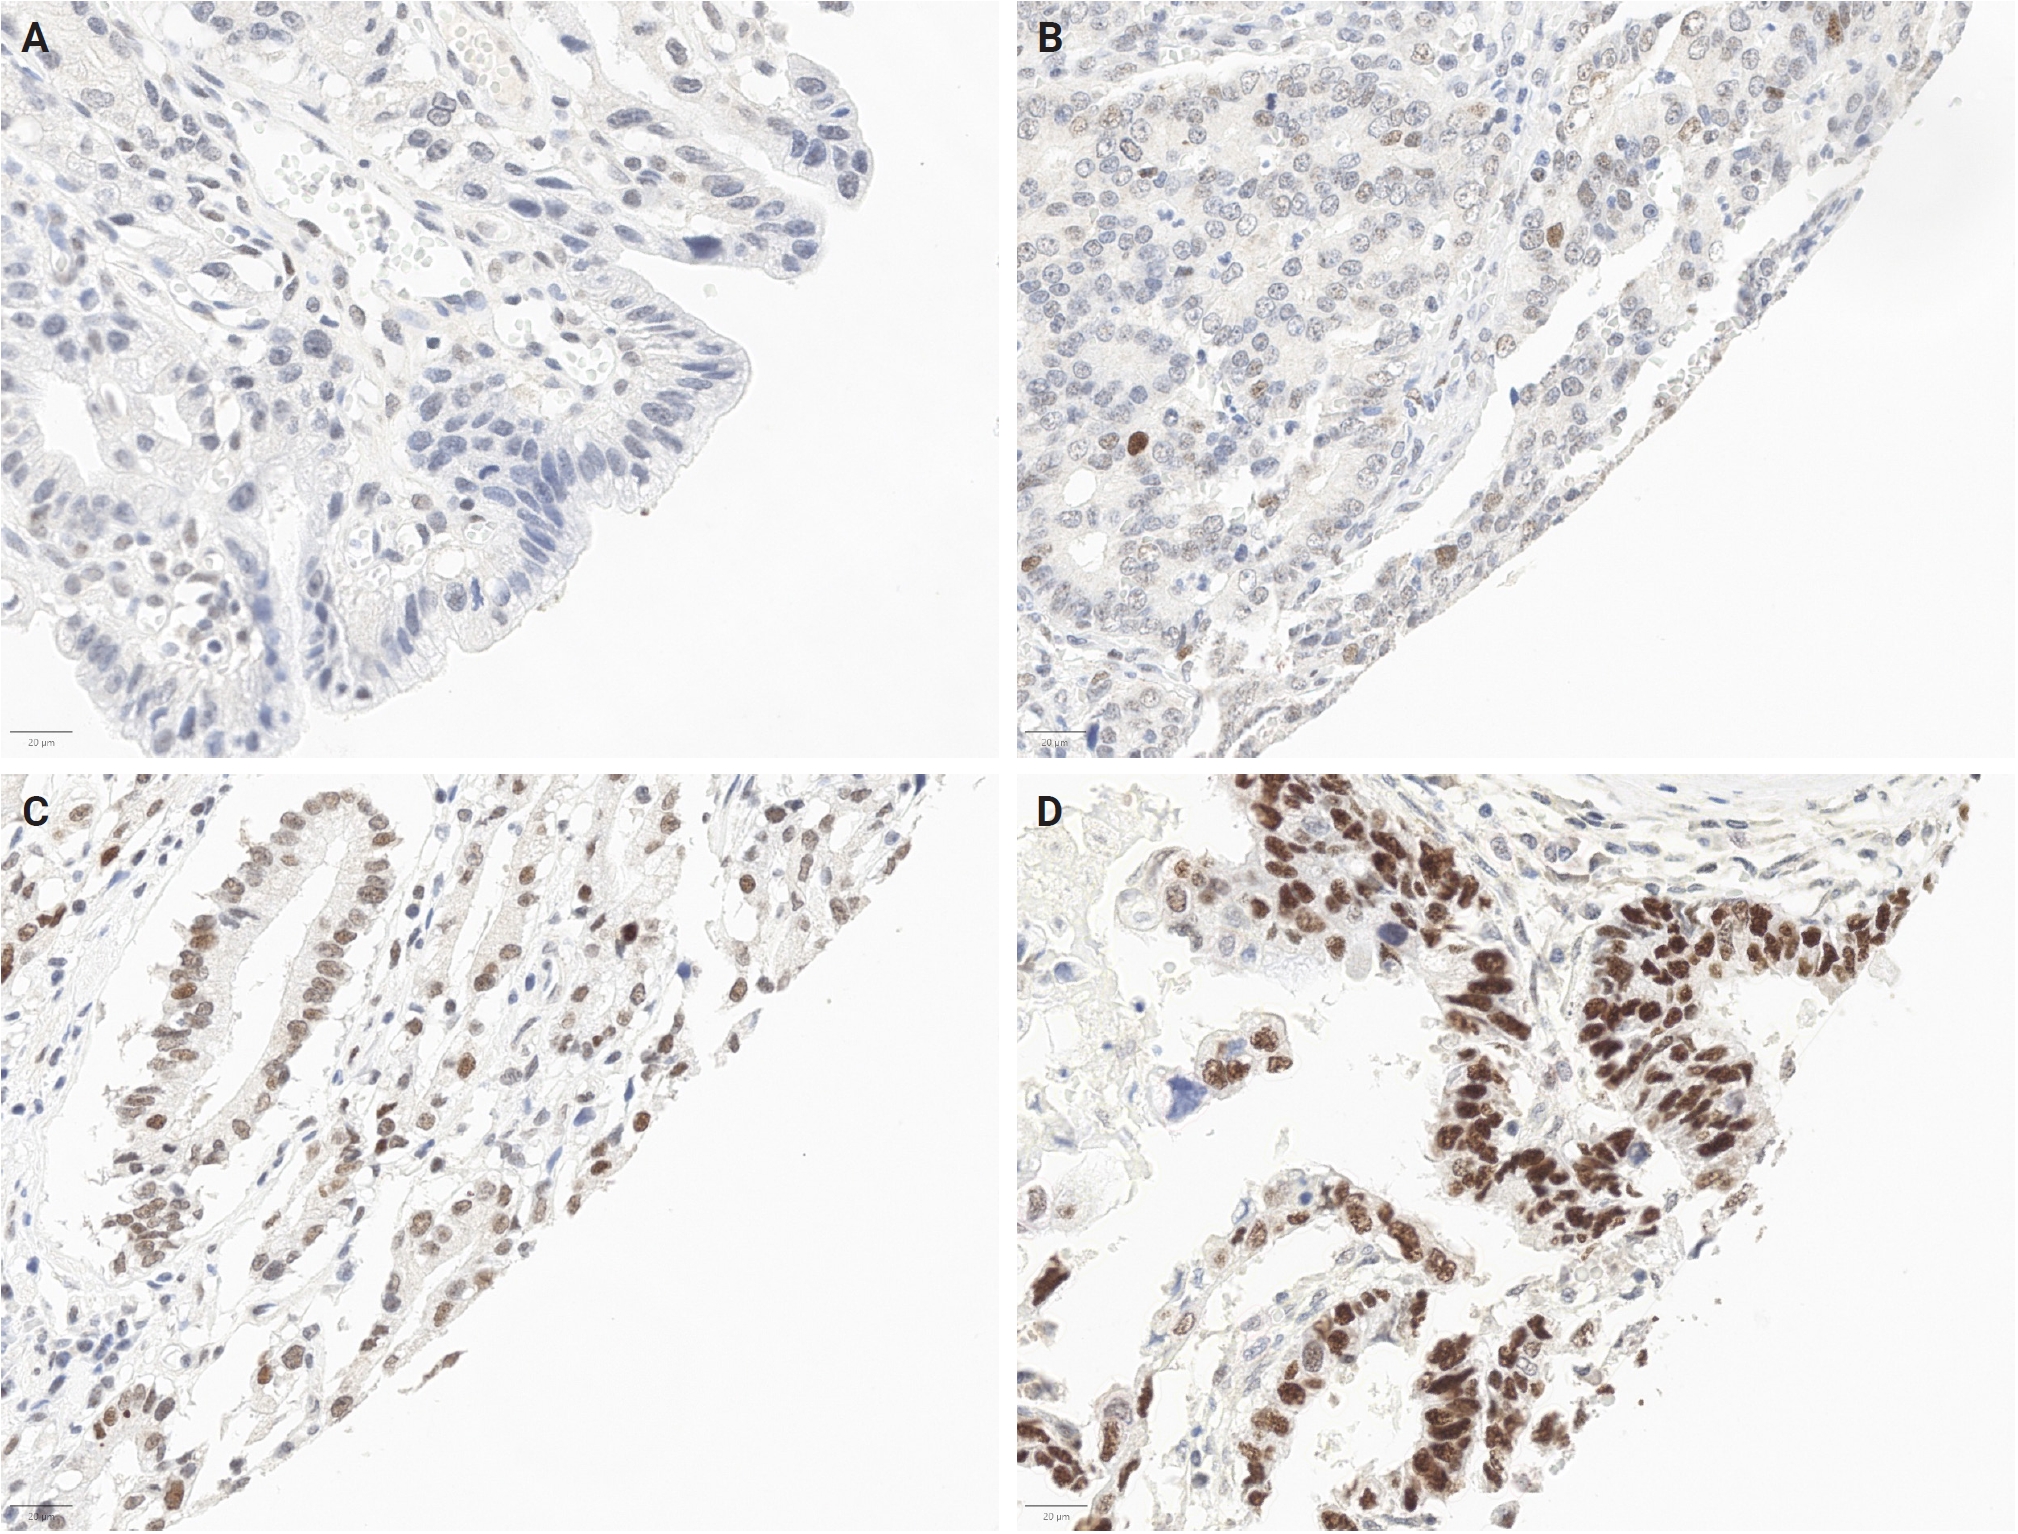
Representative p53 immunohistochemistry at the proposed cutoff boundaries. Cases were deliberately selected to lie immediately adjacent to the extended Youden index thresholds (14.5 and 100.8) to allow visual assessment of the transition at the cutoff itself rather than between extremes. Each panel shows a representative field with its corresponding QuPath overlay. (A) H-score 9.6: low expression (minimal nuclear staining). (B) H-score 15.2: wild-type (scattered weak-to-moderate nuclear staining). (C) H-score 98.6: wild-type (moderate, non-diffuse staining). (D) H-score 123.9: overexpression (diffuse strong nuclear positivity). For all four cases, the digital assignment, the manual three-tier immunohistochemistry interpretation, and the manual H-score category were concordant.
Survival stratification by p53 expression groups
For each cutoff strategy, patients were classified into low, wild-type, and overexpression groups and analyzed using Kaplan-Meier survival estimates. The extended Youden index is presented in Fig. 4 as a representative example (the rationale for its focus is provided in the Discussion), with the remaining four methods (manual, tertiles, ROC surface [VUS], and log-rank optimization) detailed in Supplementary Fig. S3. All five methods showed statistically significant differences in OS among the three groups by nominal global log-rank testing. The nominal global log-rank p-values were 0.012 for the manual cutoffs, 0.005 for tertiles, 0.003 for the Youden-based cutoffs, 0.002 for the ROC-surface (VUS) method, and <0.001 for the log-rank-optimized cutoffs. Because the log-rank-optimized cutoffs were derived from the same survival data against which they were tested, their nominal significance did not survive adjustment for the multiplicity of the cutpoint search (adjusted p = .168); this cutoff should therefore be regarded as exploratory. Across all cutoff definitions, tumors classified as wild-type consistently exhibited more favorable survival than those with aberrant p53 expression patterns. Conversely, low-expression and overexpression tumors showed broadly similar survival trajectories. Pairwise log-rank testing confirmed this pattern: the low-vs-overexpression comparison was non-significant for every method (p > .4), whereas both aberrant groups differed significantly from wild-type. Per-group case and event counts, along with pairwise comparisons, are presented in Table 2. The aberrant-vs-wild-type contrast for the extended Youden index is directly illustrated in Fig. 4B.
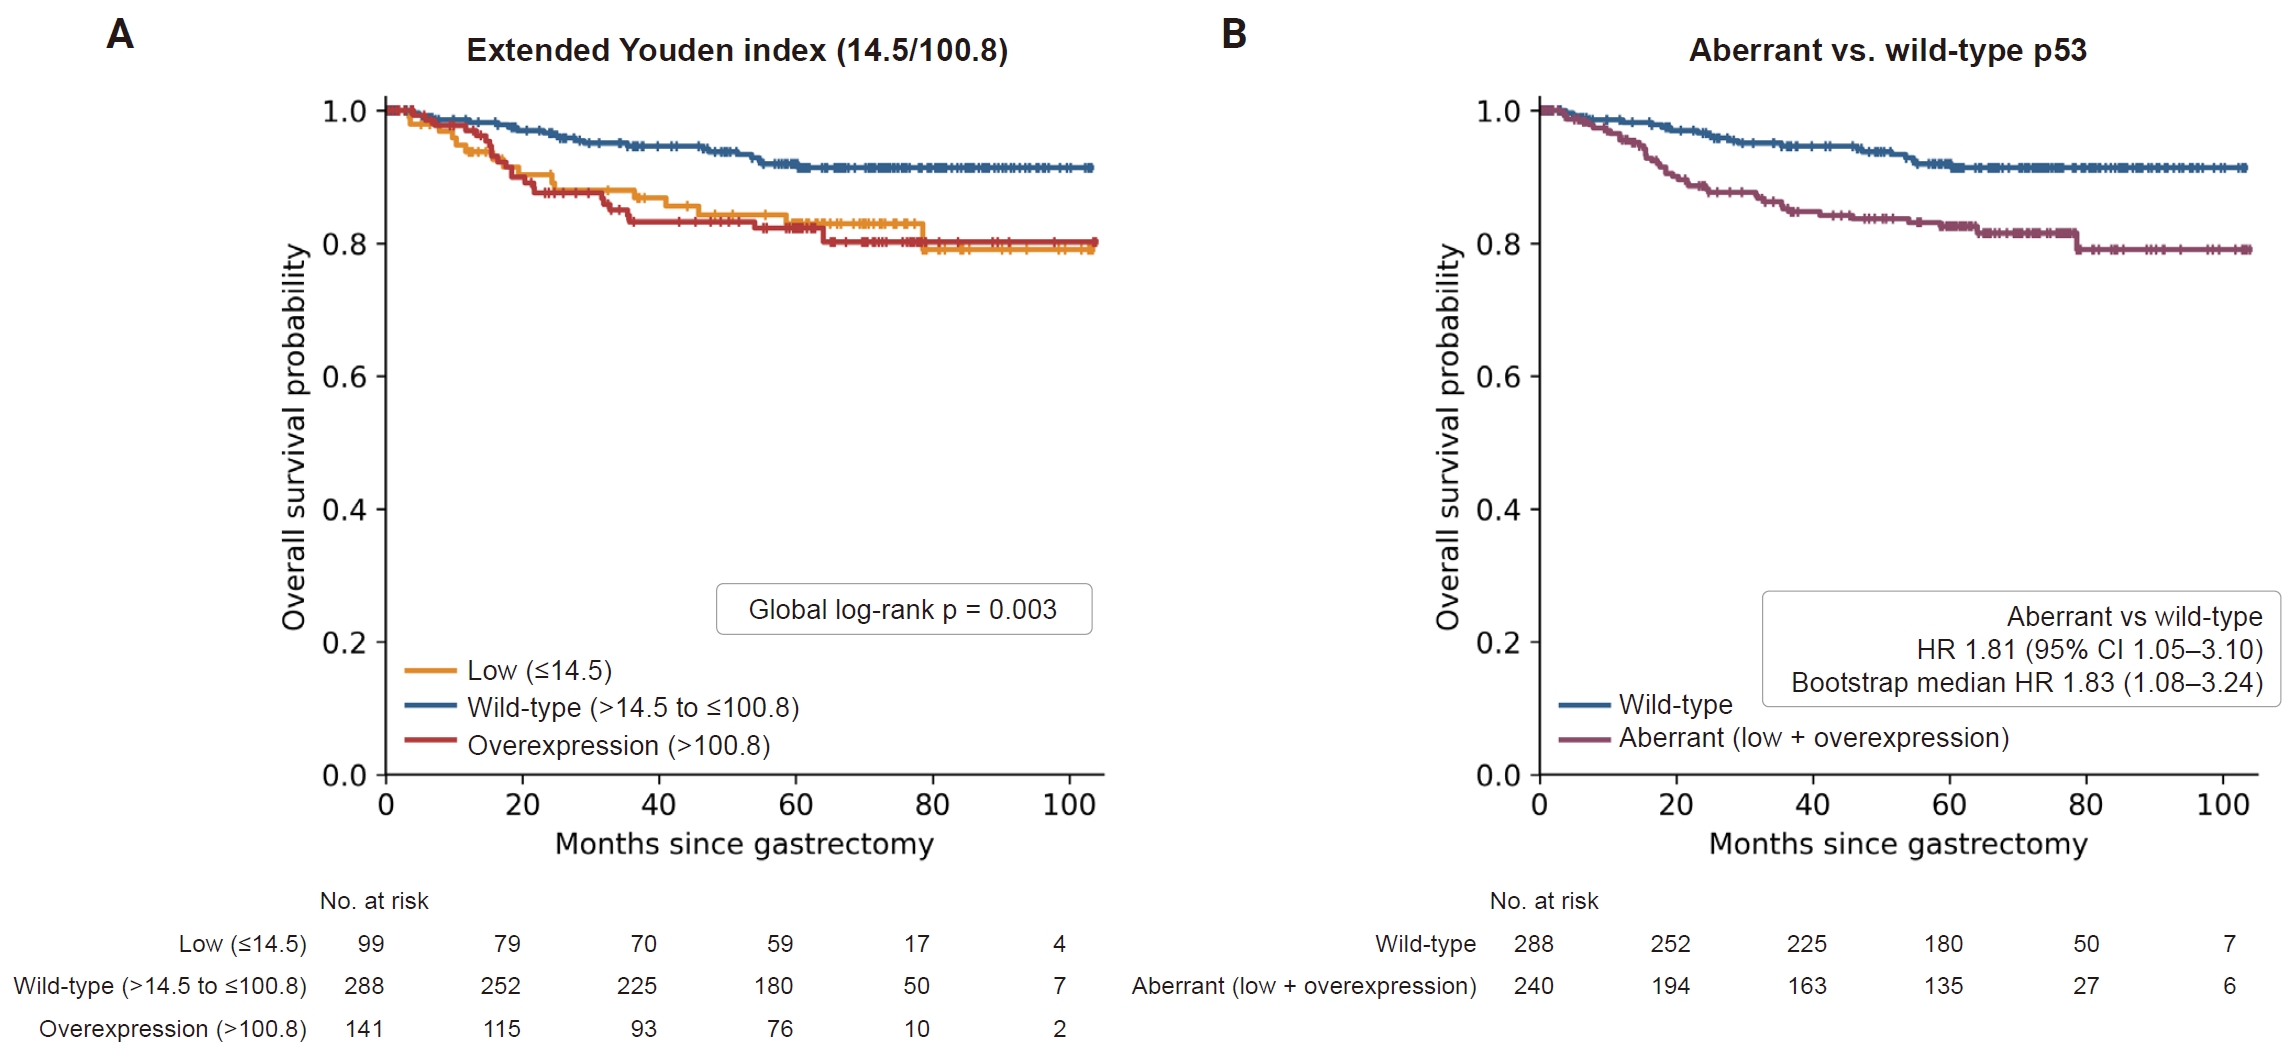
Kaplan-Meier overall survival stratification by p53 expression using the extended Youden index. (A) Three-group stratification into low (≤14.5), wild-type (>14.5 to ≤100.8), and overexpression (>100.8) H-score categories (global log-rank p = .003). (B) Two-group comparison of aberrant (low + overexpression) versus wild-type p53. In both panels, the number-at-risk table is shown below the curves, tick marks denote censored observations, and the hazard ratio for aberrant versus wild-type p53 (from the stage-stratified multivariable Cox model adjusted for age, sex, poor differentiation, and signet-ring cell component) is annotated within each panel (hazard ratio [HR], 1.81; 95% confidence interval [CI], 1.05 to 3.10). Bootstrap resampling (2,000 replicates) of this effect yielded a stable median HR of 1.83 (2.5–97.5th percentile, 1.08 to 3.24). Results for the other four thresholding methods are provided in Supplementary Fig. S3.
In multivariable Cox models, stratified by tumor stage (EGC/AGC) and adjusted for age, sex, poor differentiation, and signet-ring cell component, an aberrant p53 pattern (low + overexpression) remained associated with worse OS for four of the five cutoff methods (Tables 4, 5): tertiles HR 2.50 (95% CI, 1.21 to 5.14), extended Youden HR 1.81 (95% CI, 1.05 to 3.10), log-rank HR 2.65 (95% CI, 1.43 to 4.88), and ROC-surface (VUS) HR 1.91 (95% CI, 1.12 to 3.27). For the manual cutoffs, the association was of similar magnitude but did not reach significance (HR, 1.63; 95% CI, 0.97 to 2.76; p = .066). When analyzed continuously, each 50-point increase in H-score was associated with an HR of 1.20 (95% CI, 1.03 to 1.39; p = .019). Modeling the H-score flexibly with a restricted cubic spline showed that the estimated hazard was lowest near the median H-score and increased at both extremes, most steeply at high H-scores. This paralleled the aberrant-versus-wild-type contrast. This departure from linearity was not statistically significant (likelihood-ratio test, p = .320), so the more parsimonious linear term was retained (Supplementary Fig. S4). The AGC-only subgroup analysis (209 patients, 58 deaths) yielded concordant estimates (e.g., extended Youden HR, 1.93; 95% CI, 1.11 to 3.37). After multiplicity adjustment by maximally selected rank statistics, the log-rank-optimized cutoff was no longer significant (adjusted p = .168, optimal-cutpoint maxstat). Bootstrap resampling of the extended-Youden aberrant-vs-wild-type effect provided a stable median HR of 1.83 (95% CI, 1.08 to 3.24). Therefore, survival outcomes were primarily determined by whether p53 expression was wild-type or aberrant.
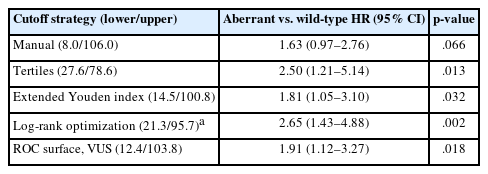
Multivariable Cox proportional-hazards analysis of aberrant (low + overexpression) versus wild-type p53 by cutoff strategy
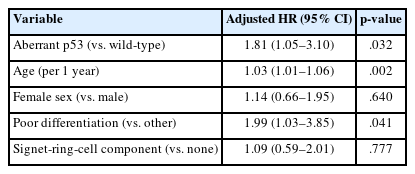
Fully adjusted Cox proportional-hazards model for the primary classification (extended Youden index)
DISCUSSION
In this study, a semi-automated digital workflow quantified nuclear p53 immunoreactivity in 528 patients who underwent curative gastrectomy for gastric adenocarcinoma. The quantification proved reproducible at every observer-dependent step. The two pathologists agreed on the manual three-tier IHC interpretation in 91.7% of cores (κ = 0.845). The H-score was robust to both the cell-detection algorithm (ICC, 0.990) and repeated calibration of the intensity thresholds (ICC, 0.954). In contrast, the five cutoff strategies produced appreciably different cut points (lower, 8.0 to 27.6; upper, 78.6 to 106.0). Therefore, the method of cutoff derivation, rather than H-score measurement, is the primary source of variation in case classification. The extended Youden index and the ROC-surface criterion were statistically indistinguishable. As a supporting check, all five classifications separated OS in the three-group comparison, with the wild-type group faring best and the low-expression and overexpression groups performing similarly worse. In the multivariable model, the aberrant pattern remained associated with survival for four of the five strategies, with the manual cutoffs being the exception. The log-rank-optimized strategy lost its significance once the multiplicity of the cutpoint search was considered.
The application of digital image analysis and H-scoring to p53 immunohistochemistry has been studied in several malignancies. Yan et al. [25] recently used digital quantification to define a TP53 mutational surrogate in mantle cell lymphoma, deriving a single cutoff within their own cohort. The most closely related work is that of Bankhead et al. [24], who established the foundational QuPath workflow in breast cancer, applying it to five biomarkers, including p53, in a 293-patient tissue microarray. Several design elements are shared with the present study: digital H-scoring of tumor nuclei; exclusion of cores containing fewer than 100 tumor cells; and, because p53 was the only marker requiring two cutoffs, a three-tier structure contrasting extreme-low and extreme-high cases with intermediate ones, the aberrant-versus-wild-type comparison adopted here. We also share their two routes to a cutoff—derivation against the pathologist’s classification as the reference standard and optimization of the log-rank statistic across candidate thresholds—together with their caution that the latter entails multiple testing [30]. The present study extends this framework in three directions. First, we broaden the comparison to five derivation strategies and generalize the reference-standard-derived cutoff from two classes to three, using the extended Youden index and the VUS. Second, we carry the multiple-testing caution into the two-cutoff setting, for which adjusted p-values had been reported only for the single-cutoff biomarkers. Applying maximally selected rank statistics to the three-tier log-rank search, the nominal significance of the optimized cutoffs (p < .001) did not survive correction (adjusted p = .168); therefore, we report that strategy as exploratory rather than recommending it. Third, we quantify the reproducibility of the workflow itself across two independent cell-detection algorithms and three repeated calibrations of the intensity thresholds. To our knowledge, this is one of the first studies to apply semi-automated digital quantification to p53 in gastric cancer, and the first to systematically compare cutoff-derivation strategies in this setting.
The five strategies produced substantially different cut points, most notably at the lower boundary, where values ranged from 8.0 to 27.6. These differences were not cosmetic: the tertile-based classification agreed with the manual cutoffs in only 72.0% of cores, while the ROC-surface classification agreed in 95.8% (Table 3). Therefore, the choice of derivation strategy alters how a substantial minority of cases are labeled, even when their underlying H-score is identical. However, two of the strategies were indistinguishable from each other. The extended Youden index and the ROC-surface (VUS) criterion yielded numerically close cut points (14.5/100.8 vs. 12.4/103.8), assigned only 14 of 528 cores (2.7%) to different tiers (κ = 0.955), and in a paired case-resampling bootstrap, the confidence intervals for the between-method difference included zero at both boundaries (Supplementary Table S6). While the VUS cutoffs provided marginally better point estimates than the extended Youden index—a slightly higher concordance with the manual cutoffs (95.8% vs. 93.2%) (Table 3) and marginally lower survival p-values (global log-rank, .002 vs. .003; multivariable aberrant-vs-wild-type, .018 vs. .032)—given their statistical equivalence, these small differences should not be interpreted as evidence of a superior method. The residual difference lies in the estimator rather than the criterion: the extended Youden index was estimated under a normal-distribution assumption, and the VUS cutoffs by an empirical grid search. When the Youden criterion was maximized on the same empirical grid, it assigned 527 of the 528 cores identically to the VUS cutoffs; the two solutions differ for a single core whose H-score falls between the two reported upper cut points. Consistent with this, cores falling on either side of the two lower cutoffs, or of the two upper cutoffs, are not visually distinguishable (Fig. 3).
Which strategy, then, should be used in practice? Each carries a different caveat. Log-rank optimization derives its cut points from the survival data against which they are then tested. Its nominal significance did not survive adjustment for the multiplicity of that search, and it requires outcome data that are not available at the time of diagnosis. The extended Youden index and the ROC-surface criterion avoid this outcome dependence, but they are derived against the pathologist’s three-tier reading of the same images. Thus, their agreement with the manual H-score cutoffs measures internal consistency rather than validity. The tertile method is free of both limitations, yet its cut points simply follow the H-score distribution of the cohort at hand and have no basis in staining phenotype. Deriving the cutoffs against the pathologist’s reading is a deliberate choice here because the aim is to reproduce expert three-tier IHC interpretation digitally. The limitation it imposes is on what may be claimed from the resulting concordance, not on the usefulness of the cutoffs themselves. Given that the extended Youden index and the ROC-surface criterion are statistically indistinguishable, the choice between them rests on practical grounds. We propose the extended Youden index as a reasonable default rather than advance it as a recommendation: it generalizes a criterion already familiar from two-class diagnostic testing, and it yields cut points that can be stated and applied directly. The ROC-surface criterion remains an equally defensible alternative. The Youden-derived cutoffs (14.5 and 100.8) are a starting point for evaluation in other cohorts, not a threshold for clinical use.
This study has several limitations. It is retrospective and single-center, and immunostaining used a single antibody clone (DO-7) with fixed antigen retrieval. Therefore, the cutoffs derived here require confirmation with other techniques and in other laboratories. As TP53 sequencing was not performed, the immunohistochemical patterns are described as putative surrogates rather than confirmed mutations. This absence also underlies the circularity discussed previously: because the extended-Youden and VUS cutoffs were derived against the manual interpretation of the same images, their concordance with the manual H-score cutoffs cannot serve as validation. Breaking this circularity would require an outcome-independent external reference, such as TP53 sequencing or an independent cohort from another institution. The reproducibility demonstrated here is also limited to a single laboratory and a single staining batch. All slides were stained and scanned together, applying one deconvolution matrix throughout. Consequently, the cutoffs should be recalibrated rather than directly transferred when the staining run, scanner, or laboratory changes. Several observer-dependent steps could only be partially characterized. Tumor regions were annotated by two pathologists and reviewed by a third, rather than in independent duplicate, precluding quantification of annotation variability between observers. The tumor-cell classifier was trained interactively rather than with a held-out training and validation split, although its accuracy was subsequently confirmed against an independent, blinded cell-level ground truth. Furthermore, the intensity thresholds were calibrated by a single reader, allowing quantification of intraobserver reproducibility across three repeated calibrations, but not interobserver variation in threshold setting. Since threshold calibration was the largest source of measurement variability identified, between-reader variation at this step is the most important open question for multi-center use. Each case was represented by a single annotated core, which under-samples intratumoral heterogeneity. Finally, deaths were heavily concentrated in the advanced group, with only two among 319 early gastric cancers. This precluded a stable model using stage as an ordinary covariate. Treatment details, including adjuvant chemotherapy, were unavailable, and progression-free survival was not analyzed. Thus, the survival analyses serve as a supporting check of cutoff behavior rather than a prognostic claim.
Against these limitations, the digital workflow offers real advantages over visual interpretation alone. Measuring nuclear DAB intensity by image analysis yields a continuous, reproducible quantity rather than a categorical impression. This approach confines the observer-dependent step to tumor annotation and threshold calibration, after which quantification becomes deterministic. Once an analysis protocol is established, it can be applied consistently to large datasets or across institutions, making the pipeline auditable. For instance, the detection parameters, classifier, and intensity thresholds used here are fully reported, allowing the workflow to be re-executed rather than merely described. Furthermore, measurements beyond the H-score, such as intratumoral heterogeneity or tumor-stroma relationships, can be extracted from the same data. These properties translate into concrete practical guidance. A laboratory adopting this pipeline need not replicate our exact detector, as the H-score proved robust to that choice. However, it should calibrate the intensity thresholds using its own material and report the calibration method. Because the two detectors produced systematically different H-scores, cutoffs are not transferable between detection algorithms and should be re-derived whenever the detector or staining protocol changes.
In conclusion, digital image analysis provides a reproducible quantification of p53 immunohistochemistry in gastric cancer. This quantification is robust to the choice of cell-detection algorithm and to repeated calibration of the intensity thresholds. Among the five cutoff strategies compared, the two derived against the manual three-tier IHC interpretation as the reference standard—the extended Youden index and the ROC-surface criterion—performed equivalently and were statistically indistinguishable. We propose the former as a reasonable default and regard the latter as an equally defensible alternative, as the choice between them had no material effect on classification. The resulting classifications were associated with OS, although prognostic prediction was not the primary aim of this study. Evaluation in independent cohorts and correlation with TP53 sequencing are required before these cutoffs can be considered for clinical use.
Supplementary Information
The Data Supplement is available with this article at https://doi.org/10.4132/jptm.2026.08.13.
Notes
Ethics Statement
This study was approved by the Institutional Review Board of Kangbuk Samsung Hospital (KBSMC IRB 2023-11-039-002; December 27, 2023) and conducted in accordance with the Declaration of Helsinki. The requirement for informed consent was waived because clinical data were used retrospectively and de-identified.
Availability of Data and Material
De-identified clinical and analysis data are available from the corresponding author upon reasonable request.
Code Availability
The QuPath scripts, including the custom Groovy tools developed for manual H-score entry, and the R analysis code used for image quantification, cutoff derivation, and survival analysis, are publicly available in a GitHub repository (https://github.com/kbsmc-path/qupath-hscore-quantification-tools).
Author Contributions
Conceptualization: KK, SWC. Data curation: KK, YC. Formal analysis: JA, SWC. Investigation: KK. Funding acquisition: SWC. Methodology: JA, KK, HJY, YC, SWC. Project administration: KK, YC, SWC. Resources: KK, BS. Software: SWC, JA. Supervision: KK, YC, SWC, DHK. Validation: JA, SWC, BS, YC, KK. Visualization: JA, SWC, YC. Writing—original draft: JA, YC. Writing—review & editing: JA, KK, HJY, BS, DHK, YC, SWC. Approval of final manuscript: all authors.
Conflicts of Interest
The authors declare that they have no potential conflicts of interest.
Funding Statement
This research was supported by a grant of the Korea Health Technology R&D Project through the Korea Health Industry Development Institute (KHIDI), funded by the Ministry of Health & Welfare, Republic of Korea (grant number: HI21C1137).
Acknowledgments
Generative AI (QuillBot) was used solely for grammar and language polishing.