Can micro-CT distinguish between solid lung tumors? A comparative evaluation including solid adenocarcinoma, non-keratinizing squamous cell carcinoma, and carcinoid tumor
Article information

Abstract
Background
Some pulmonary carcinomas display a solid pattern, and immunohistochemistry is commonly used for tumor differentiation. Micro–computed tomography (micro-CT), with its ability to produce detailed three-dimensional images using small voxel sizes, may offer additional insights. This study investigates whether three solid tumor types, solid adenocarcinoma (sAC), non-keratinizing squamous cell carcinoma, and carcinoid tumor (CaT), can be differentiated using micro-CT.
Methods
Fifteen paraffin blocks, five for each type, were scanned with micro-CT (Skyscan 1275, Bruker). These images were compared to whole slide images (WSIs) of the same tumors. Consequently, tumoral (n = 74) and non-tumoral (n = 49) regions of interest (tumor ROIs [tROIs] and non-tumor ROIs [ntROIs]) were selected on the micro-CT images and evaluated in terms of certain structural variables (percent object volume, structure model index, structure thickness, structure linear density, connectivity, connectivity density, open porosity, closed porosity) to investigate whether tumors can be differentiated from normal parenchyma and from each other.
Results
Although detailed images comparable to WSIs could not be obtained, it was considered an important advantage to be able to examine the entire depth of the paraffin blocks. tROIs and ntROIs could be distinguished based on all variables (p < .001). Additionally, sAC showed a notable difference from CaT in “percent object volume” (p = .011).
Conclusions
With ongoing technological advancements, improving image quality without compromising tissue integrity will likely accelerate the adoption of micro-CT in pathology labs. Moreover, structural variables derived from micro-CT images may support differentiation among tumor types.

INTRODUCTION
Histopathological classification plays a foundational role in both the diagnosis and clinical management of human tumors. Lung cancer is the leading cause of cancer-related death in both men and women worldwide [1]. The majority of lung malignancies are carcinomas, and these are categorized and graded based on criteria outlined in the World Health Organization (WHO) classification of thoracic tumors [2]. These tumors are traditionally classified into two categories: small cell and non–small cell carcinomas (NSCLCs) [3,4]. As is widely known, invasive adenocarcinomas (AC) and squamous cell carcinomas (SCCs) are part of the NSCLC group. In addition, carcinoid tumors (CaTs) are non–small cell neuroendocrine tumors of the lung. In addition to morphological assessment, immunohistochemical analysis serves as an important adjunctive tool, particularly in the evaluation of solid subtypes of the mentioned tumors which can be challenging in that context [5].
Histopathological examination has long been a reliable method for the diagnosis of human tumors and for guiding therapeutic decision-making. However, its inherently two-dimensional (2D) nature represents a significant limitation. Although small biopsies and surgical specimens, such as lymph nodes assessed for metastasis, are entirely submitted for histopathological examination, large tumor specimens are routinely sampled according to pre-defined protocols [6]. In cases where the tumor is not small, it is generally not feasible to examine the entire lesion in conjunction with all its relationships to surrounding tissues. Additionally, standard histology typically evaluates only a 4-μm-thick section taken from the superficial portion of the paraffin block, manually cut on a microtome [7]. As a result, diagnostically relevant information may be lost in the discarded tissue or remain buried deeper within the paraffin block. Furthermore, multiple processing steps introduce the risk of artifacts [8,9], which may compromise accurate interpretation. Lastly, small biopsies of solid lung tumors may pose a diagnostic challenge due to limited tissue for further investigations [2] which mostly require disruption of the relevant tissue by cutting.
Computed tomography (CT) is an imaging method used to visualize the internal structure of specimens by acquiring 2D projections (radiographs) from multiple angles [10]. These projections are used to reconstruct the specimen and allow for analysis and visualization of its internal three-dimensional (3D) architecture [10,11]. The key distinction between standard CT and micro–computed tomography (micro-CT) lies in their resolution capabilities [12]. Micro-CT offers significantly higher resolution compared to conventional CT [12].
Micro-CT is commonly used in various fields such as materials science, biology, geology, and engineering for studying the internal structure and properties of materials [13,14]. Micro-CT, which allows in-vivo and ex-vivo examinations [15,16], has been implemented in the field of medicine with many animal studies [17-23] and the applicability of micro-CT in the examination of various tissues has been investigated [24-29]. Certain micro-CT devices allow comprehensive evaluation of tumors, including their spatial relationships with surrounding tissues, prior to disruption of the integrity of the surgical specimen [30]. In this direction, the applicability of micro-CT in the examination of the bone and dental lesions [31,32], spleen [33], breast [34,35], lung [18,36,37], heart [38,39], kidney [40], liver [41], thyroid [42], soft tissues [43,44], and vascular tissues [45,46] has been examined. Studies regarding pulmonary tissues mostly examine non-tumoral pathologies [47] in a wide spectrum of animal models. This spectrum comprises the effect of coronavirus disease 2019 [48], the effect of drugs that cause lung fibrosis [49], interstitial lung diseases [50], radiation effect [51], infective pathologies [52,53], and vascular structures [54]. Thus, studies concentrating on pulmonary tumors with micro-CT are exceptionally rare [36]. Beyond the morphologic information and 3D evaluation obtained from micro-CT images, structural variables can serve as complementary analytical measures [30]. Those variables are revealed by mathematical calculations and define the content of the structure examined in 2D or 3D [55].
The first aim of this study was to compare the histopathological images of three different types of solid-patterned lung tumors (solid adenocarcinoma [sAC], SCC, and CaT) with the images obtained by scanning the paraffin-embedded tumor tissues with micro-CT. The second goal was to investigate whether the structural variables calculated from micro-CT images can be used to differentiate these tumor types. These tumor types were intentionally selected because they cannot be reliably discriminated from one another on routine hematoxylin and eosin (H&E) sections and therefore require ancillary immunohistochemical studies for definitive classification. The objective was to determine whether these entities, which cannot be confidently distinguished by conventional light microscopic assessment, could be differentiated through quantitative analysis of micro-CT–derived structural variables. Additionally, the relationships between these variables and histopathological features such as necrosis, glandular/pseudo-glandular areas, and fibrosis within the tumors were investigated.
MATERIALS AND METHODS
Case selection
Pulmonary tumor tissues from 15 patients, who were operated and routinely diagnosed between 2016 and 2021 in Ankara University Faculty of Medicine (AUFM), were used in this study. All cases were formalin fixed, and paraffin embedded (FFPE). Among these 15 cases, five were diagnosed as sAC, five as non-keratinizing SCC and, five as typical CaTs after histopathological and immunohistochemical evaluation. These tumor types were selected for inclusion in this study based on their shared morphological appearance, characterized predominantly by a solid organizational pattern, which renders their distinction by routine light microscopic examination challenging, despite their substantially different biological and clinical profiles. Non-solid AC patterns such as lepidic, micropapillary, papillary, and acinar were intentionally avoided, as their inherently heterogeneous architectural morphology could introduce confounding effects.
One representative FFPE block including both the tumor tissue and normal pulmonary parenchyma was retrieved for each case. This approach ensured that both tumoral and adjacent non-tumoral areas were represented within a single FFPE block. In this part of the study, we excluded any blocks whose corresponding H&E slides demonstrated tumor spread through alveolar spaces (STAS) as it can lead to secondary solidification within the non-tumorous lung parenchyma through single cells, micropapillary clusters, or solid nests [56], thereby potentially introducing confounding effects in the assessment of structural variables. Each selected block was randomly labeled from 1 to 15 at this point, to provide a blind approach in subsequent steps. After anonymization, two new unstained sections of 4 μm were obtained from each FFPE block. One of these sections was stained with H&E and the other one was stained with Masson trichrome (MT) to facilitate evaluation of fibrotic areas.
Digitization and annotation of cases
H&E and MT sections were scanned using a whole slide image (WSI) scanning and imaging system (3D HISTECH, Budapest, Hungary; Pannoramic P250 Flash III and Panoramic Scanner ver. 3.0.2; Slide Viewer ver. 2.5, RTM) in AUFM, Department of Pathology. To ensure created section quality, all sections were scanned at ×40 magnification. A total of 30 WSIs of 15 cases were created. On 15 H&E-stained digital images, a total of 74 tumoral and 49 non-tumoral regions of interest (tumor ROIs [tROIs] and non-tumor ROIs [ntROIs]) each with an area of 1 mm2 were annotated. Twenty-five tROIs (54.3%) and 21 ntROIs (45.7%) were marked from the sAC group. In CaTs, 24 tROIs (58.5%) and 17 ntROIs (41.5%) were selected. In the SCC group, 25 tROIs (69.4%) and 11 ntROIs (30.6%) were marked (Fig. 1).
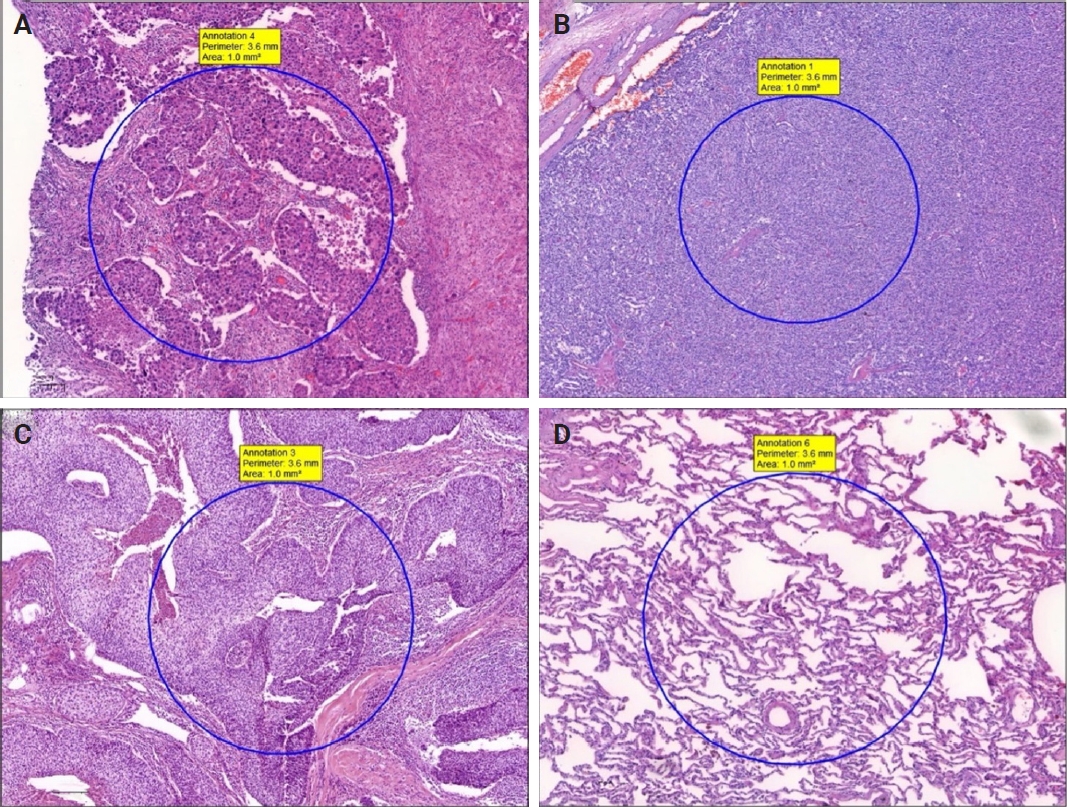
Manual tumoral and non-tumoral annotations (A–D). Four regions of interest from a solid adenocarcinoma (sAC) (case 1), a carcinoid tumor (case 7), a squamous cell carcinoma (case 11), and non-tumoral lung parenchyma around sAC (case 1), respectively.
In addition, for each case, the border of tumor was marked, and total area occupied by the tumor was calculated. Moreover, to compare with structural variables, areas occupied by necrosis, pseudo/abortive glandular areas, and fibrotic areas within the tumor were annotated on MT and H&E-stained WSIs. The ratio of the area occupied by the areas showing these three features to the entire tumor area was calculated (Fig. 2).
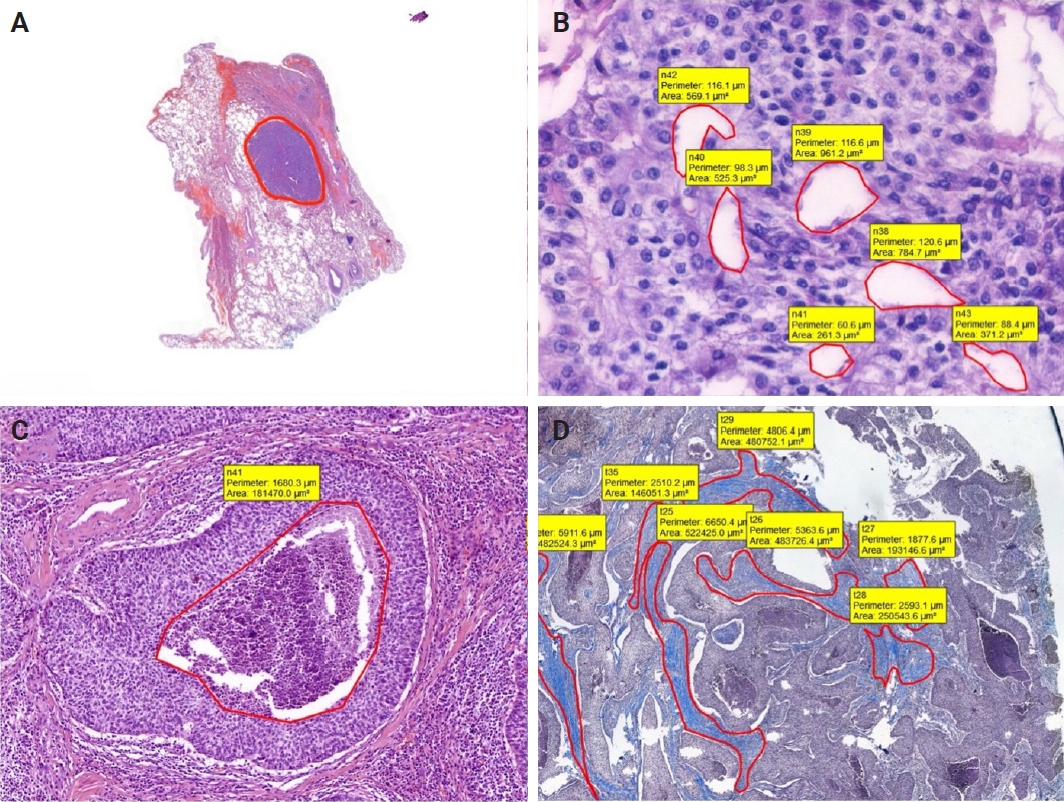
Annotation examples of whole tumor, pseudo-glandular spaces, necrosis, and fibrosis. (A) Annotated whole tumor (case 2). (B) Pseudo-glandular spaces (case 8). (C) Necrosis in the middle of the tumor island (case 11). (D) Fibrotic areas (case 11, Masson trichrome).
On H&E-stained sections, fibrosis, necrotic areas, and pseudo/abortive glandular structures, which are thought to have a possible impact on the X-ray absorption and the values of structural variables, were marked. For the whole dataset, a total of 1,789 areas in the sAC group, 1,885 areas in the CaT group, and 421 regions in SCC group were annotated.
On MT stained WSIs, 102 fibrotic areas in the sAC group, 109 fibrotic areas in the CaT group and 140 fibrotic areas in the SCC group were marked.
Micro-CT scanning
After obtaining H&E and MT sections, cassettes were gently removed from paraffin-embedded tissues using a knife. To ensure compatibility of micro-CT images and virtual histopathological slides, FFPE tissues were placed at the right angles with a specimen holder. High-resolution, desktop micro-CT system (Skyscan 1275, Bruker, Kontich, Belgium) was used to scan the tissues within paraffin. The scanning conditions were as follows: 32 kVp, 220-µA, without any filter, 10.1 µm pixel size, 50 millisecond exposure time, and 3 frame average. Scanning was carried out 360º with rotation at 0.2 steps. To minimize ring artifacts, flat field correction was carried out prior to each scanning. The mean time of scanning was around 30 minutes for each paraffin block. Other settings included beam hardening correction, as described in the manufacturer’s manual and input of optimal contrast limits according to manufacturer’s instructions, based on prior scanning and reconstruction of each sample. After the tissues were scanned, the paraffin blocks were remounted on corresponding cassettes and returned to the Archives of AUFM, Department of Pathology without compromising tissue integrity.
Micro-CT image analysis
The NRecon software (ver. 1.6.10.5, SkyScan, Bruker) was used with the modified algorithm described by Feldkamp et al. [57] to obtain axial, 2D, 1,000 × 1,000-pixel images via reconstruction of the raw data. For the reconstruction variables, ring artifact correction and smoothing were fixed at zero and the beam artifact correction was 38%. By using the NRecon software (SkyScan, Bruker), the images obtained by the scanner were reconstructed to show 2D slices of the specimen. The cross-sectional images were reconstructed to obtain the whole of the samples. The reconstructed images which were further processed in Skyscan CTVox for visualization (v. 3.3.1, SkyScan, Bruker) (Fig. 3).
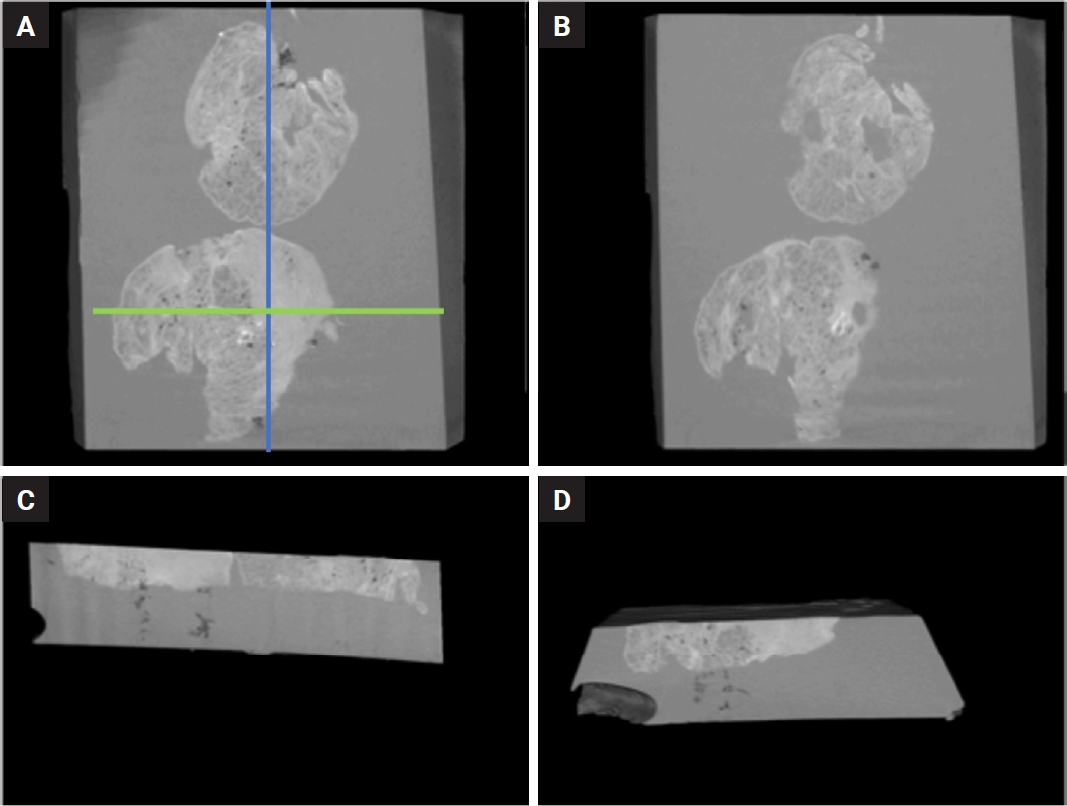
Digital sections obtained from the paraffin block of an adenocarcinoma (A–D). A and B show relatively superficial (A) and deeper (B) levels of the block, respectively, parallel to the routine hematoxylin and eosin plane, demonstrating a reduction in the tumor size at the deeper level (B). (C) A section perpendicular to the block surface, oriented parallel to the long axis of the block, allowing visualization of both tissue samples within the block. (D) A section oriented parallel to the short axis showing only one of the tissue samples. The approximate orientations corresponding to sections C and D are indicated by the blue and green lines on Fig. 3A, respectively. Micro–computed tomography video of this block is also provided as a Supplementary Video S1. This video was obtained from a preliminary experiment and does not represent one of the cases in the present study.
CTAn (ver. 1.19.11.1, SkyScan, Bruker) was used for the quantitative measurements of the samples and the selection of the regions of interest (ROIs) and volume of interests (VOIs). Micro-CT images and corresponding annotated H&E images were examined side-by-side on two separate screens. Micro-CT images were viewed at different angles and depths and compared with WSIs. Afterwards, by choosing the micro-CT plane corresponding to the H&E section; all ROIs were transferred manually on the micro-CT images with the help of reference points (cartilage, vascular structures, bronchi, cystic areas, etc.). For further analysis, ROIs on micro-CT images and cubic VOIs with a total volume of 1 mm3 under these ROIs were used. The ROI number generated on the H&E slides were also assigned to the corresponding VOIs. One micro-CT expert and one pathologist carried out the ROI detection of the micro-CT images.
To differentiate the malignant tissue from the normal tissue, a suitable threshold is required. For this instance, the original grayscale images were processed with a Gaussian low-pass filter for noise reduction, and a semi-automatic global threshold method was used. In that process, the middle value of the gray scale was calculated using semi-automatic global threshold. After the thresholding (binarization) process, an imposed image of black/white pixels was achieved. The binarization process was applied to all samples with the same parameters. All specifications of the CTAn software were used to analyze the 3D microarchitecture of each sample. The following structural variables were calculated: percent object volume (POV), structure model index (SMI), structure thickness (ST), structure linear density (SLD), connectivity, connectivity density (CD), open porosity (OP), and closed porosity (CP).
Calculation of structural variables within ROIs/VOIs
The calculated structural variables are explained below: While connectivity and CD values were calculated in 3D (at VOI level), other variables were calculated in 2D (at ROI level).
POV is the percentage of the solid tissue occupancy in the analyzed VOI. This variable has been widely used in studies aiming to calculate bone-related trabecular bone loss and gain [58]. When formulated, it can be expressed as “POV = volume of solid tissue/volume of all relevant VOI” [59].
SMI describes the shape of the structures in the tissue. It shows the relative prevalence of rods and plates within the tissue. It allows to calculate the surface convex curvature in a 3D structure such as trabecular bone. For example, in osteoporosis, the difference between the deterioration of trabecular bone and the conversion from plate-like internal structures to rod-like architecture can be calculated with this variable [55,59].
ST determines the thickness of solid structures in the examined VOI. In other words, the ST provides a value indicating the 3D thickness. This value, which is calculated as “trabecular thickness” in bone studies, is called ST in general scientific terminology [55,59].
SLD corresponds to the number of trabeculae, a term widely used in bone studies. It refers to the number of solid area transitions per unit length on a random line along the VOI/ROI [55,59]. This value provides insight into the homogeneous or heterogeneous distribution of internal structures within the material.
Connectivity (C) is an indicator of the relationship between solid structures in a VOI. It is a measure of how many connections can be broken within a tissue before it splits into two separate parts. These variables reflect the relative positions of the components forming the internal structure of the material and their relationships with the porous architecture. CD refers to the value of C per unit volume [59]. C and CD analyses were calculated in 3D and integrated into the CTAn software. Both analyses use the Euler analysis [60].
Porosity (P) is a term used to express void/porous areas in a substance. Other terms used for P are pore number, pore volume, pore surface, and percentage of pores. The volume of all porous spaces in the material can be expressed as total porosity and is obtained by adding OP and CP. p-values are expressed as percentages [55]. An open pore is defined as a pore that is intersecting with the boundary of the ROI/VOI. Namely, an open pore is connected to the outside in 2D or 3D, while a closed pore is not [55]. A closed pore, on the other hand, refers to the pores that are completely surrounded by solid tissue as a result of the 3D evaluation of the material [55]. In this study, a closed pore is viewed as black pixels that were surrounded by a border of white pixels.
Statistical analysis
The relationships between the values obtained as a result of the calculations on the VOIs and the tumor type were investigated statistically. IBM SPSS Statistics ver. 23.0 (for Windows, IBM Corp., Armonk, NY, USA) software was used in all statistical analyses. Since the distribution of data was not normal, the non-parametric Kruskal-Wallis test was used to compare more than two groups, and the Mann-Whitney U test was used to compare two groups for all structural variables.
K-means clustering analysis was performed to classify the observations as tumor and non-tumor using all structural variables. The agreement of the cluster analysis results with tumor and tumor-free areas was examined by Cohen's Kappa coefficient. The receiver operating characteristic (ROC) analysis was used to find the optimal cut-off values in the variables to distinguish between those with and without tumors. The suitability of the classifications was evaluated with the area under the curve (AUC), and with the criteria of sensitivity and specificity.
The workflow of this study is summarized in Fig. 4.
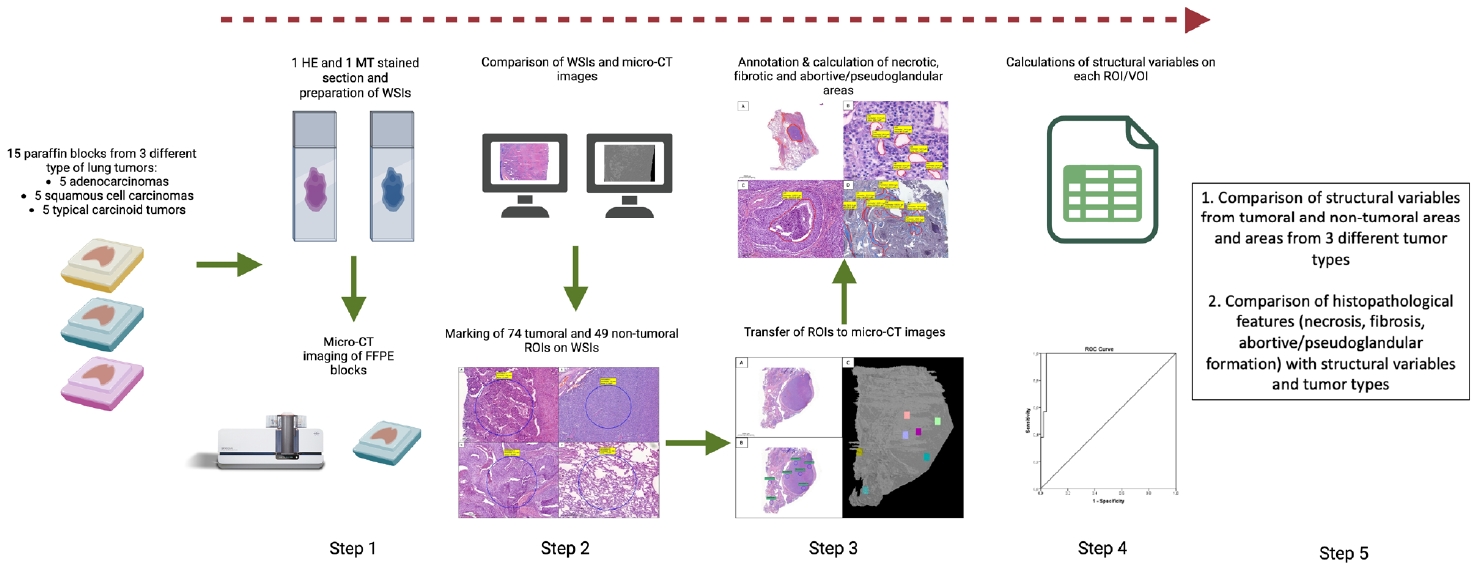
Workflow of the current study. Created with BioRender.com. FFPE, formalin-fixed-paraffin-embedded; H&E, hematoxylin and eosin; MT, Masson trichrome; micro-CT, micro–computed tomography; ROI, region of interest; VOI, volume of interest; WSI, whole slide image.
RESULTS
Clinical, histopathological, immunophenotypic, and molecular characteristics of the tumors
Of the 15 tumors analyzed in this study, five were sAC, five were non-keratinizing SCC, and five were typical CaTs. Seven patients (46.7%) were female and eight (53.3%) were male. The mean age of the patients was found to be 61.4 years (range, 49 to 72 years). There was no statistically significant difference among tumor types in terms of tumor size, patient age, sex, localization, type of operation, pleural invasion, lymphovascular invasion, perineural invasion, STAS, multifocality, or lymph node metastasis. The characteristics of the cases are summarized in Supplementary Table S1 and S2.
Comparison of tumoral and non-tumoral VOIs in terms of structural variables
Seventy-four tumoral and 49 non-tumoral VOIs and ROIs were compared in terms of structural variables. Variables that represent solid structures (POV, ST, SLD, C, CD, and CP) showed higher values in tumoral regions, whereas SMI and OP, which characterize highly porous structures such as lung parenchyma, were found to be higher in non-tumoral areas. According to this, POV, SMI, ST, SLD, C, CD, OP, and CP variables were found to be statistically significant in terms of separating tumoral and non-tumoral areas (all p < .001) (Table 1).
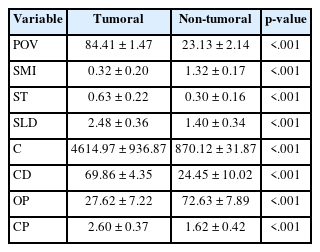
Descriptive statistics of structural variables for tumoral and non-tumoral areas
Based on the cluster analyses performed, Kappa, sensitivity, specificity, AUC, and cut-off values specific to each structural variable were determined. Except for ST, the lowest observed values among all variables were a kappa of 0.87, a sensitivity of 0.94, a specificity of 0.94, and an AUC of 0.92. These findings highlight that, when appropriate cut-off thresholds are applied, the numerical outputs of these variables can sharply discriminate between tumoral and non-tumoral regions. Additionally, when clustering was done by considering all nine variables described together, all the non-tumoral and tumoral ROIs were clustered correctly (kappa = 1). Table 2 summarizes the results of statistical analyses. ROCs are also shown in Supplementary Fig. S1.
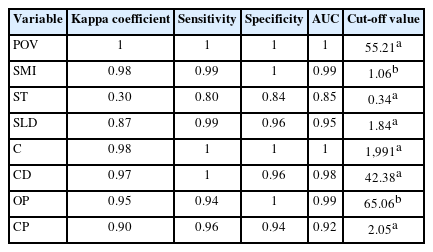
Kappa coefficients for the results obtained from cluster analysis, and ROC analysis results of tumoral and non-tumoral ROI/VOI
Comparison of three tumor types in terms of structural variables
There was no statistically significant difference found among these three tumor types for SMI, ST, SLD, C, CD, OP, and CP (Table 3). However, a statistically significant difference was found among these three tumor types in terms of the POV (p = .035). When the origin of this difference was investigated with the Mann-Whitney U test: there was no statistically significant difference detected between sAC/SCC (p = .560) groups and CaT/SCC (p = .072) groups in terms of this variable. On the other hand, a statistically significant difference in POV was observed between the sAC and CaT ROIs (p = .011).
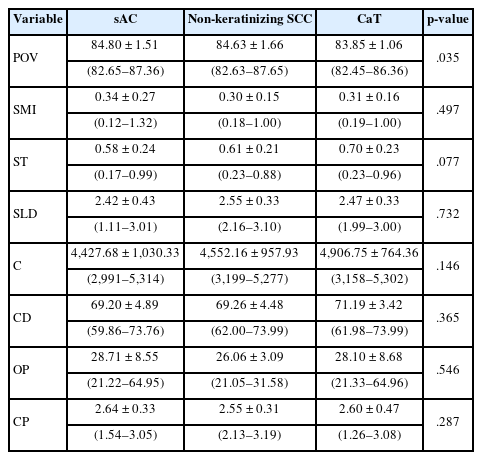
Descriptive statistics of structural variables for three tumor types and p-values
The relationship between histopathological features and structural variables
In the current study, fibrotic areas were expected to appear radiodense (white), while necrotic and pseudo/abortive glands were assumed to be radiolucent (black) on micro-CT images. To identify any possible differences within different tumors, 4,095 annotated ROIs across all tumors in H&Es were used. No statistically significant difference was found between tumor types (p = .141).
In terms of tumor types, it was concluded that the percentage of fibrotic areas to the overall tumoral area did not show a statistically significant difference (p = .102), on digitized MT sections (Supplementary Tables S3–S5).
DISCUSSION
In this study, we demonstrated the feasibility and applicability of micro-CT for non-destructive 3D structural analysis of FFPE blocks of solid pulmonary tumors. Using micro-CT scans, we successfully segmented tumoral versus non-tumoral compartments via quantitative structural variables. Taken together, we believe that our findings support the utility of micro-CT as a complementary tool for enhancing tissue characterization and morphology-driven assessments in human tumors, particularly when integrated with routine histopathological workflows.
Histopathological examination under light microscopy is the gold standard for diagnosing human tumors. This long-established technique is a very powerful tool and offers high-resolution imaging at relatively low cost. In pulmonary tumors, standardized guidelines are followed in the routine diagnostic process to highlight relevant and important prognostic findings [61]. When combined with immunohistochemistry and molecular approaches, light microscopy plays a critical role in both diagnosis and treatment planning. Despite its long-standing and indispensable role in routine practice, conventional histopathological approach is inherently limited as it depends on 2D sections obtained from the most superficial layers of paraffin blocks, which themselves represent only preselected portions of the specimens.
Technical developments in recent years have changed the daily practices of both histopathology laboratories and specialists. Currently, in some laboratories, routine histopathological evaluations are conducted using WSIs rather than conventional light microscopy [62]. It is possible to obtain 3D images using consecutive WSIs. For example, Hashimoto and colleagues investigated the 3D structure of human brain tissue through WSIs [63]. In this study, WSIs were created by digitizing H&E sections, and the material was reconstructed in 3D through consecutive layered 2D WSIs. However, this method has some caveats: to reliably scan the tissue in 3D, a minimum of 50 sections is necessary; and to obtain an optimal 3D model, at least 100–200 consecutive sections should be digitized and converted into 3D, using a dedicated software [64]. In routine pathology practice, the deeper portions of paraffin blocks are examined by preparing additional sections. However, tissue lost between sections due to trimming cannot be recovered unless all levels are stained and examined. Cutting and examining all levels is impractical due to internal regulations, cost, and workload. Consequently, deeper tissue features within the block, such as invasive components with potential diagnostic or prognostic significance, may remain undetected. Even with additional deep sectioning and extra gross sampling, important findings may still be missed in the final pathology report. On the other hand, using radiological methods, 3D images can be obtained. Thanks to the recent advancements, the images obtained via 3D techniques offer similar performances regarding high resolution of H&E [28,65-70]. Additionally, unlike routine sectioning, micro-CT enables digital slicing at any desired level without physically disrupting tissue integrity. For instance, in thyroid tumors, capsular invasion is a key diagnostic criterion. It has been shown that micro-CT increases the number of detected foci of capsular invasion compared to conventional 2D histology [42]. In such cases, it may be more accurate and easier to detect the invasion using micro-CT, rather than serial sectioning of the whole FFPE block. In this manner, the invasive properties of tumors and their proximity to surgical margins can be assessed prior to tissue disruption. It may potentially allow for a more efficient histopathological analysis with reduced sampling and cutting. In this study, we assessed the degree to which morphological characteristics of three different lung tumors could be discerned in micro-CT images of paraffin blocks. We were able to differentiate tumoral areas from surrounding lung parenchyma within the FFPE blocks, and in several cases, we noted that both the size and the configuration of the tumor changed in the deeper portions of the block relative to the superficial sections (Fig. 5). Furthermore, we could identify specific features such as bronchi, vascular structures, calcifications in the micro-CT images (Supplementary Video S1). Based on these observations, we believe that micro-CT enables an assessment of tumoral and non-tumoral parenchymal features in FFPE blocks.

Micro–computed tomography–generated automatic color-enhanced visualization of the most superficial (A) and a deeper portion (B) of the formalin-fixed-paraffin-embedded block (case 1). The corresponding hematoxylin and eosin whole slide image for the case is shown in the inset. Red markers delineate the tumor-containing area. This image demonstrates that the tumor area that appears larger in the superficial image is reduced in size in the image representing the deeper portion of the block. This finding highlights the potential advantage of a three-dimensional modality in enabling pathologists to more effectively select context-appropriate sections for further histologic evaluation.
Certain micro-CT systems possess sufficient capacity to enable the comprehensive evaluation of an entire surgical specimen without compromising its integrity [34,71]. The capability of micro-CT for 3D tissue visualization can be utilized during the macroscopic evaluation and sampling stage in histopathological examination of surgical materials, or during intraoperative consultations [72,73]. In fact, previous studies have identified that micro-CT may be valuable in assessing surgical margins, especially in breast carcinoma specimens [73]. Additionally, micro-CT has demonstrated superior capability in estimating tumor burden [42] and offered improved predictive performance in comparison to routine histopathological evaluation [28]. In the context of lung cancer, micro-CT has the potential to facilitate detection of vascular and pleural invasion sites, and identification of STAS which may remain inconspicuous on conventional 2D histological sections. In the setting of the increasing number of sublobar resections performed today, micro-CT may find a role in the intraoperative assessment of surgical margins. As another complementary tool to micro-CT and routine H&E staining, virtual staining is also offering another powerful method to obtain pseudo-H&E images [74]. For histopathologists, pseudo-H&E images (Supplementary Fig. S2) can be created in shades of pink and purple instead of grayscale images [75].
Micro-CT images, like H&E images, can serve as the basis for morphometric measurements and comparisons. Morphometric evaluations and comparisons that can be performed on micro-CT images can be mostly found in bone and dental lesions [76]. Nakamura et al. [77] investigated the recognizability of the lepidic pattern in 10 lung tumor resection specimens using micro-CT images. In this study, micro-CT images were able to distinguish between thin and thick alveolar walls suggesting that micro-CT could separate normal lung areas from lepidic AC. In the present study, various structural variables of the tumoral and non-tumoral areas were calculated based on micro-CT images. Similar to previous studies conducted by our team, structural variables were found to exhibit statistical differences between tumoral and non-tumoral regions, and it was also demonstrated that tROIs and ntROIs could be clustered separately using these structural variables [30,78].
The structural variables used in our study seem more relevant to material science and certain engineering fields rather than medicine. Elucidating the meaning of these structural variables and their relationship to the architectural features of diseased and normal tissues may facilitate the interpretation of tumor type divergence. Understanding the structural differences between non-tumoral tissue and tumoral tissue is relatively easy. For example, as revealed by our results, a higher density of interconnecting tumor cells in tROIs is reflected in higher POV, ST, SLD, C, and CD values than in normal lung parenchyma. The blind glandular or pseudo glandular areas within a tumor will result in a higher CP value, while high OP values are anticipated in lung tissue containing interconnecting air spaces. Hypothetically, different tumor types may also have identifiable differences in structural variables, although they may not be apparent visually. In this study, the POV variable showed a statistically significant difference between sAC and CaT groups. One possible explanation could be the higher cellular density of sAC compared to CaT. Non-tumoral features such as fibrosis, necrosis, and inflammatory foci may also have played a role in this result. Upon retrospective review of cases, although not statistically significant, it was observed that desmoplastic stroma/fibrosis was more prominent in sACs and SCCs compared to CaTs, which may be related with higher POV. It is estimated that X-ray absorption is higher in fibrotic areas, and therefore, this value is expected to be high. To confirm this, further investigations should be conducted with a larger number of cases. Different tissue components such as cartilage, lymph nodes, inflammatory cells, and vascular structures may also have an impact on structural variables.
In contrast, no significant differences were observed in other structural variables among the three tumor types. The lack of statistical difference in terms of other structural variables may be attributed to the shared architectural features across all tumor types examined in this study. However, a larger sample size might unveil more pronounced distinctions. On the other hand, tumors with different architectural features (e.g., papillary, micropapillary structures and glands), are more likely to diverge from each other in terms of one or more structural variables. In parallel to this, there may be differences among the tumor types in terms of other structural features that are not addressed in this study. For example, fractal dimension (FD), which is a quantitative descriptor of the geometric complexity, was not addressed in the present study. In medical materials, FD has been shown to capture diagnostically relevant alterations [79,80]. Higher FD values reflect more intricate and dense structures, while lower values indicate simpler and more sparse organization. As this structural feature was not examined in our study, we are unable to comment on potential differences across the solid tumor types included in our study. In addition, we believe that such numerical parameters could form the basis for artificial intelligence (AI) based classification models. Combining FD and other structural variables may significantly enhance the discriminatory power of deep learning algorithms. Thus, these parameters represent promising candidates for the development of novel digital biomarkers and translational diagnostic tools in future studies.
Micro-CT rapidly digitizes the internal and external 3D structures of a sample with high, often sub-micron, resolution [81]. As discussed, its key advantage lies in visualizing internal features without destroying the specimen. Micro-CT enables quantitative 3D analysis of structural variables such as density, porosity, and ST, making it ideal for rare or valuable samples [82]. However, higher resolution demands longer scan times and increased radiation exposure, which may damage genetic material [81]. Therefore, as molecular testing becomes increasingly central to tumor classification and targeted therapy, the potential effects of micro-CT on subsequent molecular analyses need careful evaluation.
There are some restrictions of the current study. First one is the limited number of cases per each tumor type. Although the number of patients included in the study was relatively small, the large number of analyzed areas (n = 123) partially compensates for this limitation. Consequently, we believe, this work stands as an important study in the field, evaluating a significant number of regions within the context of frequently encountered lung tumors with solid organization. A second limitation is that ROI-to-VOI transfer was performed manually instead of using an automated workflow. While this limits perfect one-to-one 100% correspondence, the objective was to ensure that selected areas reliably represented either tumoral or non-tumoral regions. Thus, it was assumed that this manual step had minimal impact on overall statistical outcomes. Additionally, WSIs were generated solely from the surface section of paraffin blocks and structural variable analyses were not performed in a fully 3D context, which may limit the depth of morphological assessments. Additionally, the average voxel size of the micro-CT used in our study is approximately 10 μm. However, contemporary micro-CT/nano-CT devices can achieve pixel sizes as small as 50–500 nm and highly precise resolutions [83].
In the context of rapidly advancing technology, it is anticipated that improvements in micro-CT technology, characterized by shorter scanning times and enhanced image quality, will enable 3D imaging approaches to approximate, and potentially match, the resolution achieved by conventional H&E sections. Therefore, diagnostic images can be created without compromising tissue integrity. In the era of AI algorithms, these approaches are expected to play an important role in diagnostic and prognostic assessment and, in time, may become more embedded in routine pathology practice. Therefore, the integration of micro-CT and other 3D imaging techniques with AI holds considerable promise for supporting pathologists in clinical decision-making.
Supplementary Information
The Data Supplement is available with this article at https://doi.org/10.4132/jptm.2025.12.16.
Notes
Ethics Statement
The study was conducted in accordance with the Declaration of Helsinki and approved by the Ankara University Faculty of Medicine Human Research Ethics Committee (I01-17-22). Written informed consent was obtained from all subjects involved in the study.
Availability of Data and Material
Generated and analyzed data during the current study are included in this article as tables, figures, and supplementary materials. Further inquiries can be directed to the corresponding author.
Code Availability
Not applicable.
Author Contributions
Conceptualization: SDS, SS. Data curation: SS, KO, AB. Formal analysis: DK. Investigation: SS, KO, AB. Funding acquisition: SDS, SS. Methodology: SS, SDS, AB, DK, HO, AKC. Project administration: SDS. Resources: KO. Supervision: SDS. Validation: SS, DK. Writing—original draft: SS, SDS. Writing—review & editing: SDS, KO, AKC. Approval of final manuscript: all authors.
Conflicts of Interest
The authors declare that they have no potential conflicts of interest.
Funding Statement
This study was supported by Ankara University Scientific Research Fund (BAP-2351).
Acknowledgments
The microscopic evaluation and quantification in this study is done by the digital pathology system obtained by Ankara University Scientific Research Fund (BAP) project (14A0230003).