E-cadherin expression and tumor-stroma ratio as prognostic biomarkers of peritoneal recurrence in advanced gastric cancer: a digital image analysis-based stratification study
Article information

Abstract
Background
Gastric cancer remains a significant global health burden, with a high peritoneal recurrence rates after curative surgery. E-cadherin and the tumor-stroma ratio (TSR) have been proposed as prognostic indicators, but their combined prognostic utility remains unclear.
Methods
This retrospective study included 130 patients with T3/T4a gastric cancer who underwent curative gastrectomy at Ulsan University Hospital between 2014 and 2019. Immunohistochemistry for E-cadherin and Vimentin was performed. Digital image analysis using QuPath’s object classifier quantified E-cadherin expression and TSR.
Results
Low E-cadherin expression was associated with diffuse-type histology and advanced T stage. Low TSR was linked to younger age, female sex, and XELOX treatment. In Kaplan-Meier analysis, low TSR showed a non-significant trend toward higher peritoneal recurrence (p = .054), while low E-cadherin expression was significantly associated with increased peritoneal recurrence (p = .002). Combined biomarker analysis also revealed a significant difference in recurrence-free survival (RFS) among the four groups (p = .005); patients with both high TSR and high E-cadherin expression experienced the most favorable RFS. In multivariable analysis, E-cadherin expression remained the only independent predictor of peritoneal recurrence (high vs. low; hazard ratio, 0.348; 95% confidence interval, 0.149 to 0.816; p = .015).
Conclusions
E-cadherin and TSR reflect distinct tumor biology such as epithelial integrity and stromal composition, and their combined evaluation improves prognostic stratification. Digital image analysis enhances reproducibility and objectivity, supporting their integration into clinical workflows.

INTRODUCTION
Gastric cancer ranks among the most commonly diagnosed malignancies worldwide, representing the fifth most frequent cancer and the fifth leading cause of cancer-related mortality, accounting for approximately 6.8% of all cancer deaths globally [1]. Despite significant advances in surgical techniques and systemic therapies, gastric cancer remains characterized by a high rate of postoperative recurrence, which contributes substantially to its poor overall prognosis [2]. Peritoneal recurrence, in particular, represents a major clinical challenge, occurring in approximately 29% to 38% of patients after curative resection and associated with a median survival of only four months [3,4].
E-cadherin is a calcium-dependent transmembrane glycoprotein encoded by the CDH1 gene located on chromosome 16q22.1. It plays a pivotal role in maintaining epithelial architecture by mediating intercellular adhesion, and its dysregulation contributes to tumor initiation, progression, invasion, and metastasis [5]. Loss of E-cadherin function is a hallmark of epithelial-mesenchymal transition (EMT), a biological process in which epithelial cells acquire mesenchymal features, enhancing migratory and invasive potential [4]. Aban et al. [4] reported that diminished membranous E-cadherin expression facilitates EMT via activation of key transcription factors, including Snail, Slug, Twist, and ZEB-1. Multiple studies have demonstrated that aberrant E-cadherin expression is significantly associated with higher tumor stage, greater depth of invasion, lymph node metastasis, and unfavorable histologic features, thereby underscoring its value as a marker of tumor aggressiveness in gastric cancer [6,7].
The tumor-stroma ratio (TSR), defined as the proportion of tumor cells relative to stromal tissue, has emerged as a novel prognostic marker across various malignancies, including colorectal, prostate, breast, ovarian, cervical, nasopharyngeal, hepatocellular, esophageal, and lung cancers [2,8]. In the context of gastric cancer, stroma-poor tumors have been associated with improved overall survival and disease-free survival [2]. Tian et al. [9] reported that a high proportion of stromal area was significantly associated with aggressive tumor phenotypes and reduced cancer-specific survival, supporting the prognostic relevance of TSR in gastric cancer. TSR can be readily assessed on hematoxylin and eosin (H&E)–stained slides using conventional light microscopy, making it a practical biomarker for routine pathologic evaluation [2,10].
Despite growing interest in both E-cadherin and TSR as prognostic markers, limited research has investigated their interrelationship or joint predictive utility in gastric cancer. Several studies have directly evaluated the association between E-cadherin expression and peritoneal dissemination [11-16], including meta-analyses confirming a significant correlation [17]. Conversely, studies exploring TSR in relation to peritoneal recurrence are scarce [8], and, to our knowledge, no study has concurrently assessed both E-cadherin and TSR in predicting peritoneal recurrence.
The present study aimed to evaluate the prognostic relevance of E-cadherin expression and TSR, investigate their correlation, and determine whether their combined assessment enhances risk stratification for peritoneal recurrence in patients with advanced gastric cancer. To ensure robust and reproducible measurement, digital image analysis was employed for the quantitative evaluation of both markers, thereby minimizing interobserver variability and enhancing analytical precision.
MATERIALS AND METHODS
Study population and data collection
This retrospective study included 130 patients diagnosed with T3 or T4a advanced gastric cancer who underwent curative gastrectomy at Ulsan University Hospital between January 2014 and December 2019. Among an initial cohort of 292 patients, cases were excluded based on the following criteria: (1) presence of other primary malignancies, (2) positive intraoperative peritoneal lavage cytology, (3) M1 category at the time of diagnosis, or (4) involvement of the resection margin. Clinical and pathological data were retrieved from electronic medical records and included patient age, sex, tumor size, gross morphology, histologic type, TNM stage, lymphovascular invasion, perineural invasion, resection margin status, and results of abdominal washing cytology. TNM staging was based on the 8th edition of the American Joint Committee on Cancer (AJCC) classification system [18]. Tumor gross type was categorized according to the Borrmann classification [19], and histological subtype was classified based on the Lauren classification [20].
Slide selection
Representative formalin-fixed, paraffin-embedded (FFPE) tissue blocks were selected for each case. All H&E-stained slides were reviewed to identify the slide demonstrating the deepest tumor invasion. In cases where visual assessment was inconclusive, 2–3 candidate slides were scanned, and the depth of invasion was digitally measured to confirm selection.
Immunohistochemistry
Immunohistochemical staining for E-cadherin and Vimentin was performed on FFPE sections using an automated immunostainer (Bond-PRIME, Leica Biosystems, Buttalo Grove, IL, USA). The primary antibodies used were anti-E-cadherin (1:100 dilution, clone NCH-38, DAKO, Glostrup, Denmark) and anti-Vimentin (1:1000 dilution, clone V9, Invitrogen, Carlsbad, CA, USA). Antigen retrieval was conducted using Bond-PRIME Epitope Retrieval Solution 2 (EDTA-based buffer, pH 9.0) for E-cadherin, and Bond-PRIME Epitope Retrieval Solution 1 (citrate-based buffer, pH 6.0) for Vimentin, both at 104°C for 20 minutes. Endogenous peroxidase activity was blocked using a peroxide block for 3 minutes. Sections were then incubated with the primary antibodies for 15 minutes, followed by post-primary reagent incubation for 8 minutes. Detection was performed using a polymer-based detection system (Bond Polymer Refine Detection Kit, Leica Biosystems) for 8 minutes. Visualization was achieved using 3,3'-diaminobenzidine (DAB) chromogen for 10 minutes. Finally, the slides were counterstained with hematoxylin for 4 minutes, rinsed with distilled water, and mounted after dehydration.
Digital image acquisition
Whole-slide images of H&E-stained sections and immunohistochemically stained slides for E-cadherin and Vimentin were acquired at 40× objective magnification using an Aperio GT450 DX scanner (Leica Biosystems). Digital image analysis was performed using QuPath software ver. 0.5.1.
E-cadherin expression analysis
E-cadherin expression was evaluated in three representative tumor regions located at the deepest point of the tumor-invasive front, selected by a pathologist (B.K.). Regions were required to show well‑preserved viable tumor cells, while areas with extensive necrosis, ulceration, or artifacts were excluded. All regions were analyzed at 400× magnification, and fields in normal gastric mucosa (when available) were selected at the same magnification for comparison. Cell detection was performed using QuPath’s built-in algorithm, followed by manual verification by a pathologist (B.K.). An object classifier was trained to differentiate tumor from stromal cells based on cell-level features including intensity, morphology, and spatial parameters. For each region, the mean DAB optical density (OD) of positively stained tumor cells was calculated. For normal mucosa, the mean DAB OD of all positive epithelial cells was measured. The tumor-to-normal ratio was then computed to normalize for staining variability across slides. When adjacent normal mucosa was absent, a cohort-derived reference value, calculated as the mean DAB OD from all normal mucosa annotations, was used. The procedure is visually summarized in Fig. 1A and B.

Digital image analysis of E-cadherin expression and tumor-stroma ratio (TSR). (A) Three representative tumor regions at the invasive front and one area of normal gastric mucosa were selected on whole-slide images. Inset boxes indicate the areas magnified in panel B. (B) High-magnification view showing cell detection and classification of tumor cells (red) and stromal cells (green) using a trained object classifier. (C) For TSR evaluation, three representative tumor areas at the invasive front were selected. Inset boxed indicate the areas magnified in panel D. (D) High-magnification view showing superpixel segmentation and classification of tumor (red) and stroma (green). Immune cells (purple) were also annotated to enhance analytical precision in this case.
TSR analysis
TSR was quantified through a sequential image analysis workflow. First, three representative tumor areas located at the deepest point of the tumor-invasive front, selected by a pathologist (B.K.). Regions were required to show abundant stromal components and well-preserved viable tumor cells, while areas with extensive necrosis, ulceration, or artifacts were excluded. Each selected region was reviewed on both H&E and vimentin-stained slides to confirm accurate tumor localization and to exclude necrotic or artifact-prone areas. For computational analysis, vimentin immunohistochemistry was used to distinguish stromal components from tumor epithelium, as vimentin is strongly expressed in fibroblasts and mesenchymal stromal cells. Digital image analysis was performed at 400× magnification, corresponding to the optical microscope view. In each region, superpixel segmentation was conducted using simple linear iterative clustering (SLIC) algorithm implemented in Qupath ver. 0.5.1. Following segmentation, superpixels were manually annotated as either tumor or stoma. An object classifier was trained using superpixel-level features such as intensity, texture, and shape to differentiate tumor from stroma. Depending on the case, additional components such as immune cells or adipocytes were included alongside tumor and stroma to improve classification performance. The trained classifier was then applied to all selected regions for automated classification. TSR was calculated as the ratio of the tumor area to the total area of encompassing both tumor and non-tumoral components. All classification results were visually reviewed to ensure consistency and accuracy. The procedure is visually summarized in Fig. 1C and D.
Statistical analysis
Categorical variables were compared using chi-square tests or Fisher’s exact tests, as appropriate. Continuous variables were analyzed using independent t-tests or Mann-Whitney U tests, depending on the distribution of the data. Recurrence-free survival (RFS) was analyzed according to the combined E-cadherin and TSR groups. The curves were compared using the log-rank test, with pairwise comparisons performed between groups. Cox regression analysis was conducted to compare prognostic models for predicting peritoneal recurrence. Multivariable Cox proportional hazards regression analysis was performed to identify clinicopathologic factors associated with peritoneal recurrence. All p-values were two-sided, and values less than .05 were considered statistically significant. Data processing and statistical analyses were performed using IBM SPSS Statistics for Windows ver. 28.0 (IBM Corp., Armonk, NY, USA) and R software ver. 4.2.2 (R Foundation for Statistical Computing, Vienna, Austria).
RESULTS
Patients characteristics
The clinicopathologic characteristics of the 130 patients included in the study are summarized in Table 1. The cohort comprised 81.5% males (n = 106) and 18.5% females (n = 24), with a mean age of 57.02 ± 11.48 years. The mean tumor size was 5.86 ± 3.02 cm. According to the Borrmann classification, type 3 was the most common gross type (83.1%, n = 108), and based on the Lauren classification, the diffuse type predominated (76.9%, n = 100). T category was classified as T3 in 38.5% (n = 50) and T4a in 61.5% (n = 80). Lymph node status was N0 in 27.1% (n = 35), N1 in 19.2% (n = 25), N2 in 22.5% (n = 29), and N3 in 31.5% (n = 41). Lymphovascular invasion and perineural invasion were present in 60.8% (n = 79) and 83.8% (n = 109) of cases, respectively. As for adjuvant chemotherapy, 66.2% (n = 86) received XELOX, 30.0% (n = 39) received TS-1, and 3.8% (n = 5) received other regimens. The mean follow-up duration was 53.59 ± 30.12 months, and peritoneal recurrence occurred after a mean interval of 50.90 ± 30.48 months.
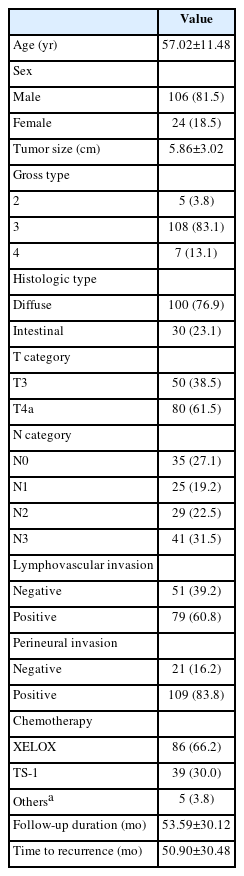
Baseline clinicopathologic characteristics of the study cohort
Association between E-cadherin expression and TSR with clinicopathologic factors
To evaluate the associations of E-cadherin expression and TSR with various clinicopathologic factors, receiver operating characteristic (ROC) curve analysis was used to determine the respective cut-off values of 0.315 for E-cadherin and 9.664 for TSR. For E-cadherin, low expression was statistically significantly associated with diffuse-type histology (90.3% vs. 72.7%, p = .042) and deeper tumor invasion (T4a: 77.4% vs. 56.6%, p = .037). There were no statistically significant differences in age, sex, tumor size, gross type, N category, lymphovascular invasion, perineural invasion, chemotherapy regimen, follow-up duration, or time to recurrence between the low and high expression groups. For TSR, low group was statistically significantly associated with younger age (53.61 vs. 61.0 years, p < .001) and female patients (27.1% vs. 8.3%, p = .006). Chemotherapy regimens also differed statistically significantly between the low and high TSR groups (p = .008). No statistically significant differences were observed between these two groups in tumor size, gross type, histologic type, T category, N category, lymphovascular invasion, perineural invasion, follow-up duration, or time to recurrence. The analysis of chemotherapy regimens was not intended to assess the predictive value of these biomarkers for treatment selection, but rather to evaluate whether treatment heterogeneity might confound the observed associations between each biomarker and peritoneal recurrence. Detailed results are presented in Tables 2 and 3.
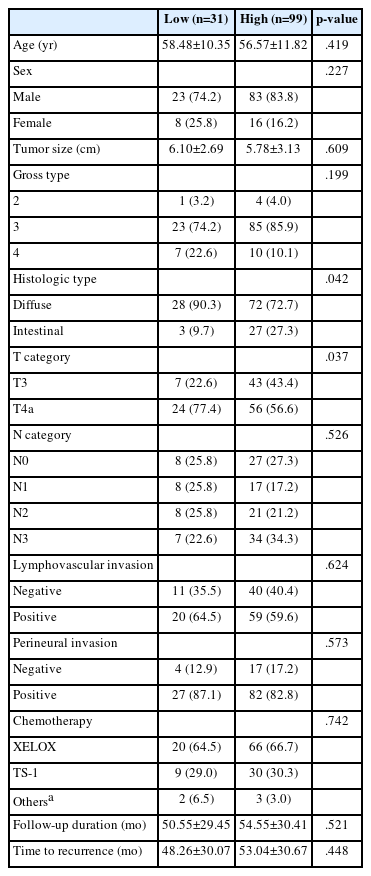
Clinicopathologic comparison based on E-cadherin expression
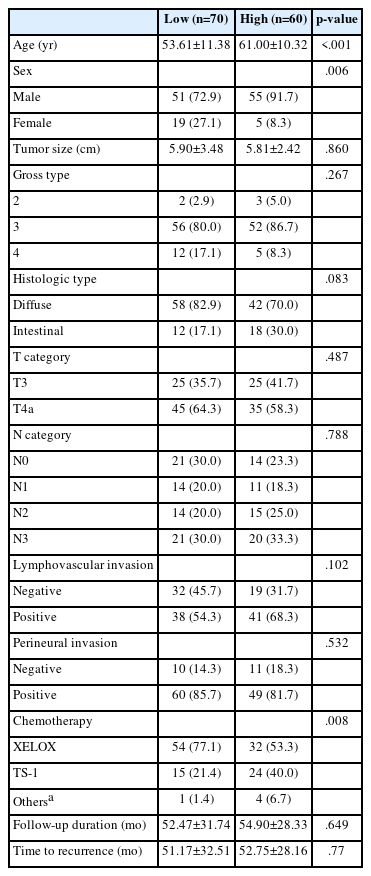
Clinicopathologic comparison based on tumor-stromal ratio
Correlation between TSR and E-cadherin expression
Correlation analysis revealed a weak positive relationship between TSR and E-cadherin expression when assessed using the mean ratio (r = 0.139, p = .114) (Fig. 2). Consistent with this, subgroup comparisons showed no significant difference in TSR values between low and high E-cadherin expression groups (p = .652; data not shown), nor in E-cadherin expression levels between low and high TSR groups (p = .242; data not shown).

Correlation between E-cadherin expression and tumor-stroma ratio (TSR). A scatter plot showing the correlation between E-cadherin expression, quantified as tumor-to-normal mean 3,3'-diaminobenzidine optical density ratios, and TSR.
Prognostic impact of E-cadherin expression and TSR on RFS
Kaplan–Meier curves were generated to evaluate the prognostic value of E-cadherin expression and TSR on RFS. Patients with low E-cadherin expression had significantly shorter RFS compared to those with high expression (log-rank p = .002) (Fig. 3). When stratified by histologic subtype, low E-cadherin expression was significantly associated with shorter RFS in both diffuse type (log-rank p = .029) and intestinal type (log-rank p = .008) (data not shown). In contrast, patients in the low TSR group demonstrated a trend toward shorter RFS, but the difference was not statistically significant (log-rank p = .054) (Fig. 3).

Kaplan-Meier curve for peritoneal recurrence stratified by E-cadherin and tumor-stroma ratio (TSR). Kaplan–Meier analysis showing recurrence-free survival based on E-cadherin expression (p = .002) (A) and TSR (p = .054) (B).
We analyzed RFS using Kaplan–Meier curves based on a combined stratification of E-cadherin expression and TSR. According to the cut-off values determined by ROC curve analysis, patients were classified into four groups: group 1 (low E-cadherin & low TSR), group 2 (low E-cadherin & high TSR), group 3 (high E-cadherin & low TSR), and group 4 (high E-cadherin & high TSR). There were statistically significant differences in RFS among the four groups (p = .005), and Group 4 exhibited the most favorable outcome (Fig. 4). Pairwise log-rank comparisons revealed statistically significant differences between group 1 and group 4 (p < .001), as well as between group 2 and group 4 (p = .011), and between group 3 and group 4 (p = .040). However, there were no statistically significant differences between group 1 and group 2, group 2 and group 3, or group 1 and group 3. Detailed results are presented in Table 4.

Kaplan-Meier curve of recurrence-free survival (A) according to combined E-cadherin and tumor-stroma ratio (TSR) classification. Combined classification into four groups shows significant differences in recurrence-free survival (p = .005). Representative hematoxylin and eosin–stained images (B) for each group are included to aid histopathologic correlation.
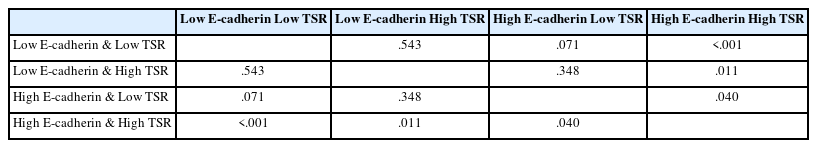
Pairwise log-rank test for recurrence-free survival according to combined E-cadherin and TSR groups
Multivariable analysis of clinicopathologic factors associated with peritoneal recurrence
To identify clinicopathologic variables independently associated with peritoneal recurrence in advanced gastric cancer, a multivariable Cox proportional hazards regression analysis was conducted (Table 5). Variables included in the model were age, sex, tumor size, gross type, histologic subtype, T category, N category, lymphovascular invasion, perineural invasion, TSR, E-cadherin expression, and adjuvant chemotherapy regimen. In univariate analysis, tumor size (hazard ratio [HR], 1.161; 95% confidence interval [CI], 1.043 to 1.291; p = .006), T category (T4a vs. T3; HR, 7.828; 95% CI, 1.826 to 33.549; p = .006), N category (N0 vs. N1 + N2 + N3; HR, 4.571; 95% CI, 1.077 to 19.396; p = .039), E-cadherin (high vs. low; HR, 0.293; 95% CI, 0.127 to 0.676; p = 0.004), and chemotherapy regimen (others vs. XELOX; HR, 4.467; 95% CI, 1.281 to 15.579; p = .019) were statistically significantly associated with increased risk of peritoneal recurrence. However, in the multivariable model, only E-cadherin expression remained statistically significant (high vs. low; HR, 0.348; 95% CI, 0.149 to 0.816; p =.015), indicating that high E-cadherin expression was associated with a statistically significantly lower risk of peritoneal recurrence compared to low expression. Although T category did not reach statistical significance in the multivariable model (p = .052), its p-value was close to the threshold, suggesting a potential prognostic relevance that warrants further investigation.
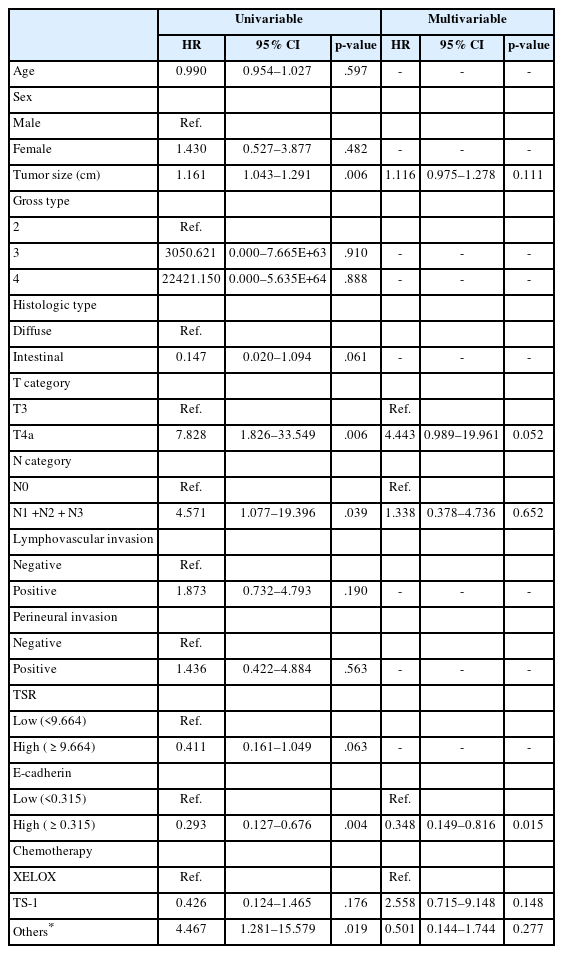
Multivariable analysis of clinicopathologic factors associated with peritoneal recurrence
Predictive value of the combined biomarker model
To identify a better predictive model for peritoneal recurrence, we compared the prognostic performance of two models: model 1, based on E-cadherin expression alone, and model 2, which incorporated both E-cadherin and TSR. The concordance index of model 1 was 0.622, with a likelihood ratio test value of 7.852 (p = .005). In model 2, the concordance index increased to 0.693, and the likelihood ratio test value was 11.318 (p = .004), indicating improved predictive performance with the addition of TSR. Detailed results are in Table 6.
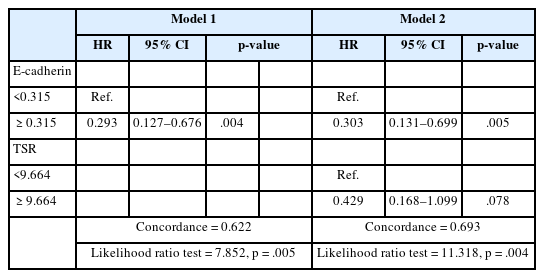
Comparison of prognostic models for peritoneal recurrence based on E-cadherin and tumor-stromal ratio
DISCUSSION
This study aimed to evaluate the prognostic significance of E-cadherin expression and TSR for peritoneal recurrence in patients with advanced gastric cancer. Low E-cadherin expression was significantly associated with shorter RFS (p = .002), while low TSR also showed a trend toward shorter RFS (p = .054). When E-cadherin and TSR were combined to stratify patients into four groups, significant differences in RFS were observed among the groups (p = .005). Furthermore, predictive models for peritoneal recurrence demonstrated improved performance when TSR was incorporated into the E-cadherin–based model, compared to the model using E-cadherin alone. This study provides a novel approach by demonstrating, for the first time to our knowledge, that the combined digital evaluation of E-cadherin and TSR is a powerful predictor of peritoneal recurrence in gastric cancer. Moreover, the use of digital image analysis adds analytical precision and objectivity to the results.
Numerous studies have investigated the relationship between E-cadherin expression and clinicopathologic factors as well as prognosis in gastric cancer, and several meta-analyses have been conducted based on these findings [17,21,22]. A common conclusion across these meta-analyses is that reduced E-cadherin expression is significantly associated with diffuse-type histology, greater invasion depth, lymphovascular invasion, lymph node metastasis, distant metastasis, advanced TNM stage, and poor overall survival [17,21,22]. In our study, reduced E-cadherin expression was significantly associated with aggressive tumor features such as diffuse-type histology and deeper tumor invasion, consistent with previous reports suggesting its role as a biomarker of tumor aggressiveness [6,7,11-13,16]. However, we did not observe a statistically significant association with lymphovascular invasion or lymph node metastasis. This discrepancy may be attributed to the relatively small sample size and the single-institutional nature of our study. Moreover, as highlighted in previous meta-analyses, considerable inter-study heterogeneity exists, underscoring the need for cautious interpretation of these findings [17,21,22].
In our study, TSR showed a statistically significant association with patient age, sex, and chemotherapy regimen, but not with key clinicopathological factors, such as lymph node metastasis, lymphovascular invasion, perineural invasion or T category. Although not as extensively studied as E-cadherin, several studies have investigated the association between the TSR and clinicopathologic factors. One study reported that stroma-rich tumors were significantly associated with a greater number of metastatic lymph nodes, deeper invasion, higher TNM stage, perineural invasion, and lymphovascular invasion [2]. Another study found significant associations between stroma-rich tumors and tumor size ≥ 3 cm, higher T category, and higher N category [9]. These findings differ from the results of the present study, which may be attributed to differences in the methods used to measure TSR. Most previous studies used a fixed 50% cutoff to categorize TSR [2,8,9,23-25], whereas in the present study, TSR was quantified through digital image analysis, and the cutoff value was determined using ROC curve analysis to stratify tumors into low and high TSR groups. Furthermore, since the number of studies evaluating TSR in gastric cancer remains limited, additional data will be necessary to draw more definitive conclusions.
When patients were stratified into low and high E-cadherin expression groups and Kaplan–Meier curves were plotted according to peritoneal recurrence, those with low E-cadherin expression showed significantly shorter RFS (p = .002). In multivariate analysis, E-cadherin expression was also identified as an independent prognostic factor for peritoneal recurrence (high vs. low; HR, 0.348; 95% CI, 0.149 to 0.816; p = .015). These findings are consistent with previous studies reporting an association between reduced E-cadherin expression and peritoneal recurrence [11-16,21,22]. Furthermore, when stratified by histologic subtype, low E-cadherin expression remained significantly associated with shorter RFS in both diffuse type (p = .029) and intestinal type (p = .008). These findings suggest that the prognostic impact of E-cadherin expression is preserved across different histologic subtypes. However, given the relatively small number of intestinal type cases in our cohort, this association should be interpreted with caution and validated in larger datasets.
Although patients with low TSR showed a trend toward shorter RFS, the difference did not reach statistical significance (p = .054). A few studies have investigated the relationship between the TSR and peritoneal recurrence. In one study, multivariate analysis revealed that stroma-rich tumors had a significantly higher risk of developing peritoneal recurrence compared to stroma-poor tumors [8]. The authors proposed a predictive model incorporating TSR along with CA125, CA724, and Borrmann type, which demonstrated strong predictive value for peritoneal recurrence [8]. In another study, while stroma-rich tumors were significantly associated with peritoneal recurrence in univariate analysis, the association did not remain statistically significant in multivariate analysis [26]. However, the authors suggested that combining TSR with DNA ploidy and nucleotyping indices could enhance the predictive accuracy for peritoneal recurrence [26].
Correlation analysis between TSR and E-cadherin expression revealed a very weak, statistically non-significant association (r = 0.139, p = .114). E-cadherin is a transmembrane glycoprotein involved in calcium-dependent cell-cell adhesion, predominantly expressed in epithelial tissues [24]. Reduced expression weakens intercellular adhesion, facilitating tumor cell detachment, invasion, and metastasis [13,15,21], and is often regarded as a hallmark of EMT, a key mechanism in tumor progression and peritoneal dissemination [27]. In contrast, TSR represents the relative proportion of tumor cells to stromal components within the tumor [2], reflecting the composition of cancer-associated fibroblasts, immune cells, and extracellular matrix, which may influence tumor progression and therapeutic resistance [9,24,28]. A low TSR often indicates a desmoplastic, immunosuppressive microenvironment, which not only promotes EMT-related signaling via inflammatory and paracrine factors but also contributes to tumor progression through mechanical stress imposed by extracellular matrix stiffening [29,30]. These extracellular biomechanical cues can facilitate EMT and enhance malignant transformation [30]. These findings suggest that each marker reflect distinct but complementary biological characteristics: E-cadherin captures intrinsic cellular features and EMT status, while TSR reflects the structural and immunologic features of the tumor microenvironment that modulate EMT and tumor behavior. Thus, combined evaluation of E-cadherin and TSR may provide a more comprehensive assessment of tumor aggressiveness and peritoneal recurrence risk than either marker alone.
Supporting this perspective, the combined analysis of E-cadherin expression and TSR demonstrated improved predictive performance for peritoneal recurrence. Patients in group 4, with high levels of both markers, showed the most favorable outcomes, whereas group 1 and 2 showed the poorest prognoses with overlapping survival curves and no statistically significant difference between them (p = 0.543). Group 3 appeared to show intermediate outcomes on visual inspection of the survival curves; however, no statistically significant differences were observed between group 3 and either group 1 or group 2 (p = .071 and p = .348, respectively). Notably, in the subgroup with high E-cadherin expression, TSR significantly stratified prognosis (p = .040), and among patients with high TSR, E-cadherin expression also showed significant prognostic discrimination (p = .011). Although TSR did not emerge as an independent predictor in multivariable analysis, its integration with E-cadherin improved the model’s predictive accuracy, highlighting the complementary prognostic value of the two markers in predicting peritoneal recurrence. These findings suggest that TSR may refine prognostic stratification particularly in tumors with preserved epithelial features, and that potential interactions between the two markers warrant further investigation in larger, multi-center studies.
From a therapeutic standpoint, the combined evaluation of E-cadherin expression and TSR may offer clinical utility in stratifying patients by risk of peritoneal recurrence and guiding postoperative treatment decisions. Patients in group 4, characterized by high E-cadherin expression and high TSR, demonstrated the most favorable RFS, identifying this subset as a potential low-risk group. In contrast, patients outside this favorable group—particularly those lacking one or both favorable features—may benefit from more intensive surveillance or consideration of alternative adjuvant strategies, such as intraperitoneal chemotherapy. This stratification approach could support more personalized, risk-adapted treatment planning in patients with advanced gastric cancer.
This study has several limitations. As a retrospective, single-center analysis with a relatively small sample size, its statistical power and generalizability may be limited. In addition, no external validation study was performed. Furthermore, digital image analysis was limited to three representative regions at the tumor invasive front rather than the entire tumor section. This decision was based on both biological rationale and technical feasibility: the invasive front is known to be the most active area for tumor–stroma interaction and EMT, and whole-slide analysis posed practical challenges due to variations in tissue quality and the complexity of high-resolution immunohistochemistry image processing. However, this region-restricted approach may not fully capture the extent of intratumoral heterogeneity. Future prospective studies incorporating whole-slide analysis may provide more comprehensive insights. Despite these limitations, to the best of our knowledge, this is the first study to evaluate the combined prognostic utility of the two markers, and the use of digital image analysis enhanced the objectivity and reproducibility of E-cadherin and TSR quantification.
In conclusion, our findings suggest that E-cadherin expression and TSR are complementary biomarkers that, when evaluated together, offer superior prognostic value for recurrence in patients with advanced gastric cancer. This dual-marker approach captures both tumor cell–intrinsic characteristics and tumor microenvironmental features, allowing for more refined risk stratification. Future directions should include validation of these findings in large, multi-center cohorts, as well as prospective studies to assess the predictive performance of E-cadherin and TSR in real-world clinical settings. Ultimately, incorporating these markers into routine pathology workflows may facilitate more personalized surveillance and treatment strategies for gastric cancer patients at risk of peritoneal recurrence.
Notes
Ethics Statement
This study was approved by the Ulsan University Hospital Institutional Review Board (R-BAY File No. 2024-12-037). Formal written informed consent was not required with a waiver by the appropriate Institutional Review Board.
Availability of Data and Material
The datasets generated or analyzed during the study are available from the corresponding author on reasonable request.
Code Availability
Not applicable.
Author Contributions
Conceptualization: Kim B. Data curation: Lee S, Kim B. Investigation: Lee S, Kim B. Methodology: Kim B. Supervision: Kim B. Validation: Kim B. Writing—original draft: Lee S. Writing—review & editing: Kim B. Approval of final manuscript: all authors.
Conflicts of Interest
The authors declare that they have no potential conflicts of interest.
Funding Statement
No funding to declare.
Acknowledgments
We would like to express our sincere gratitude to Professor Seoung Wan Chae at Samsung Kangbuk Hospital for his invaluable support and guidance in the digital image analysis conducted in this study.