Clinicopathological implications of miR-3127 in melanoma
Article information

Abstract
Background
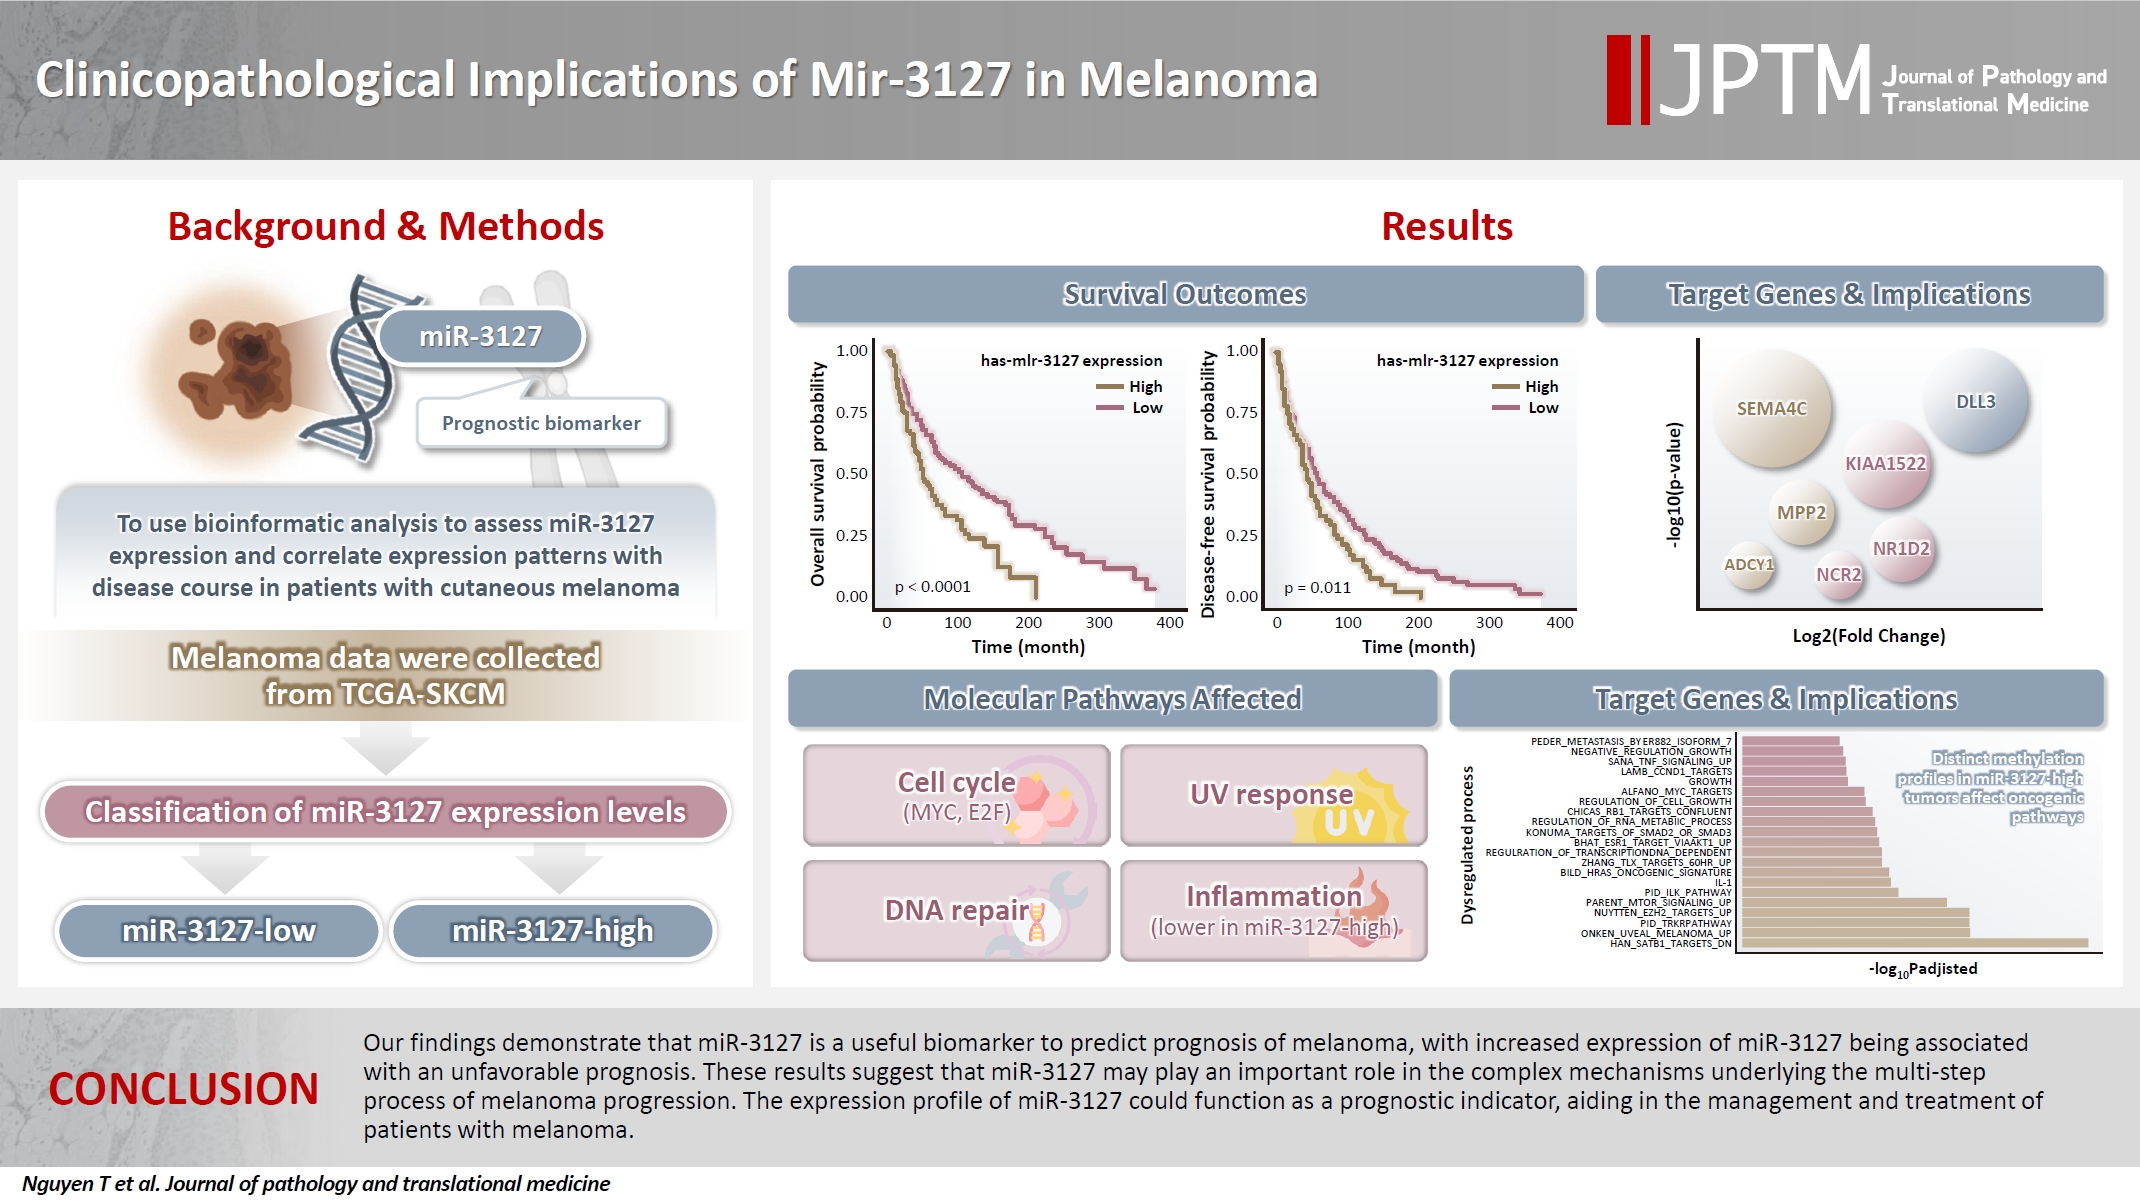
Cutaneous melanoma is the most lethal of all skin cancers. Recent studies suggested that miR-3127 is dysregulated in multiple tumor types and has important roles in tumorigenesis and cancer progression, giving it potential as a prognostic biomarker. The aim of this study was to use bioinformatic analysis to assess miR-3127 expression and correlate expression patterns with disease course in patients with cutaneous melanoma.
Methods
miRNA, mRNA sequencing, DNA methylation data, and clinical information of cutaneous melanoma cases were downloaded from the Human Cancer Atlas – Skin Cutaneous Melanoma (TCGA-SKCM). miR-3127 expression was classified into miR-3127–low and miR-3127–high clusters using maximally selected rank statistics.
Results
Clustering analysis showed that high expression of miR-3127 (≥20.3 reads per million) was associated with worse progression-free (p < .001) and overall (p = .011) survival compared to low miR-3127 expression. More than five thousand differentially expressed genes between the two miR-3127 sample groups encoded cell differentiation markers, cytokines, growth factors, translocated cancer genes, and oncogenes. Pathway analysis revealed that miR-3127–high samples related to activity of proliferation, DNA repair, and ultraviolet response.
Conclusions
The expression level of miR-3127 could act as a prognostic indicator for patients with melanoma.
INTRODUCTION
Cutaneous melanoma, which frequently develops from the epidermal-dermal junction where melanocytes undergo malignant transformation, is known for its rapid progression, high invasiveness, metastatic potential, and limited responsiveness to treatment [1]. There were an estimated 324,000 new cases and approximately 57,000 deaths worldwide in 2020 of this primary skin cancer [2]. Surgical removal of the primary melanoma typically yields favorable outcomes, resulting in a relatively high survival rate. However, the 3-year survival rate drops to only 5%–32% when melanoma spreads to lymph nodes or distant sites [3]. Therefore, it is crucial to identify effective biomarkers for melanoma to improve prognostic accuracy and guide targeted treatments.
MicroRNAs (miRNAs) are a class of small non-coding RNAs that regulate gene expression post-transcription by binding to the 3′-untranslated regions (UTRs) of target mRNAs. miRNAs are crucial in the regulation of tumor growth and metastasis [4]. Recent studies suggested that miR-3127 functions in a variety of malignancies as either a tumor suppressor or an oncogene [5]. For instance, there is evidence to suggest that downregulation of miR-3127-5p could facilitate the transition from epithelial to mesenchymal by activating the WNT/FZD4/β-catenin signaling pathway, thereby promoting tumor progression and metastasis [6]. Furthermore, miR-3127 represses the growth and invasion of bladder cancer cells by directly targeting the 3′-UTR of RAP2A, whereas in hepatocellular carcinoma (HCC), it stimulates proliferation and tumorigenesis via the AKT/FOXO1 signaling pathway [5-7]. At present, the precise function of miR-3127 in melanoma and its role in disease progression are not well understood.
In this study, we aimed to investigate the association between expression levels of miR-3127, clinicopathological characteristics, and overall survival (OS) in cases of melanoma. We also worked on establishing miR-3127 as a prognostic biomarker to help guide the management and treatment of patients with melanoma.
MATERIALS AND METHODS
Data preprocessing
We accessed The Human Cancer Atlas – Skin Cutaneous Melanoma (TCGA-SKCM) (https://portal.gdc.cancer.gov/projects/TCGA-SKCM) and retrieved data regarding miRNA expression (n = 450 samples), mRNA expression (n = 472 samples), and DNA methylation (n = 472 samples) of melanoma patients. We first filtered out normal samples and included primary (n=237) and metastatic (n=209) tumor samples. We categorized samples from stages I and II, as well as tumors from stages III and IV with code "01," as primary samples. Meanwhile, samples from stages III and IV with code "06" were classified as metastatic samples. Metastatic melanomas included tumors from regional sites (such as regional lymph nodes and regional skin/soft tissue) as well as distant sites. We then eliminated duplicated samples (same sample type in a patient). Finally, the numbers of samples available for miRNA, mRNA, and DNA methylation were 446, 468, and 467, respectively. Included clinical characteristics were age, sex, race, Breslow’s depth, TNM stages, radiation, chemotherapy, OS, and disease-free survival (DFS).
Clustering of miR-3127 expression
Maximally selected rank statistics (MSRS) is a method that selects the cut-off point, whose rank metric is maximum [8]. Since our purpose was to investigate the clinicopathological significance of miR-3127, we employed standardized log-rank statistics as the ranking metric. This metric usually evaluates the association between genes and/or miRNAs and survival outcomes [9]. We used the expression of miR-3127 and OS to compute the rank metric. We then divided the studied samples into tumors with low (miR-3127–low) and high (miR-3127–high) expressions of miR-3127.
mRNA and miRNA expression analyses
We employed the DESeq2 pipeline to perform differential expression analysis (DEA) [10]. DEA was conducted to compare each miRNA and mRNA expression between miR-3127–high and miR-3127–low samples. In pathway analysis, we used the gene set enrichment analysis (GSEA) method to examine the difference in the pathway activity between these two sample groups [11]. The Benjamini-Hochberg multiple corrections were applied to reduce false-positive results.
DNA methylation analysis
We followed the ChAMP pipeline to perform differential methylation position (DMP), differential methylation region (DMR), and methylation GSEA [12]. We focused on the difference in methylation statuses between miR-3127–low and miR-3127–high tumors.
Analysis platform
We used R software programming language ver. 4.2.2 (R Foundation for Statistical Computing, Vienna, Austria) for all the analyses. For clinicopathological analyses, we performed Wilcoxon and chi-squared tests for continuous and categorical variables, respectively. For survival analyses, Kaplan-Meier, univariate, and multivariate Cox analyses were conducted. All the hypothesis tests were considered significant when p < .05 or adjusted p < .5.
RESULTS
Clustering analysis showed high expression of miR-3127 conferred worse outcomes
Using MSRS, the optimal miR-3127 expression threshold was 20.3 read per million (RPM) (Fig. 1A, D). Therefore, samples were classified as miR-3127–low (n = 317) and miR-3127–high (n = 129) based on miR-3127 expression of <20.3 and ≥20.3 RPM, respectively. Table 1 presented a summary of the study cohort's characteristics, divided into miR-3127–high and miR-3127–low groups. Among the samples, 48.8% of metastatic and 51.2% of non-metastatic patients exhibited high miR-3127 expression, with no statistically significant difference observed. This indicates that miR-3127 expression was not associated with metastatic status.

miR-3127 expression and its association with melanoma patient outcomes. (A) Maximally selected rank statistics method using standardized log-rank statistic as the metric. (B) Kaplan-Meier curves showing the overall survival between miR-3127–low and miR-3127–high melanoma patients. (C) Kaplan-Meier curves showing the disease-free survival between miR-3127–low and miR-3127–high melanoma patients. (D) Histogram showing the distribution of miR-3127 read counts. (E) Uniform manifold approximation and projection dimension reduction plot illustrating the miRNA space color-coded by miR-3127 expression status. (F) Volcano plot demonstrating the results of DESeq2 analysis in miRNA expression. The top 5 most significant genes are labeled.
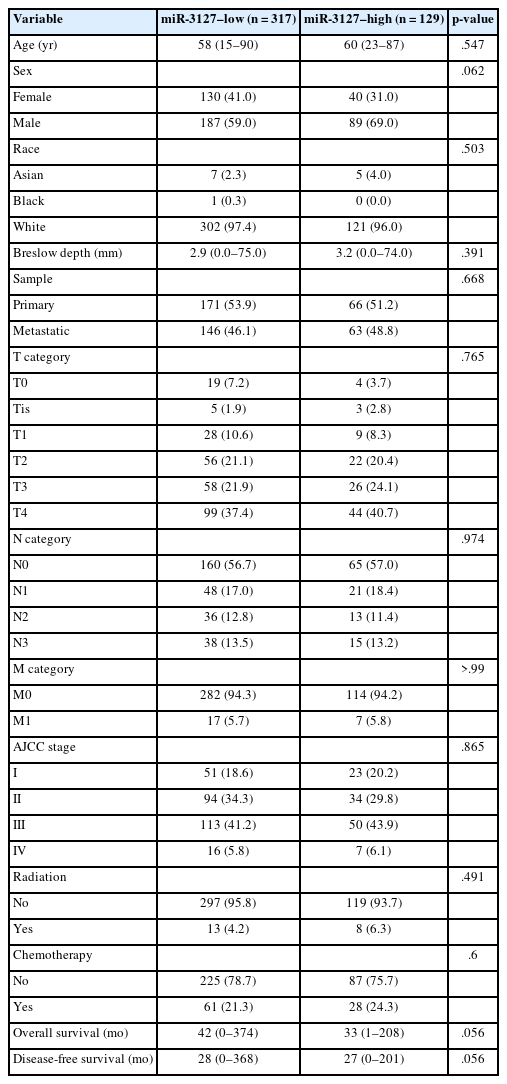
Clinicopathological characteristics of miR-3127–low and miR-3127–high melanoma patients
Overall, patients with miR-3127–high samples showed significantly poorer DFS (p < .001) and OS (p = .011) (Table 2, Fig. 1B, C). When stratified into primary and metastatic groups, those with miR-3127–high metastatic melanoma exhibited the poorest prognosis. Notably, patients with miR-3127–high non-metastatic melanoma had both worse OS and DFS compared to those with miR-3127–low metastatic melanoma (Supplementary Fig. S1).
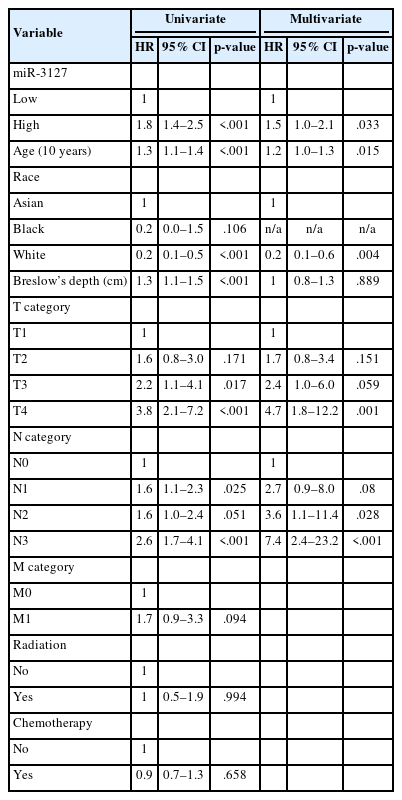
Univariate and multivariate Cox analyses of overall survival in the studied cohort
Fig. 1E illustrated the even distributions of miR-3127–low and miR-3127–high in miRNA “space,” suggesting limited relationships between miR-3127 and other miRNAs. DEA of miRNA expression found that 165 (8.8%) and 150 (8.0%) miRNAs of 1,881 miRNA probes were respectively upregulated and downregulated in miR-3127–high samples (Supplementary Table S1). DEA revealed that the top 5 differentially expressed miRNAs (excluding miR-3127) were miR-1301, miR-3691, miR-6509, miR-3150b, and miR-3680-1 (Fig. 1F).
Large portions of genes in cell differentiation markers, cytokines, growth factors, translocated cancer genes, and oncogenes are differentially expressed by miR-3127 groups
The DEA of mRNA expression indicated 5,484 differentially expressed genes (DEGs), accounting for 9.1% of genes analyzed (Supplementary Table S2). Fig. 2A shows the dimension reduction of only DEGs, where miR-3127–high samples are more densely distributed in the lower area of the graph. To investigate the expression pattern of miR-3127 targets, we first collected the target genes of miR-3127 by accessing collection “C3” of the MSigDB database and retrieving genes in MIR3127-3P and MIR3127-5P (Supplementary Table S3). We then examined the DEGs within these genes (Fig. 2B). Among the predicted target genes, the expressions of PAFAH1B2, FAM172A, GOLM2, NKAPD1, and DDX6 were lower in miR-3127–high samples while SEMA4C, KIAA1522, DLL3, SEMA4F, and MPP2 were highly expressed by miR-3127–high tumors. In the analysis of the overall mRNA dataset, the top 10 most significant DEGs (Fig. 2C) included two downregulated genes (IGFBP3 and KIAA0040) and eight upregulated genes (RTN4R, PAK4, SNTA1, CNNM3, NAXE, SMYD5, PPARD, and EPHX1).

Gene expression and pathway analysis by miR-3127 groups. (A) Uniform manifold approximation and projection dimension reduction plot showing mRNA space color-coded by miR-3127 expression status. (B) Volcano plot displaying DESeq2 results for mRNA expression limited to miR-3127 target genes. (C) Volcano plot displaying DESeq2 results for overall mRNA expression considering the 50 most significant genes out of 60,660 genes, with the top 10 most significant genes labeled. (D) Bar plot illustrating the proportion of differentially expressed genes (DEGs) across functional families, including cell differentiation markers (CDM), cytokines and growth factors (CGF), homeodomain proteins (HP), oncogenes (O), protein kinases (PK), translocated cancer genes (TCG), transcription factors (TF), and tumor suppressors (TS). (E) Correlogram presenting normalized enrichment scores in descending order from left to right.
We then asked which gene functions were largely different between the two miR-3127 sample groups. We collected the genes belonging to eight important function families, including cell differentiation markers (CDM), cytokine and growth factor (CGF), homeodomain proteins (HP), oncogenes (O), protein kinase (PK), translocated cancer gene (TCG), transcription factor (TF), and tumor suppressor (TS). The detail information can be found in the website of the MSigDB databse (https://www.gsea-msigdb.org/gsea/msigdb/human/gene_families.jsp). We used genes that only belong to CDM (n = 367), CGF (n = 452), HP (n = 291), O (n = 328), PK (n = 513), TCG (n = 290), TF (n = 1536), and TS (n = 82). Genes with mutual functions were excluded. Fig. 2D shows the number of genes in each function family, color-coded by DEGs. We found that large proportions of CDM (48.3%), CGF (47.1%), TCG (42.1%), and oncogenes (41.8%) were DEGs.
Pathway analysis revealed that miR-3127–high samples related to activity of proliferation, DNA repair, and ultraviolet response and lower inflammation-related processes
We employed collection H (hallmark gene sets) of the MSigDB database, including 50 hallmark pathways. Next, we performed the classic GSEA to compare the pathway activity between miR-3127–low and miR-3127–high samples (Fig. 2E). The full results are shown in Supplementary Table S4. Overall, there were 15 upregulated and 16 downregulated pathways while 19 pathways showed no significant difference. We found that cell cycle-related (MYC targets, E2F targets, and G2M checkpoint), DNA repair, upregulated genes of ultraviolet (UV) response, and metabolism-related (glycolysis and reactive oxygen species) pathways were enriched in miR-3127–high melanomas. On the other hand, miR-3127–low samples showed the enrichment of inflammation-related (interferon-γ and α response, and inflammatory responses) processes.
Methylation analysis
Investigation of the 1,000 most variable methylation positions (Fig. 3A, left) showed no clear difference in the distribution between miR-3127–low and miR-3127–high samples. Fig. 3A illustrates the proportion of hypomethylated and hypermethylated CpG probes (in miR-3127–high samples) by CpG island (Fig. 3A, middle) and features (Fig. 3A, right). In DMP, there were 57 hypomethylated, 10 hypermethylated, and three mixed CpG positions that exhibited both hypermethylation and hypomethylation in miR-3127–high melanomas (Fig. 3B) while six and two DNA regions of these tumors were hypermethylated and hypomethylated, respectively, in DMR (Fig. 3C) when compare to miR-3127–low melanomas. In summary, ABCC2, ABLIM1, CXXC5, GAS7, HLA-DMA, IFITIM1, LOC400794, PRKD2, S100A4, SPTBN1, and TAPBP were found to be hypermethylated in miR-3127–high melanomas compared to miR-3127–low melanomas. In methylation GSEA, there were a total of 122 biological processes that were significantly altered. Epigenetic dysregulation took place in several cancer-related processes, including SATB1 targets (adjusted p < .001), uveal melanoma signal (adjusted p < .001), tropomyosin receptor kinase receptor (TRKR) pathway (adjusted p < .001), EZH2 targets (adjusted p < .001), and mammalian target of rapamycin (mTOR) pathway (adjusted p < .001) (Fig. 3D). The full result is shown in Supplementary Table S5.
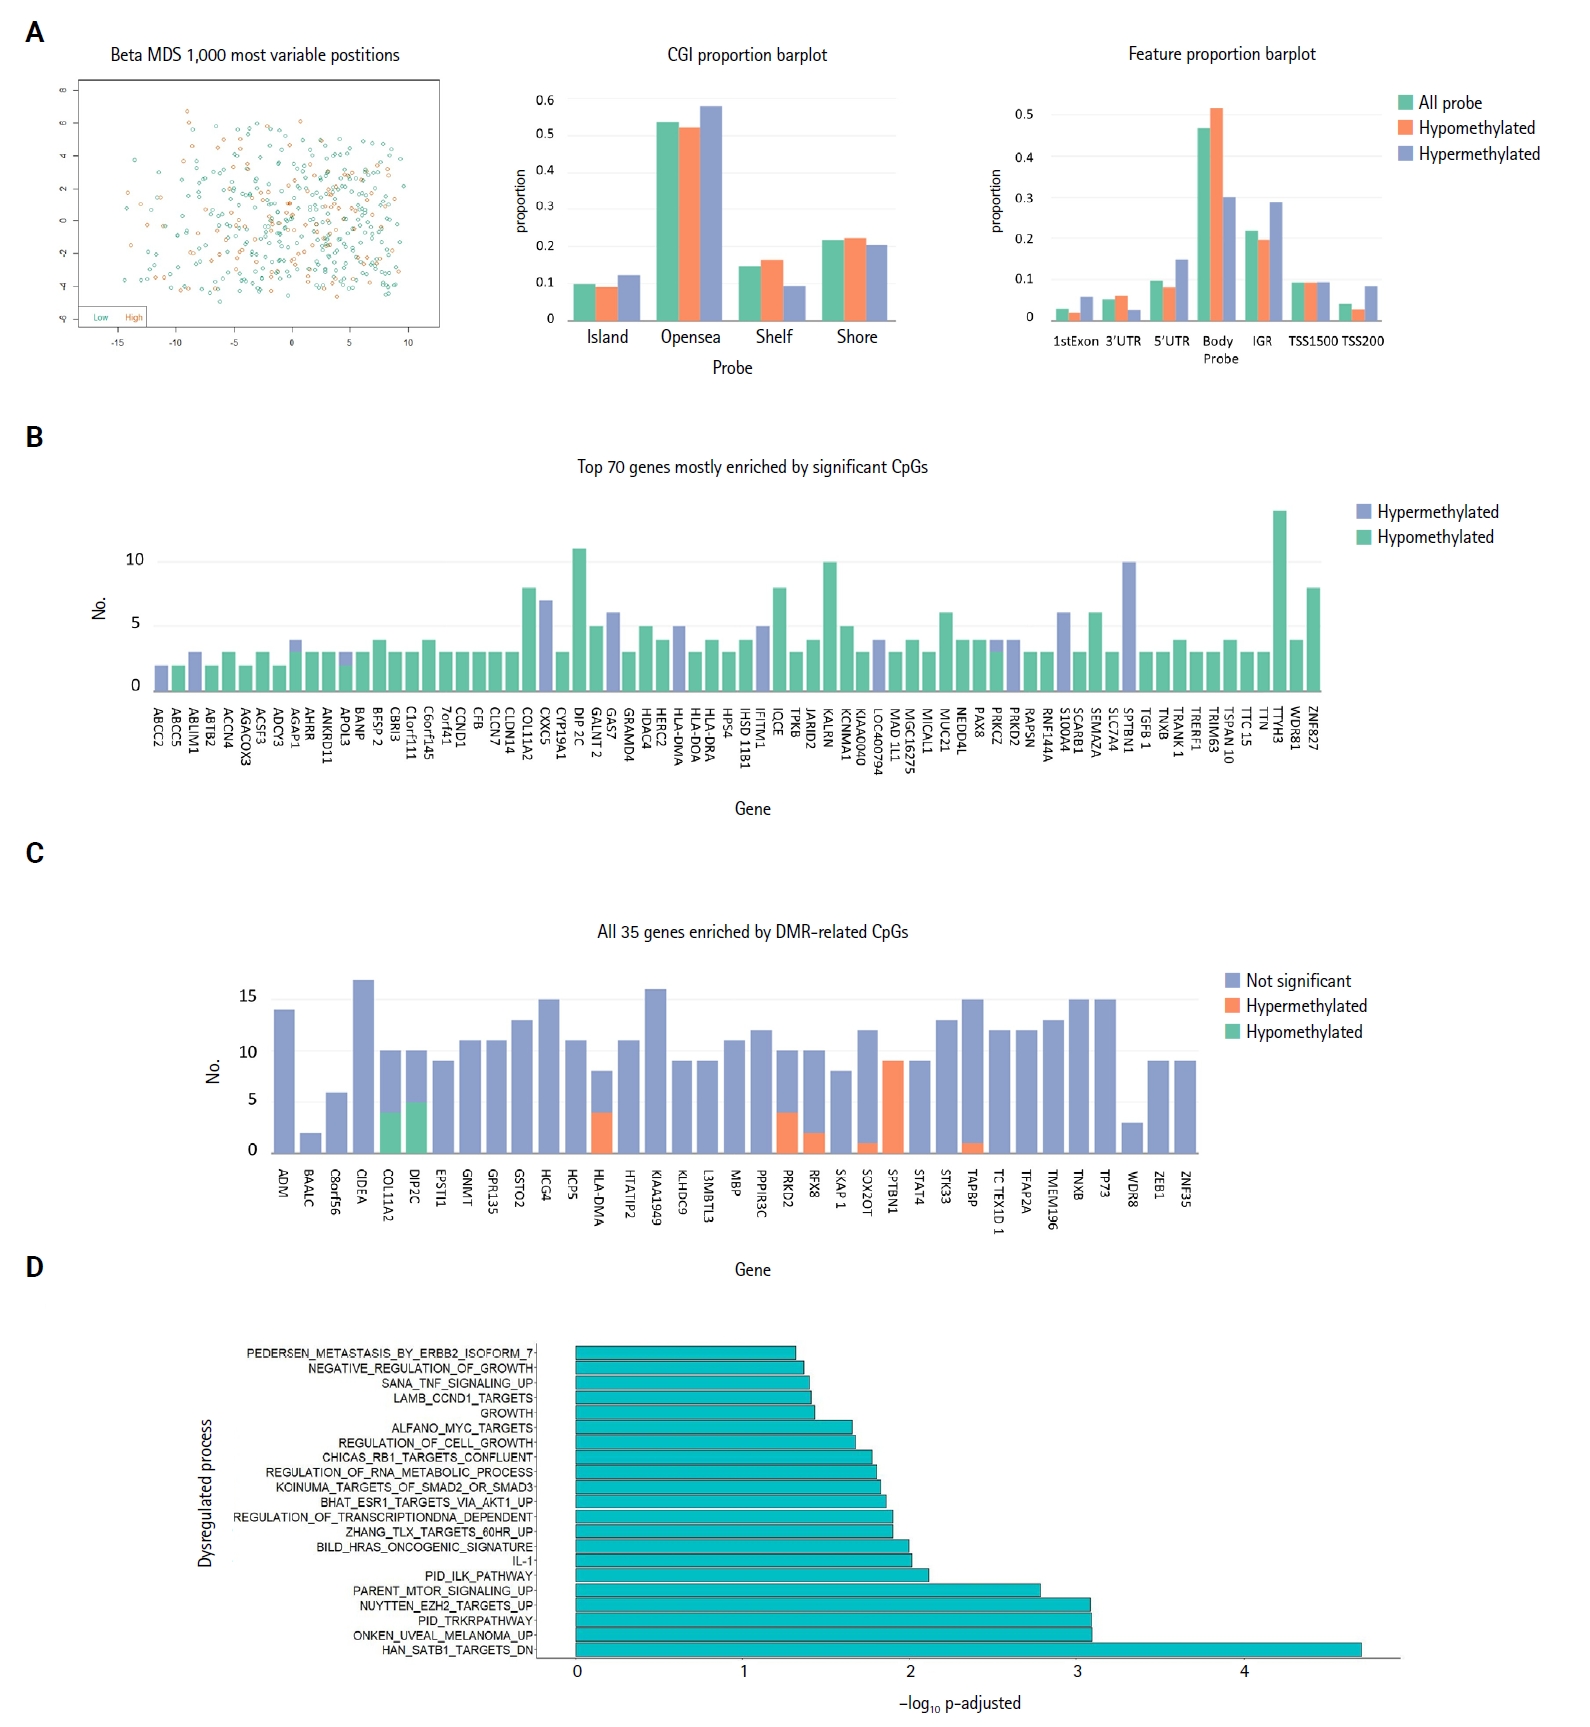
Methylation analysis in relation to miR-3127 expression. (A) Multidimensional scaling (MDS) plot of methylation patterns in miR-3127–low and miR-3127–high samples (left). Bar plots summarizing hypomethylated and hypermethylated probes in miR-3127–high samples by CpG island category (middle) and feature type (right). (B) Bar plot showing the top 70 significant genes based on differentially methylated probes in miR-3127–high versus miR-3127–low melanomas. (C) Bar plot showing the top 35 significant genes based on differentially methylated regions (DMRs) in miR-3127–high versus miR-3127–low melanomas. (D) Horizontal bar plot summarizing methylation gene set enrichment analysis results.
DISCUSSION
Melanoma, the most prevalent malignant skin cancer, is marked by rising incidence, mortality rates, and significant disease burden [1,2]. Despite advancements in diagnosis and treatment, the three-year survival rate is still poor, particularly for metastatic melanoma [3]. The identification of appropriate biomarkers is needed to enhance prognostication and overall outcomes for patients with melanoma.
Accumulating evidence suggests that miRNAs play crucial roles in various stages of cancer development, including melanoma [4,13]. Some studies have highlighted miRNAs as potential biomarkers for cancer diagnosis, targeted therapy, and prognosis [14,15]. Whether miR-3127 functions as an oncogene or TS depends on its target genes. For instance, miR-3127-5p has been shown to be a TS in non–small-cell lung cancer (NSCLC), wherein a decrease in miR-3127-5p levels encourages epithelial-mesenchymal transition by activating the WNT/FZD4/β-catenin signaling pathway, thereby promoting tumor progression and metastasis. [6]. Another study revealed that miR-3127 suppresses NSCLC cell proliferation and invasion by regulating the oncogene ABL1, leading to the inhibition of the RAS/ERK pathway [16]. Interestingly, in HCC, miR-3127 acts as an oncogene by activating AKT/FOXO1 signaling through direct targeting of the 3'-UTR of PHLPP1/2 [7]. However, the mechanisms and target genes of miR-3127 in melanoma remain unclear. To our knowledge, this study is the first to explore the expression patterns of miR-3127 and its association with patient survival in a melanoma patient cohort.
In this study, we investigated the expression of miR-3127 in melanoma samples by utilizing The Cancer Genome Atlas (TCGA) miRNAs, mRNA-sequencing, and DNA methylation data for subsequent analysis. Our findings revealed that patients with elevated miR-3127 levels (≥20.3 RPM) exhibited significantly poorer PFS and OS compared to those with lower miR-3127 levels. miR-3127 expression was found to be independent of metastatic status. In metastatic melanoma, elevated miR-3127 levels were linked to the worst clinical outcomes. Interestingly, non-metastatic patients with high miR-3127 expression demonstrated even lower OS and DFS than those with low miR-3127 expression in metastatic cases. These findings indicate that elevated miR-3127 expression may be a useful prognostic marker in melanoma, both in early-stage disease and in metastatic settings.
Moreover, we uncovered evidence implicating miR-3127 in several biological pathways pertinent to the pathogenesis of melanoma. In miR-3127–high melanoma, five other upregulated miRNAs were identified: miR-1301, miR-3691, miR-6509, miR-3150b, and miR-3680-1. Most of these miRNAs have established roles in tumor cell proliferation, invasion, or metastasis. miR-1301 is a recently discovered miRNA that exhibits abnormal expression across various tumors types, and dysregulated expression of miR-1301 is often linked to a poor prognosis. Studies have shown its involvement in promoting invasion, migration, and epithelial-mesenchymal transition progression by downregulating NBL1 expression in esophageal cancer and facilitating cell proliferation via targeting SIRT1 in gastric cancer [17-19]. Similarly, miR-3691-5p promotes HCC cell migration and invasion by activating phosphoinositide 3-kinase (PI3K)/Akt signaling through targeting PTEN [20]. miR-6509 has been associated with the progression of HCC in SNHG6/miR-6509-5p/HIF1A axis function and gastric cancer by binding to the long non-coding RNA HOXA10-AS to upregulate Y-box binding protein 1 [21,22]. Meanwhile, miR-3150b-3p is thought to act as a TS in colorectal cancer and HCC by inhibiting cancer cell proliferation, migration, and invasion through targeting GOLPH3 via the GOLPH3-mediated JAK2/STAT3 pathway [23,24]. Prior research on miR-3680-1 is limited. Although there are no prior studies investigating the association between these miRNAs and melanoma, their active expression in other cancer types suggests that they may be worth exploring as new therapeutic targets.
To further elucidate the active mechanisms of miR-3127, we conducted target gene predictions and observed elevated expression of SEMA4C, KIAA1522, DLL3, SEMA4F, and MPP2 in miR-3127–high tumors. SEMA4C was an important regulator of axonal guidance linked to tumor development. High SEMA4C expression is associated with the promotion of epithelial-mesenchymal transition and predicts a poor prognosis in colorectal carcinoma [25]. KIAA1522 is involved in oncogenic KRAS pathways, and its high expression serves as an independent biomarker predicting unfavorable survival and platinum resistance in NSCLC patients [26]. KIAA1522 also promotes the in vitro proliferation, invasion, and migration of tumor cells, as well as distant metastasis of colorectal cancer in vivo. Additionally, KIAA1522 upregulates the Notch signaling pathway in colorectal cancer cell lines in vitro and lung metastatic nodes in vivo [27]. DLL3 plays a pivotal role in Notch signaling, influencing various cellular processes such as differentiation, proliferation, survival, and apoptosis [28]. SEMA4F acts as a key regulator of tumorigenesis and is associated with the activity-dependent progression of glioblastoma [29]. The elevated expression of these genes supports the notion of a poor prognosis in the miR-3127–high tumors group.
We identified numerous DEGs between miR-3127–high and miR-3127–low melanoma samples. Among the upregulated genes in the miR-3127–high group were RTN4R, PAK4, SNTA1, CNNM3, NAXE, SMYD5, PPARD, and EPHX1, while IGFBP3 and KIAA0040 were downregulated. These genes are associated with various functions including as CDM, cytokines, growth factors, TCG, and oncogenes. For instance, PAK4 is a member of the PAK family and plays a crucial role in regulating cell adhesion, migration, proliferation, and survival. Its expression is frequently dysregulated in cancer [30,31]. SNTA1/P66shc-mediated Rac1 activation has been linked to increased reactive oxygen species production and migratory potential in breast cancer cells [32]. The protein tyrosine phosphatase PRL-2 forms a complex with the magnesium transporter CNNM3 to promote tumorigenesis [33]. Conversely, IGFBP-3, which was downregulated in tumors with elevated miR-3127 levels, binds to insulin-like growth factors to inhibit cell proliferation [34].
Pathway analysis demonstrated that genes predominantly associated with cell cycle functions, DNA repair, response to UV exposure, and metabolic were enriched in melanomas with high miR-3127 levels. Conversely, miR-3127–low samples exhibited enrichment in inflammation-related genes, such as elevated expression of PAFAH1B2, a key player in inflammation and anaphylaxis [35]. The impact of inflammation on cancer is double-edged: it can either promote or suppress tumor progression. Chronic inflammation tends to facilitate tumor development and resistance to treatment, while acute inflammatory reactions can stimulate dendritic cell maturation, antigen presentation, and anti-tumor immune responses [36,37], which could account for the favorable prognosis seen in patients with low miR-3127 levels. Additionally, in methylation GSEA, a total of 122 biological processes were significantly altered, indicating epigenetic dysregulation in various cancer-related processes such as those mediated by SATB1 targets, uveal melanoma signal, the TRKR pathway, EZH2 targets, and the mTOR pathway.
While miRNA signatures have shown promise as prognostic markers for melanoma, there are challenges associated with their application. A key limitation of this research is inherent to performing bioinformatic analysis from the TCGA database. There is a need to establish standardized methodologies to conduct larger studies with independent validation sets to ensure the reliability of miRNA signatures detected in these analyses. Addressing these challenges will contribute to the effective utilization of miR-3127 signatures in clinical settings.
Our findings demonstrate that miR-3127 is a useful biomarker to predict prognosis of melanoma, with increased expression of miR-3127 being associated with an unfavorable prognosis. These results suggest that miR-3127 may play an important role in the complex mechanisms underlying the multi-step process of melanoma progression. The expression profile of miR-3127 could function as a prognostic indicator, aiding in the management and treatment of patients with melanoma.
Supplementary Information
The Data Supplement is available with this article at https://doi.org/10.4132/jptm.2025.07.08.
Notes
Ethics Statement
Not applicable.
Availability of Data and Material
The datasets used and analyzed during the current study are available from the corresponding author on reasonable request.
Code Availability
Not applicable.
Author Contributions
Conceptualization: TPXN, MKL, CMB, VGH. Data curation: TPXN, MKL. Formal analysis: TPXN, MKL. Investigation: TPXN, MKL. Methodology: TPXN, MKL, CMB, VGH. Project administration: TPXN, VGH. Resources: TPXN, MKL. Software: MKL. Supervision: VGH. Validation: TPXN, MKL. Visualization: MKL. Writing—original draft: TPXN. Writing—review & editing: MKL, CMB, VGH. Approval of final manuscript: all authors.
Conflicts of Interest
The authors declare that they have no potential conflicts of interest.
Funding Statement
No funding to declare.