E-submission
Articles
- Page Path
- HOME > J Pathol Transl Med > Volume 48(2); 2014 > Article
-
Case Study
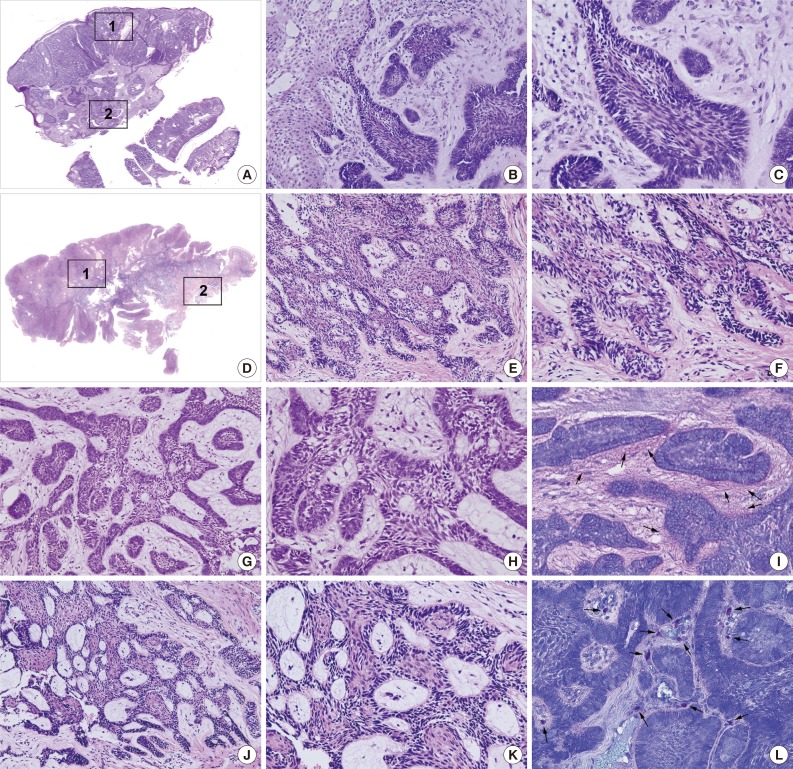
Different Protein Expressions between Peripheral Ameloblastoma and Oral Basal Cell Carcinoma Occurred at the Same Mandibular Molar Area - Yeon Sook Kim, Suk Keun Lee1
-
Korean Journal of Pathology 2014;48(2):151-158.
DOI: https://doi.org/10.4132/KoreanJPathol.2014.48.2.151
Published online: April 28, 2014
Department of Dental Hygiene, College of Health Sciences, Cheongju University, Cheongju, Korea.
1Department of Oral Pathology, College of Dentistry, Gangneung-Wonju National University, Gangneung, Korea.
- Corresponding Author: Suk Keun Lee, D.D.S. Department of Oral Pathology, College of Dentistry, Gangneung-Wonju National University, 7 Jukheon-gil, Gangneung 210-702, Korea. Tel: +82-33-640-2228, Fax: +82-33-642-6410, 'sukkeunlee@hanmail.net'
• Received: February 7, 2013 • Revised: March 26, 2013 • Accepted: April 4, 2013
© 2014 The Korean Society of Pathologists/The Korean Society for Cytopathology
This is an Open Access article distributed under the terms of the Creative Commons Attribution Non-Commercial License (http://creativecommons.org/licenses/by-nc/3.0/) which permits unrestricted non-commercial use, distribution, and reproduction in any medium, provided the original work is properly cited.
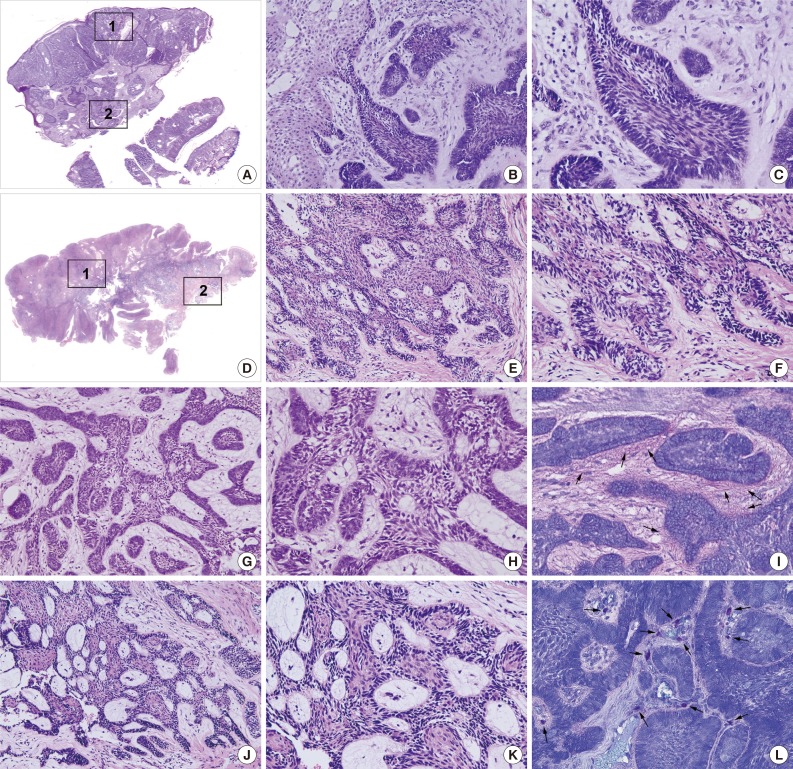
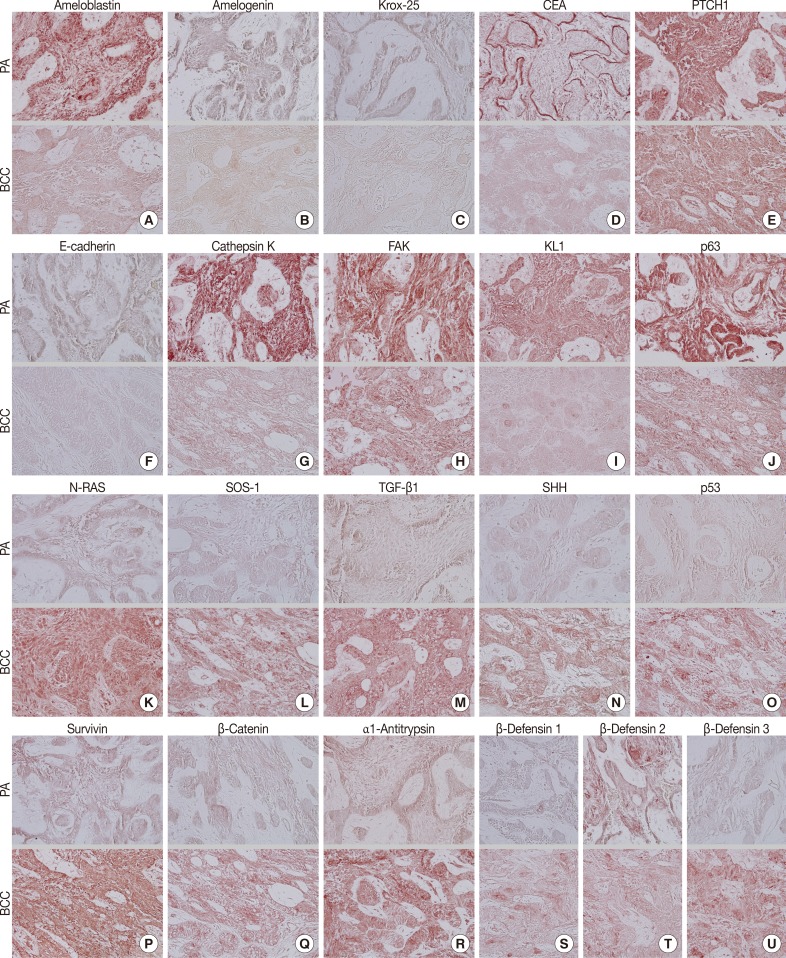
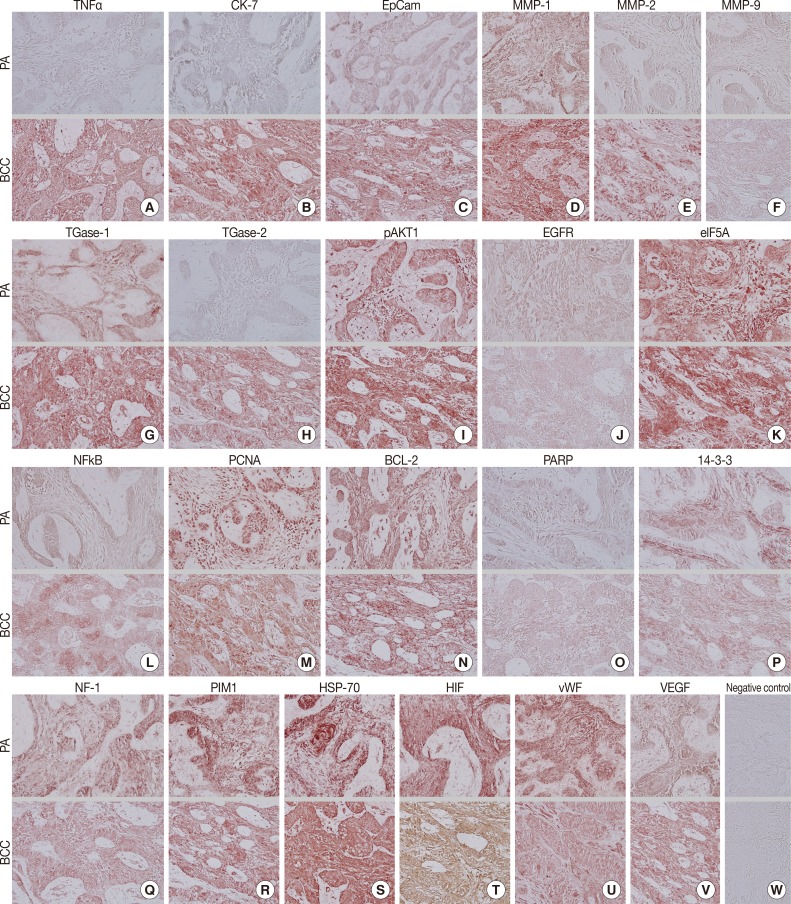
Figure & Data
References
Citations
Citations to this article as recorded by 
- Role of HIF-1α in Ameloblastoma: A Systematic Review
Ayushi Jain, Pooja Sharma, N Sivakumar, Priya Devi, Shalini Gupta, Shaleen Chandra
Indian Journal of Otolaryngology and Head & Neck Surgery.2023; 75(4): 3136. CrossRef - Expression of ameloblastin in the human tooth germ and ameloblastoma
Suganya Panneer Selvam, Irulandy Ponniah
Oral Diseases.2018; 24(8): 1538. CrossRef - The Use of BEREP4 Immunohistochemistry Staining for Detection of Basal Cell Carcinoma
Anthony Paulo Sunjaya, Angela Felicia Sunjaya, Sukmawati Tansil Tan
Journal of Skin Cancer.2017; 2017: 1. CrossRef - Peripheral ameloblastoma of the mandible: A case report
Takahiro Kaneko, Satoshi Nakamura, Ryutarou Kawano, Norio Horie, Tetsuo Shimoyama
Journal of Oral and Maxillofacial Surgery, Medicine, and Pathology.2016; 28(6): 565. CrossRef
 PubReader
 ePub Link
-
 Cite this Article
- Cite this Article
-
- Close
- Download Citation
- Close
- Figure
-