Association of PTTG1 expression with invasiveness of non-functioning pituitary adenomas
Article information

Abstract
Background
Pituitary tumor transforming gene 1 (PTTG1), paired-like homeodomain 2 (PITX2), and galectin-3 have been widely studied as predictive biomarkers for various tumors and are involved in tumorigenesis and tumor progression. We evaluated the usefulness of PTTG1, PITX2, and galectin-3 as predictive biomarkers for invasive non-functioning pituitary adenomas (NFPAs) by determining the relationship between the expressions of these three proteins and the invasiveness of the NFPAs. We also investigated whether PTTG1, E-cadherin, and Ki-67, which are known to be related to each other, show a correlation with NFPA features.
Methods
A retrospective study was conducted on 87 patients with NPFAs who underwent surgical removal. The NFPAs were classified into three groups based on magnetic resonance imaging findings of suprasellar extension and cavernous sinus invasion. Immunohistochemical staining for PTTG1, PITX2, galectin-3, E-cadherin, and Ki-67 was performed on tissue microarrays.
Results
PTTG1 expression showed a statistically significant correlation with the invasiveness of NFPAs, whereas PITX2 and galectin-3 did not have a relationship with the invasiveness of NFPAs. Moreover, there was no association among PTTG1, E-cadherin, and Ki-67 expression.
Conclusions
PTTG1 has the potential to serve as a predictive biomarker for invasive NFPA. Furthermore, this study may serve as a reference for the development of PTTG1-targeted therapeutic agents.
Pituitary adenoma is a common neuroendocrine tumor that accounts for approximately 17% of all primary intracranial neoplasms [1]. While most of these tumors are benign, some show aggressive patterns such as invasion into surrounding structures. In contrast to the functioning pituitary adenomas, which are usually quickly detected due to symptoms of excess hormone secretion, the detection of a non-functioning pituitary adenoma (NFPA) is relatively delayed. As a result, NFPAs are usually found as macroadenomas (1–4 cm) or giant adenomas (> 4 cm) with suprasellar extension (SSE), which tend to invade into the cavernous sinus. The effectiveness of hormone control therapy for NFPA is limited, and surgical removal is the only effective treatment [2,3]. Based on these aspects, it is clinically important to identify prognostic markers of NFPAs.
In the 2004 World Health Organization (WHO) classification, three subcategories were proposed for the classification of primary pituitary tumors: typical, atypical, and carcinoma [4]. Atypical pituitary adenoma was diagnosed based on histopathological features, including a high Ki-67 proliferation index (> 3%), p53 expression, and a high mitotic count. However, as the WHO classification was revised in 2017, the term “atypical pituitary adenoma” is no longer recommended based on studies reporting that this subtype does not reflect prognosis [5–7]. Instead, histological or radiological invasiveness status has emerged as an important factor for predicting prognosis, which was also introduced in the 2017 WHO classification [5,8]. In general, two factors are predominantly used to evaluate the invasiveness status of pituitary adenoma: SSE and cavernous sinus invasion (CSI). CSI is directly associated with prognosis [9]. On the other hand, there are many studies indicating that SSE alone lacks prognostic value [10–12]. However, several grading systems combining SSE and CSI have shown significant prognostic value and are currently widely used [13].
Until the term “atypical pituitary adenoma” was accepted, p53 was generally used as a biomarker for aggressive pituitary adenoma [14]. However, as various studies asserting that p53 is not suitable as a prognostic marker have been published, there is now no biomarker of aggressive pituitary adenomas with proven validity [9,15,16]. Currently, only a few candidate proteins are being studied [17].
This study focused on the pituitary tumor transforming gene 1 (PTTG1), paired-like homeodomain 2 (PITX2), and galectin-3 proteins as predictive biological markers for invasive NFPAs. PTTG1 and PITX2 are not widely used markers, but it has been continually reported that these proteins are related to tumors and their aggressiveness in various organs. PTTG1 is an oncogene that participates in mitosis, DNA repair, angiogenesis, and cell proliferation [18–21]. PTTG1 is also known to induce tumor aggressiveness by being involved in epithelial-to-mesenchymal transition (EMT) and down-regulating E-cadherin expression [19,22,23]. PITX2, a member of the paired-like homeobox transcription factor family, regulates cell cycle regulators such as cyclin D1, cyclin D2, and c-Myc. Galectin-3 is a well-known prognostic and diagnostic marker in various organs that is involved in various biological processes, including cell growth, angiogenesis, cell adhesion, and tumor progression [24,25].
In this study, we aimed to determine the correlation between PTTG1, PITX2, and galectin-3 expression levels and to evaluate the various clinicopathologic characteristics of the NFPAs, including invasiveness status. Moreover, we evaluated the relationships among PTTG1, E-cadherin, and Ki-67 in NFPAs. This is the first study to investigate the biological significance of PTTG1, PITX2, and galectin-3 in Korean patients with NFPAs.
MATERIALS AND METHODS
Patients and tissue specimens
The archived specimens of 124 patients with NFPAs, obtained from 2000 to 2019 by surgical resection, including the transsphenoidal approach, at Keimyung University Dongsan Hospital (Daegu, Korea), were analyzed in this study. A pathological diagnosis of the surgical specimens was made based on hematoxylin and eosin staining and immunohistochemical staining for six pituitary hormones (growth hormone, thyroid-stimulating hormone, prolactin, follicle-stimulating hormone, luteinizing hormone, and adrenocorticotropic hormone). Clinical confirmation that these adenomas did not exhibit excess hormone secretion was based on checking the patients’ serum hormone levels and the absence of hormone-related symptoms. Cases showing positive immunohistochemical staining but not associated with clinical evidence of excess hormone secretion were diagnosed as NFPAs. Sufficient tissue for the construction of microarrays was available from 87 of the 124 cases. Clinical data, including age, sex, symptoms, recurrence, and survival status, were obtained via retrospective chart review.
Radiographic analysis
Tumor size and invasion status were evaluated using magnetic resonance imaging (MRI). Tumor size was recorded as the longest diameter. CSI was evaluated based on the criteria presented by Cottier et al. [26]. The samples were then classified into three groups: group I, neither SSE nor CSI; group II, only one of SSE or CSI; and group III, both SSE and CSI. We considered that a higher group level indicated a more aggressive tumor.
Construction of tissue microarrays
Four tissue microarray (TMA) blocks were constructed from archived, formalin-fixed paraffin blocks of the 87 samples with sufficient tumor cells. After checking the tumor cell-rich areas on the hematoxylin and eosin slides, a 3-mm-diameter core was collected from each sample and then arranged on premade recipient paraffin blocks (UB06-3, UNITMA, Seoul, Korea).
Immunohistochemistry
Sections (5 μm in thickness) were obtained from the four TMA blocks described above. Immunohistochemical staining for PTTG1, E-cadherin, Ki-67, PITX2, and galectin-3 was performed using an automated slide-processing system (Bench-Mark XT, Ventana Medical Systems, Tucson, AZ, USA). The cut sections were pretreated with Cell Conditioner 1 (CC1, #950-124, Ventana Medical Systems) for 40 minutes. The sections were then incubated with PTTG1 antibody (1:200, #34-1500, Thermo Fisher Scientific, Waltham, MA, USA), PITX2 antibody (1:50, #ab32832, Abcam, Cambridge, UK), galectin-3 antibody (1:200, #18-0393, Thermo Fisher Scientific), E-cadherin antibody (1:400, #M3612, Dako, Glostrup, Denmark), and Ki-67 antibody (1:200, #ab16667, Abcam) for 32 minutes each. The OptiView DAB Detection Kit (#760-700, Ventana Medical Systems) was used for chromogenic detection.
Protein expression was evaluated by scoring the intensity of each stain on a scale of 0 (negative), 1 (weak), 2 (moderate), and 3 (strong). Since the proportion of each stain was uniform in most of the tumors, the expression level was determined only by the intensity of the stain. For Ki-67 staining, the stained cells were counted using a computer-assisted image analyzer (GenASIs HiPath, Applied Spectral Imaging Inc., Carlsbad, CA, USA).
Statistical analysis
The chi-squared test was used to determine the differences among expression groups of PTTG1, PITX2, galectin-3, and E-cadherin associated with clinical characteristics (e.g., SSE, CSI, sex, and recurrence). Linear-by-linear association was used to evaluate the correlation of the three invasiveness groups with PTTG1, PITX2, and galectin-3 expression levels. The independent t-test was used to analyze the relationships among the three candidate biomarkers and clinical factors including age, tumor size, and Ki-67 index. Analysis of variance was used to determine the differences between the three invasiveness groups associated with age and tumor size. An ordinal logistic regression model was used to compare the influences of individual factors, including PTTG1, PITX2, galectin-3, E-cadherin, Ki-67, age, sex, and tumor size, on NFPA invasiveness. All analyses were performed using IBM SPSS Statistics for Windows, ver. 25 (IBM Corp., Armonk, NY, USA). Statistical significance was set at p < 0.05.
RESULTS
Patient characteristics
The characteristics of the 87 patients with NFPA are shown in Table 1. The median age at diagnosis was 54 years (range, 16 to 83 years). Among these 87 patients, 48 (55.2%) were men and 39 (45.8%) were women. The mean tumor size (± standard deviation [SD]) was 28.3 ± 12.5 mm, and there were two cases with missing tumor size data.
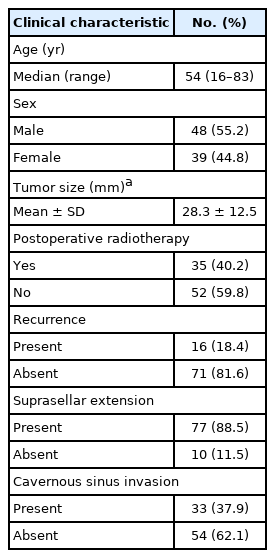
Clinical characteristics of patients with non-functioning pituitary adenomas
Overall, 77 patients (88.5%) showed SSE and 33 cases (37.9%) showed CSI on MRI (Table 1). Among the 87 patients, seven (8.0%) were in group I, 50 (57.5%) were in group II (SSE only, 47; CSI only, 3), and 30 (34.5%) were in group III (Fig. 1).
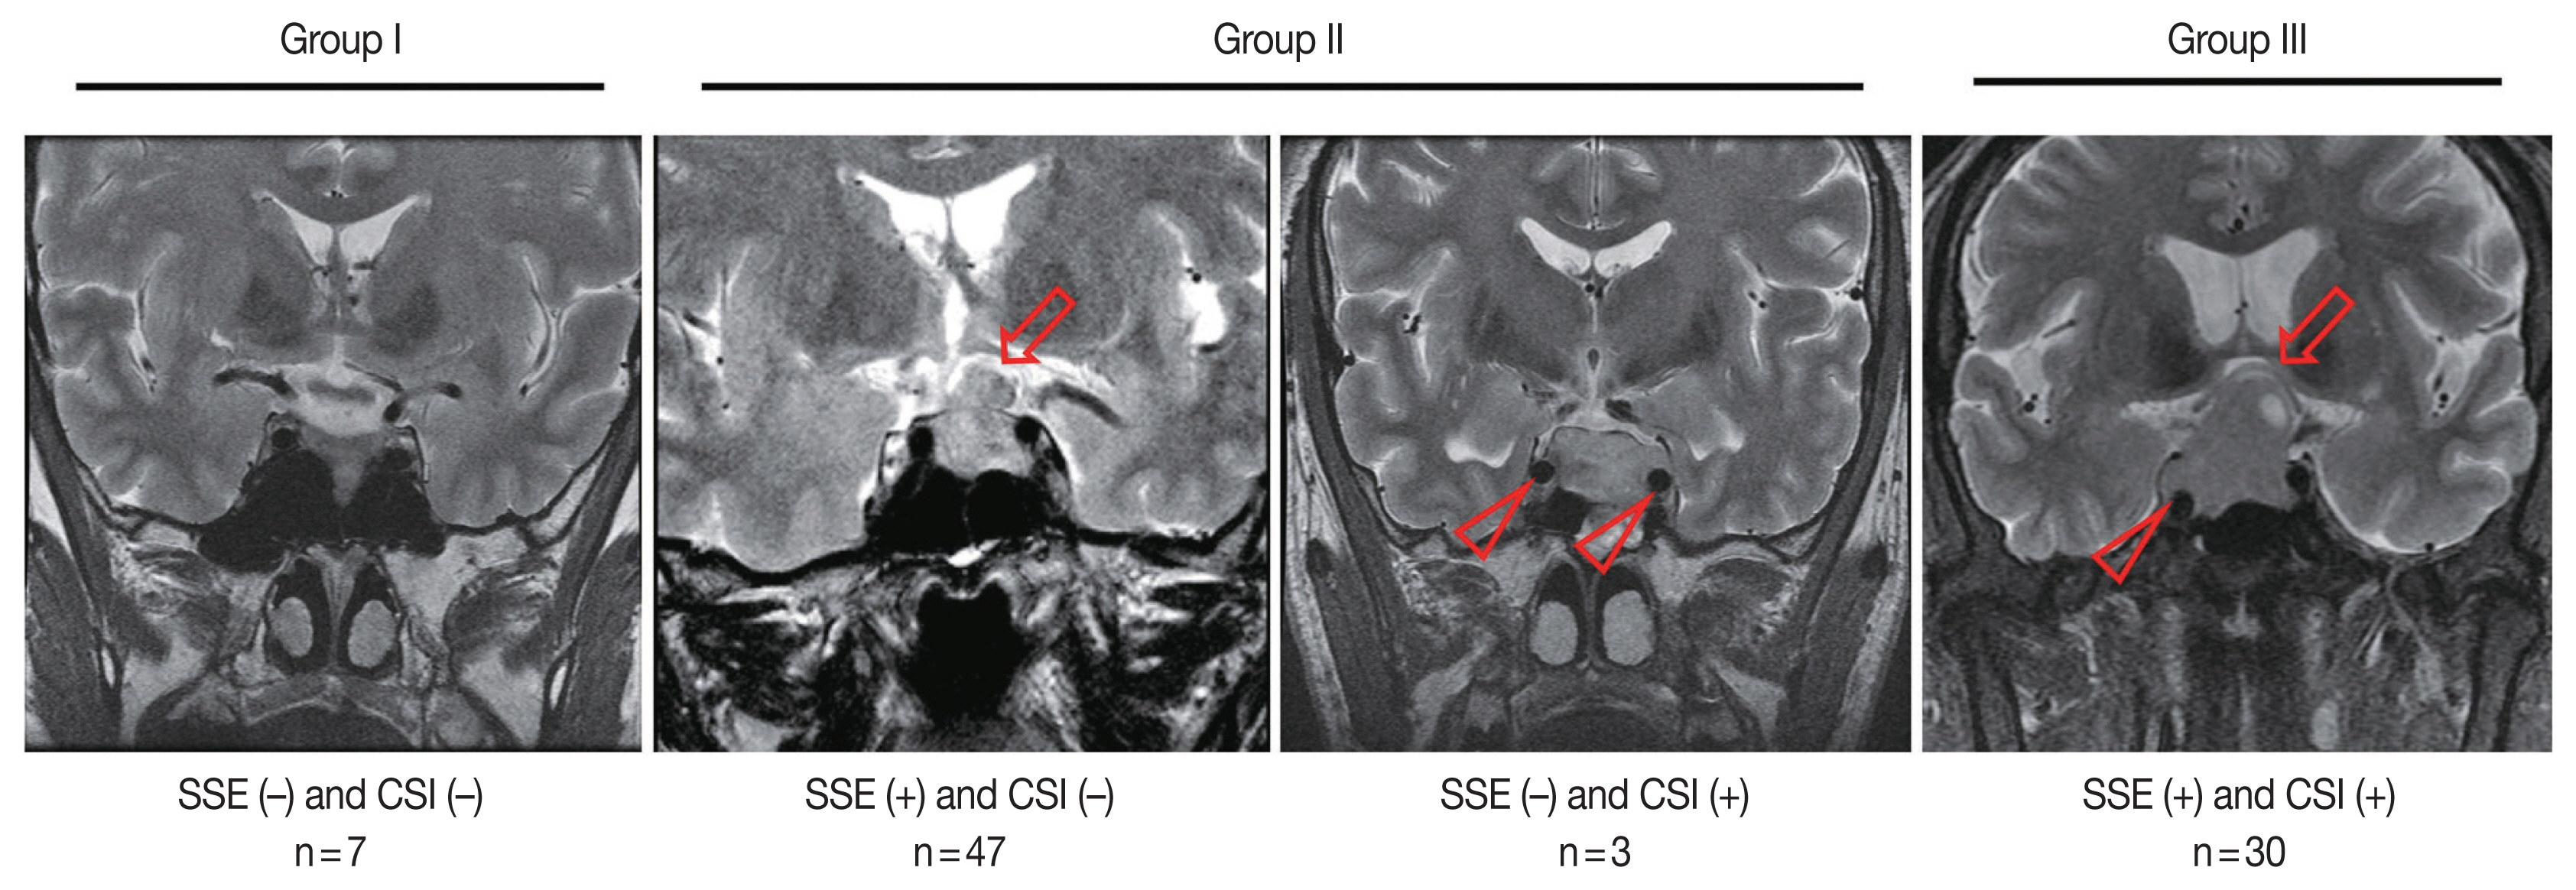
Invasiveness groups of non-functioning pituitary adenoma (NFPA) based on suprasellar extension (SSE) and cavernous sinus invasion (CSI) on magnetic resonance imaging (MRI). The representative MRI images of SSE (arrows) and CSI (arrowheads) are shown. NFPAs were classified into three groups based on the MRI findings: group I, neither SSE nor CSI; group II, only one of SSE or CSI; group III, both SSE and CSI.
Thirty-five patients (40.2%) underwent post-operative radiotherapy. During each follow-up period (mean, 66 months; range, 0.5 to 209 months), tumor recurrences were observed in 16 patients (18.4%), and non-disease-related death was observed in one patient. Disease-related death was not observed.
Expression levels of PTTG1, PITX2, and galectin-3 and their relationship with invasiveness of NFPA
The individual staining patterns and scores of PTTG1, PITX2, and galectin-3 are shown in Fig. 2. Staining of PTTG1 was observed in a cytoplasmic and paranuclear pattern. In PTTG1 staining, a score of 0 was considered no expression, scores of 1 and 2 were considered low expression, and a score of 3 was considered high expression. Staining of PITX2 and galectin-3 showed both nuclear and cytoplasmic patterns. In PITX2 and galectin-3 staining, a score of 0 was considered no expression, a score of 1 was considered low expression, and scores of 2 and 3 were considered high expression. Expression levels of PITX2 and galectin-3 were applied differently from PTTG1 because there were too few cases with scores of 3 in PITX2 and galectin-3 staining, making it difficult to calculate the appropriate statistics. Ten (11.5%) specimens were negative for PTTG1, and 52 (59.8%) and 25 (28.7%) specimens showed low and high PTTG1 expression, respectively. In PITX2 staining, 21 (24.1%) of the specimens showed no expression, 30 (34.5%) showed low expression, and 36 (41.4%) showed high expression. In galectin-3 staining, 37 (42.5%) specimens showed no expression, 27 (31.0%) showed low expression, and 23 (26.4%) showed high expression.

Scoring of immunohistochemical staining for pituitary tumor transforming gene (PTTG1), paired-like homeodomain 2 (PITX2), and galectin-3. The intensity of immunohistochemical stains was scored from 0 (negative) to 3 (strong). PTTG1: a score of 0 was regarded as negative, scores of 1 and 2 were regarded as low, and a score of 3 was regarded as high expression. PITX2 and galectin-3: a score of 0 was regarded as negative, a score of 1 was regarded as low, and scores of 2 and 3 were regarded as high expression.
PTTG1 expression was significantly correlated with NFPA invasiveness. In the high PTTG1 expression group, SSE or CSI was observed more frequently than in the negative or low PTTG1 expression group (p = .033) (Table 2). Similarly, the higher invasiveness group showed higher PTTG1 expression, and the lower invasiveness group showed lower PTTG1 expression (p = .003) (Table 3, Fig. 3). There was no association between PITX2 or galectin-3 expression and invasiveness (Table 3). As described above, expression levels of PITX2 and galectin-3 were applied differently from PTTG1 because the number of cases with scores of 3 in PITX2 and galectin-3 was too few (score 1, low expression; scores 2 and 3, high expression). Nevertheless, even when the expression levels of PITX2 and galectin-3 were classified in the same way as PTTG1 expression (scores 1 and 2, low expression; score 3, high expression), there was no statistically significant correlation between PITX2 and galectin-3 expression and NFPA invasiveness (p = .271 for PITX2, p = .997 for galectin-3).
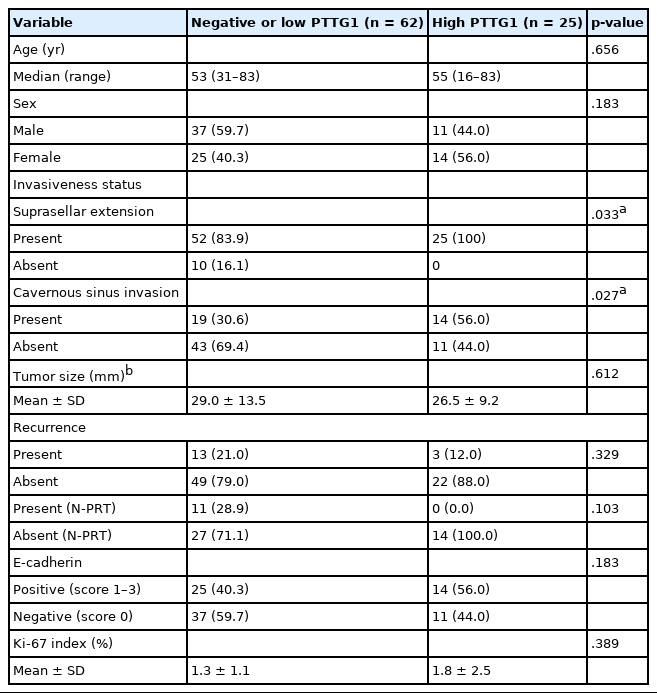
Clinicopathologic characteristics according to PTTG1 expression
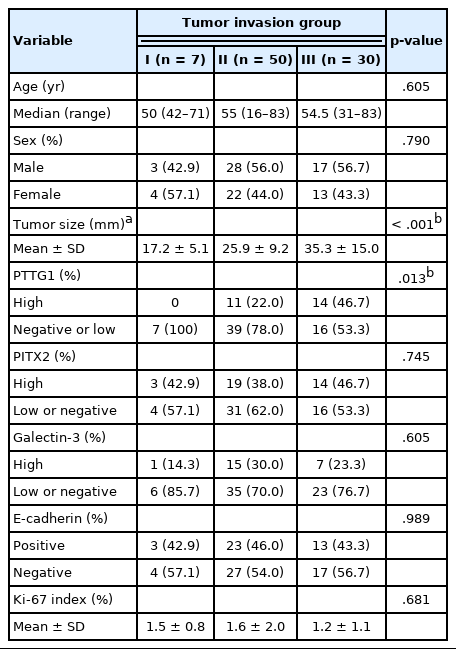
Clinicopathologic characteristics according to tumor invasiveness group
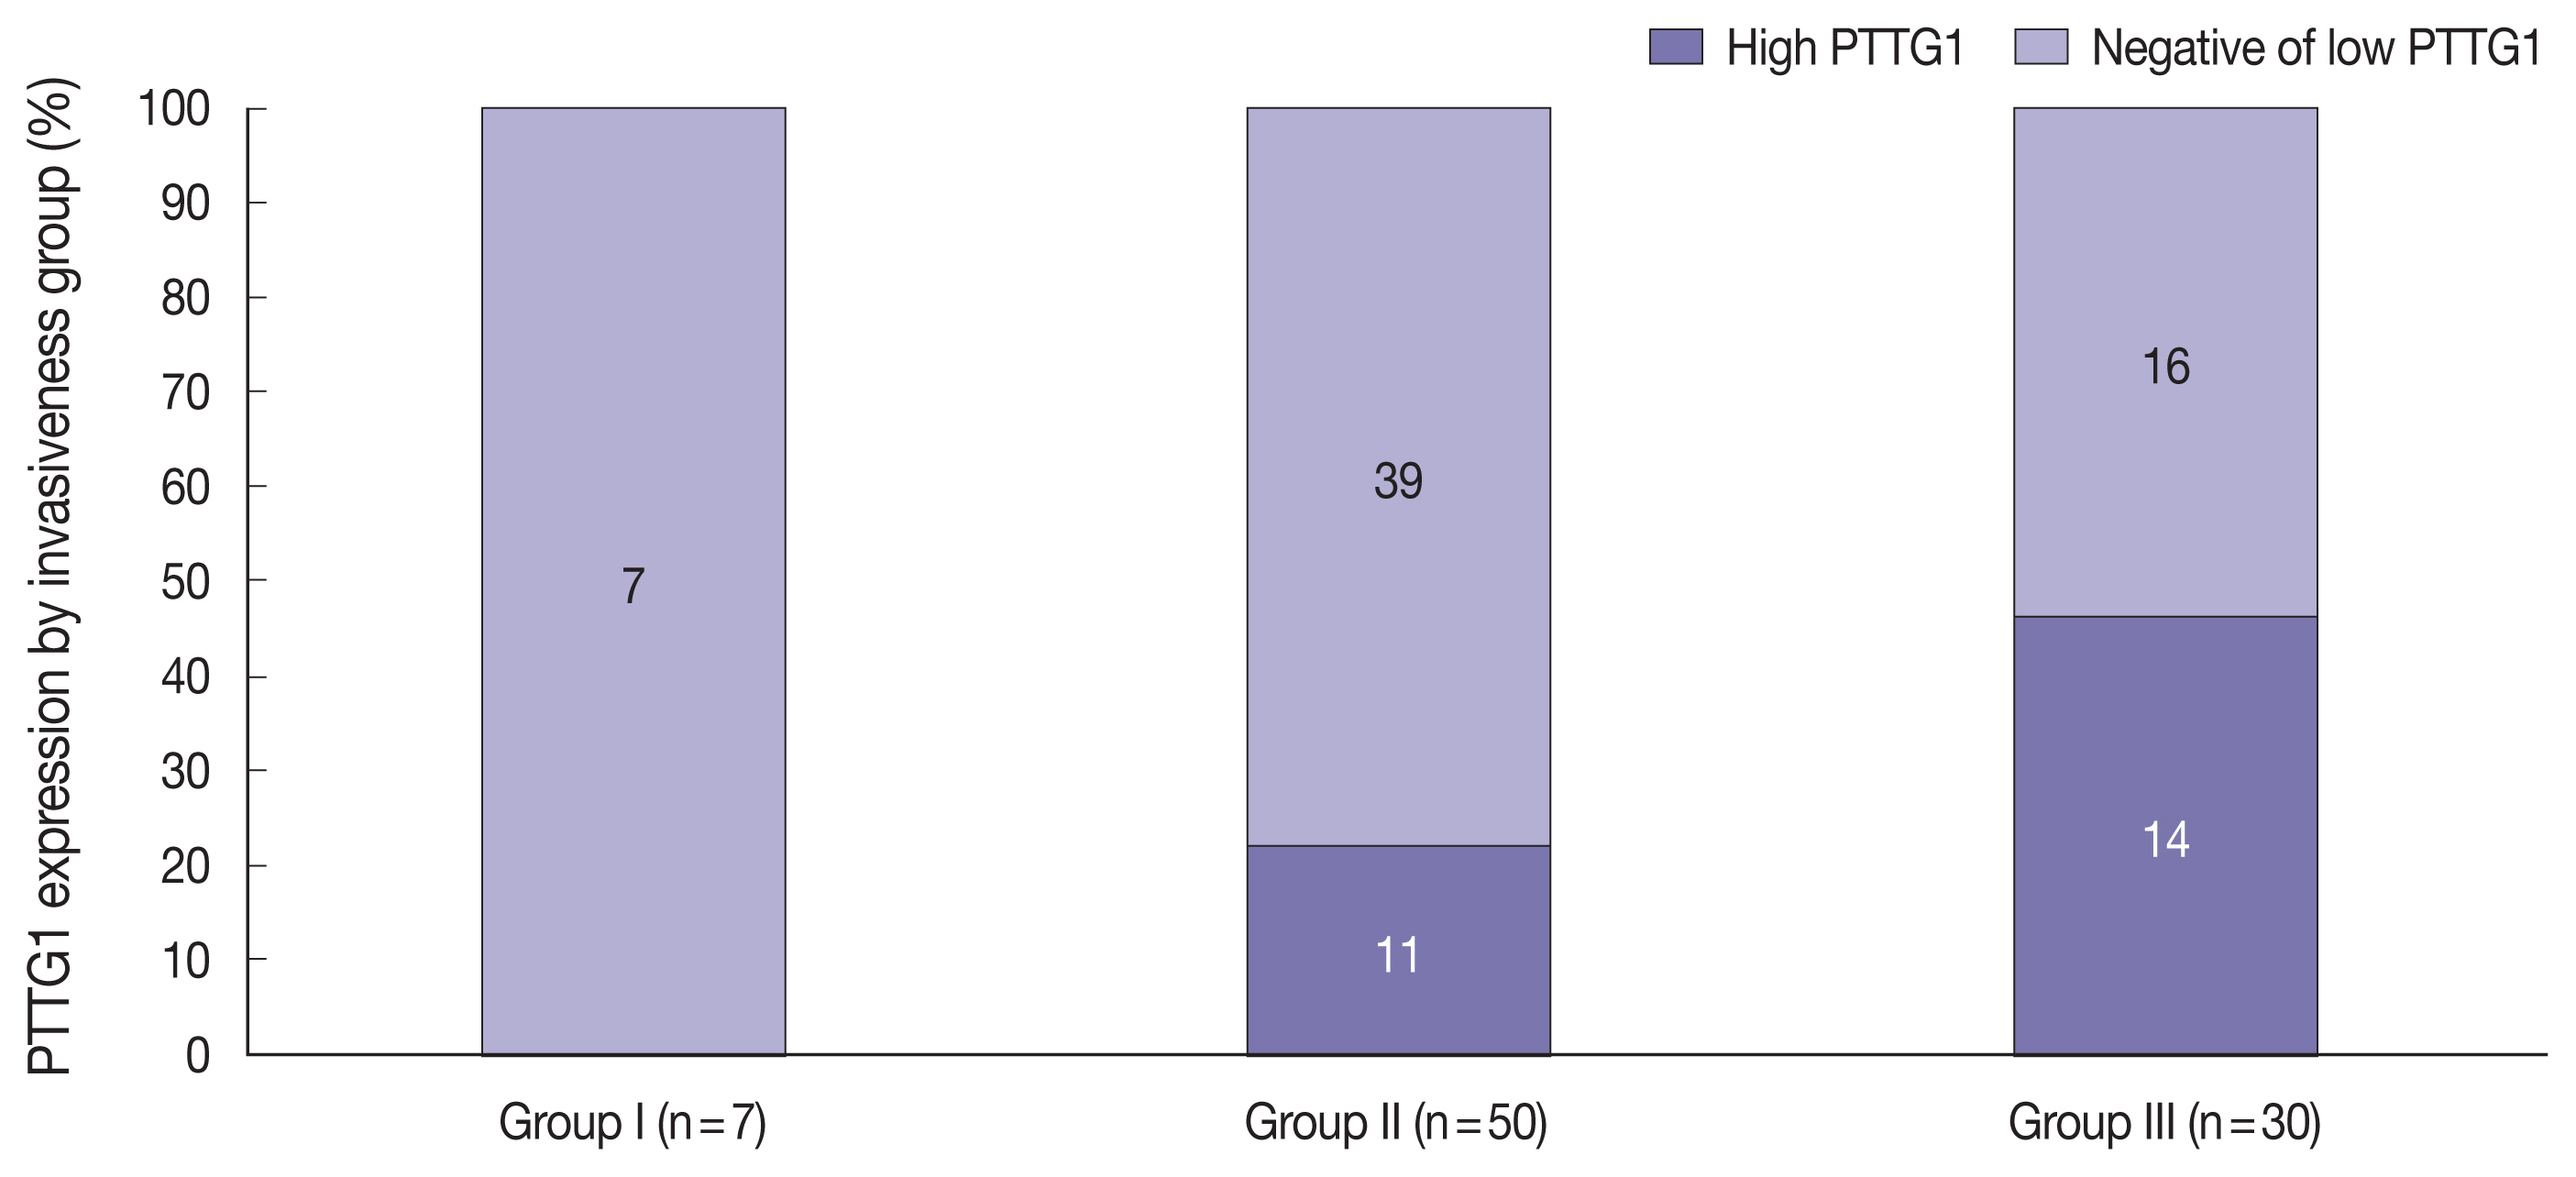
Stacked column chart showing the ratio of pituitary tumor transforming gene (PTTG1) expression in each invasiveness group. As the level of invasiveness increased, the proportion of high PTTG1 expression tended to increase.
PTTG1, PITX2, and galectin-3 did not show any relationship with other clinical characteristics, such as age, sex, tumor size, and recurrence. Even in the group without post-operative radiotherapy, there was no correlation between PTTG1 expression and recurrence (Table 2).
Relationships of E-cadherin loss and Ki-67 index with PTTG1 expression
The individual staining patterns of E-cadherin and Ki-67 are shown in Fig. 4. The E-cadherin stained in a membranous pattern. A score of 0 was considered negative, and scores of 1 to 3 were considered positive for E-cadherin staining. Forty-eight (55.2%) of the specimens were negative, and 39 (44.8%) showed positive E-cadherin expression. In the high PTTG1 expression group, 11 (44.0%) showed negative E-cadherin expression. In the negative or low PTTG1 expression group, 37 (59.7%) showed negative E-cadherin expression (Table 2). There was no significant correlation between the expression of E-cadherin and PTTG1.
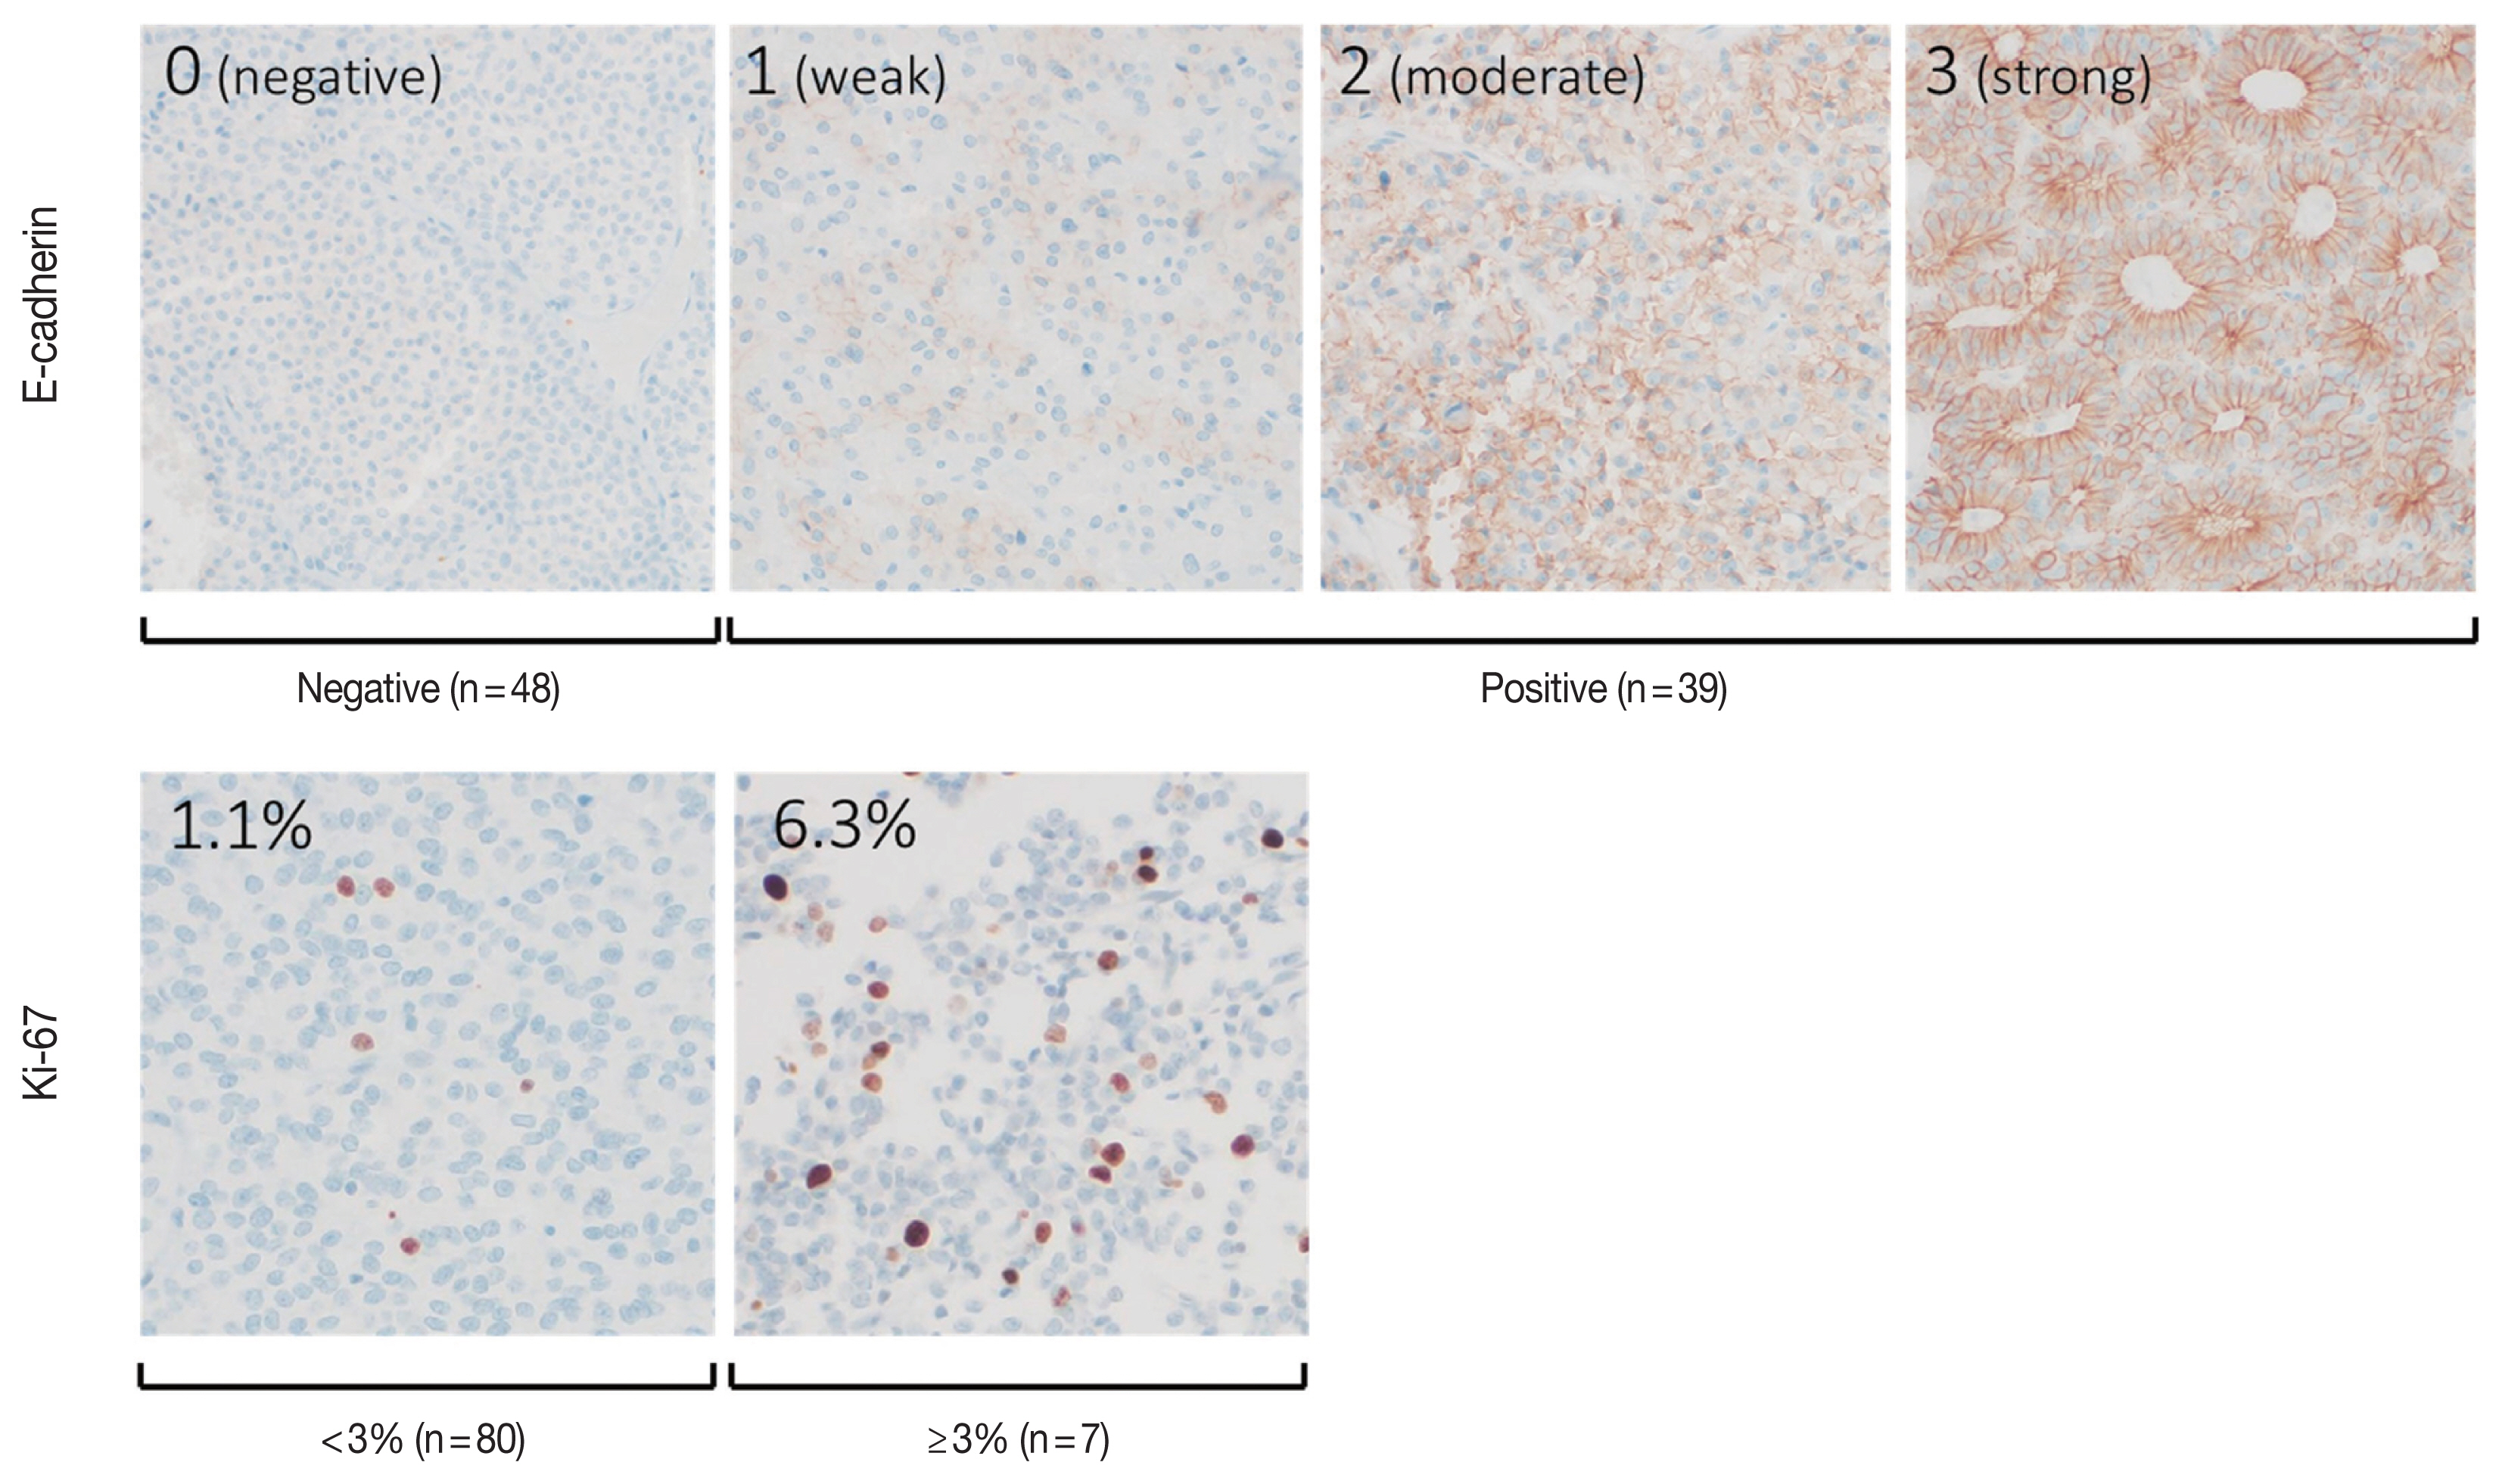
Scoring of immunohistochemical staining for E-cadherin and Ki-67. E-cadherin: a score of 0 was regarded as negative, and scores of 1 to 3 were regarded as positive expression. Ki-67 index was measured by image analyzer, and two samples of the stain are shown.
The Ki-67 staining showed nuclear staining, and the overall average index (± SD) was 1.4% ± 1.4%. The average Ki-67 index in the high PTTG1 expression group was 1.8% ± 2.5%, which was higher than that observed in the negative or low PTTG1 expression group (1.3% ± 1.1%) (Table 2). Ki-67 expression tended to be associated with PTTG1 expression; however, this result was not statistically significant (p = .389).
Other clinical factors associated with aggressive features of NFPA
The tumor invasiveness was significantly correlated with the tumor size: the higher the level of the invasion group, the larger the tumor size (p < .001) (Table 3, Fig. 5A). In addition, tumor size was associated with the recurrence of NFPA (Fig. 5B). As the size of the tumor increased, the NFPA tended to recur. However, post-operative radiotherapy was not considered in this study.
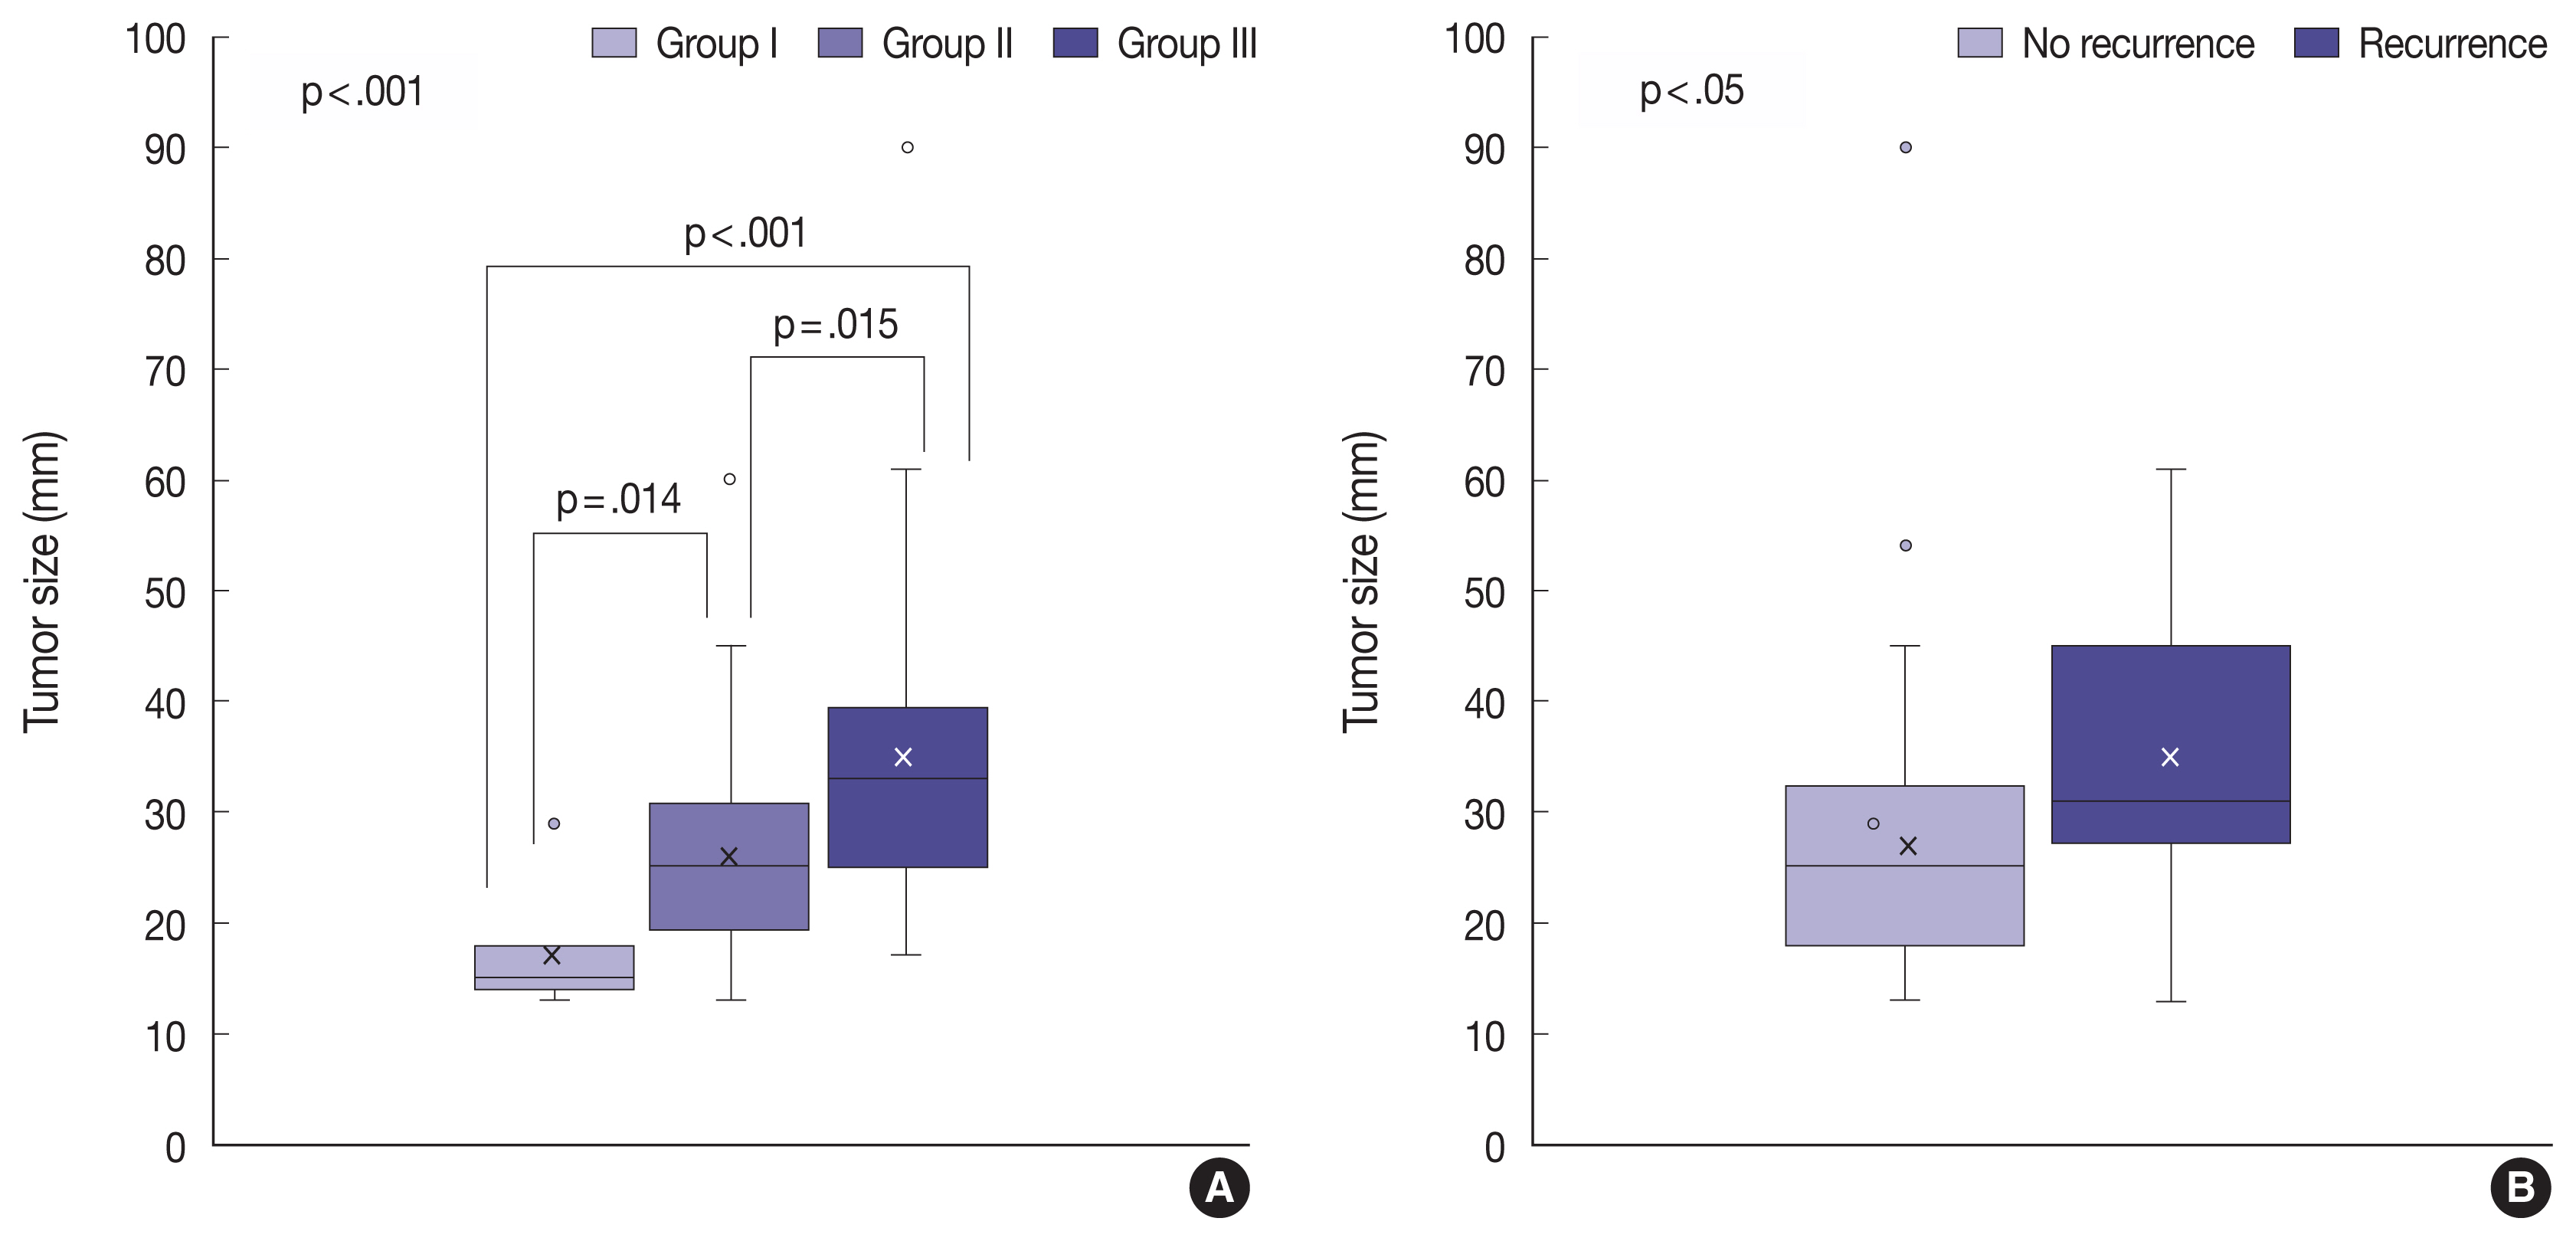
Box plots of the distribution of the tumor size by invasion group and recurrence. A larger tumor size was associated with higher invasiveness (A) and a higher recurrence rate (B).
Multivariate analysis of NFPA invasiveness
Multivariate analysis using ordinal logistic regression showed that PTTG1 expression and tumor size were statistically associated with tumor invasiveness levels (p = .001 for PTTG1, p < .001 for tumor size) (Table 4). The other variables including PITX2, galectin-3, E-cadherin, Ki-67, age, and sex did not show any relationships with the tumor invasiveness groups. In addition, the PTTG1 expression and the tumor size were statistically independent of each other and of other variables including PITX2, galectin-3, E-cadherin, Ki-67, age, and sex (Table 4).
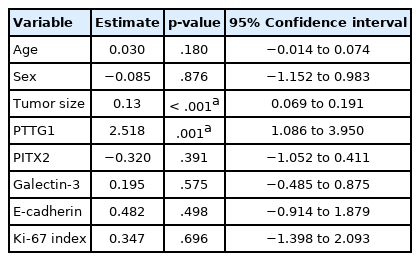
Multivariate analysis (ordinal logistic regression test) of invasiveness groups associated with clinicopathologic variables
DISCUSSION
Although several studies have shown PTTG1 overexpression in pituitary adenomas and in tumors of other organs, a limited number of studies have investigated the relationship between PTTG1 expression and tumor invasiveness [18,27,28]. A meta-analysis of these studies concluded that there was a significant relationship between PTTG1 expression and the invasiveness of pituitary adenomas [29]. However, most of these studies were limited to a specific subtype of functioning pituitary adenomas or did not distinguish functioning adenomas from non-functioning adenomas.
In this study, we performed an analysis limited to NFPA, and demonstrated that PTTG1 expression was significantly correlated with the invasiveness of NFPA. Only a few previous studies have explored PTTG1 expression and invasiveness status limited to NFPA [18,27,30]. A study by Trott et al. [30] revealed that PTTG1 expression and the invasiveness status of NFPA had an important correlation. Additionally, research by McCabe et al. [18] revealed PTTG1 overexpression in both invasive NFPAs and invasive functioning pituitary adenomas. The results of the present study support these two previous studies. In contrast, a previous study conducted by Zhang et al. [27] did not identify a correlation between PTTG1 expression and invasiveness in NFPA but did reveal the correlation in functioning pituitary adenomas. However, the number of the NFPA samples in the study by Zhang et al. [27] was 30, which was smaller than those included in the studies that confirmed the significant correlation between PTTG1 and NFPA invasiveness, including our study; the numbers of NFPA samples were 56 for the study by Trott et al. [30], 92 for the study by McCabe et al. [18], and 87 for the present study. It is therefore reasonable to assume that PTTG1 expression is correlated with NFPA invasiveness, as it is in other organ tumors.
Several studies revealed a correlation between PTTG1 expression and the recurrence of pituitary adenomas [30–32]. One of these studies by Fillippella et al. [31] did not report the factor of postoperative radiotherapy. Additionally, other studies by Trott et al. [30] and Noh et al. [32] excluded the patients who underwent postoperative radiotherapy. The present study did not reveal a correlation between PTTG1 expression and recurrence of the tumor. We also analyzed PTTG1 expression and recurrence in a group of patients who did not undergo post-operative radiotherapy, but no meaningful results were obtained, contrary to the results of previous studies.
A few studies have demonstrated that PITX2 expression is increased in pituitary adenomas, highlighting a correlation between PITX2 overexpression and the aggressiveness of NFPAs [33,34]. In comparison, however, the results of the present study did not show a relationship between PITX2 expression and NFPA invasiveness. These contradictory results are probably due to the small number of cases in our study. However, since few studies have been conducted on this subject to date, more data should be acquired to establish the relationship between PITX2 expression and NFPA invasiveness.
In pituitary adenoma, galectin-3 expression is increased in functioning pituitary adenomas, especially in functioning corticotroph adenomas, but not in NFPAs [35,36]. In addition, there have been several studies on galectin-3 and the aggressive behavior of pituitary adenoma, which demonstrated that galectin-3 expression is positively correlated with the aggressiveness of pituitary adenomas, but not in NFPAs [36,37]. In the present study with only NFPAs, the intensity of galectin-3 staining was varied, and there was no correlation with the invasiveness of NFPAs. Although we noted a high intensity of galectin-3 staining in our study, the validity of this result should be reassessed because we did not compare the intensity in NFPAs with that in functioning adenomas.
As PTTG1 was the only protein that showed an association with the invasiveness of NFPAs in this study, further investigation was performed on the relationship among PTTG1, E-cadherin, and Ki-67. Based on the previous studies, which showed an association between PTTG1 and E-cadherin loss in the process of EMT in other organs (e.g., head and neck, esophagus, ovary, and breast), we hypothesized that E-cadherin is correlated with PTTG1 expression in NFPAs; this is the first study on PTTG1 and E-cadherin in pituitary adenoma [19,22,23]. However, we could not identify the relationship between PTTG1 expression and E-cadherin loss in NFPAs. This may be due to the small number of cases, but it may also be the result of PTTG1 not being the main causative factor for E-cadherin loss. There are several epigenetic mechanisms that induce E-cadherin loss other than PTTG1, including some microRNAs (e.g., miR-192, miR-200, and miR-205) and the hypermethylation of CDH1 promoter, a gene encoding E-cadherin [38,39]. The results of our study suggest that the factors such as the microRNAs and the hypermethylation of CDH1 promoter may play a greater role than PTTG1 in inducing E-cadherin loss in pituitary adenomas.
There have been previous studies on PTTG1 expression and cell proliferation, but the results are conflicting [40–43]. Studies by Heaney et al. [40] and Wang et al. [41] revealed that PTTG1 promoted cell proliferation. However, studies by Mu et al. [42] and Yu et al. [43] revealed that there was no correlation between PTTG1 and cell proliferation, which is consistent with the results of the present study. In terms of its ability to inhibit chromatid separation during mitosis, PTTG1 is expected to inhibit cell proliferation, but its ability to induce angiogenesis or disrupt the DNA repair system may promote cell proliferation. As there are contradictory views in many studies, the relationship between PTTG1 expression and cell proliferation needs to be further studied.
Additionally, we determined that the invasiveness status and recurrence of NFPAs were significantly correlated with tumor size. According to many studies, pituitary adenomas show aggressive behavior as the size of the tumor increases, which is consistent with the results of our study [44]. However, with respect to tumor recurrence, previous studies have shown that tumor recurrence is not influenced by tumor size, which contradicts the results of the present study [45]. Although the results of our study revealed a correlation between tumor size and recurrence, it should be noted that the factor of post-operative radiotherapy was not considered.
In conclusion, we demonstrated here that PTTG1 has the potential to be a predictive marker for the invasiveness of NFPAs. Although there are many previous studies that have explored the relationship between PTTG1 expression and tumors including pituitary adenoma, in the present study, we elucidated the role of PTTG1, particularly in NFPAs, for the first time. Furthermore, we provide evidence for the development of PTTG1-targeted agents and references for studies on the correlation between PTTG1 and various tumors, which have been continually reported.
Notes
Ethics Statement
This study was approved by the Institutional Review Board of the Keimyung University Dongsan Medical Center, with waiver of informed consent (DSMC 2021-02-036).
Availability of Data and Material
The datasets generated or analyzed during the study are available from the corresponding author on reasonable request.
Code Availability
Not applicable.
Author Contributions
Conceptualization: SPK. Data curation: SJK, IH. Formal analysis: IH, SGK, SJK. Investigation: SJK, HP. Methodology: SPK, SJK. Resources: HWL. Supervision: SPK, IH. Visualization: SJK, IH. Writing—original draft: SJK, IH. Writing—review & editing: SJK, SPK, IH, HWL. Approval of final manuscript: all authors.
Conflicts of Interest
The authors declare that they have no potential conflicts of interest.
Funding Statement
This work was supported by the research promoting grant from the Institute for Cancer Reseach Keimyung University Dongsan Medical Center in 2018.