Size of Non-lepidic Invasive Pattern Predicts Recurrence in Pulmonary Mucinous Adenocarcinoma: Morphologic Analysis of 188 Resected Cases with Reappraisal of Invasion Criteria
Article information
Abstract
Background
We reviewed a series of 188 resected pulmonary mucinous adenocarcinomas (MAs) to clarify the prognostic significance of lepidic and non-lepidic patterns.
Methods
Non-lepidic patterns were divided into bland, non-distorted acini with uncertain invasiveness (pattern 1), unequivocal invasion into stroma (pattern 2), or invasion into alveolar spaces (pattern 3).
Results
The mean proportion of invasive patterns (patterns 2 and 3) was lowest in small (≤ 3 cm) tumors, and gradually increased in intermediate (> 3 cm and ≤ 7 cm) and large (> 7 cm) tumors (8.4%, 34.3%, and 50.1%, respectively). Adjusted T (aT) stage, as determined by the size of invasive patterns, was positively correlated with adverse histologic and clinical features including older age, male sex, and ever smokers. aTis tumors, which were exclusively composed of lepidic pattern (n = 9), or a mixture of lepidic and pattern 1 (n = 40) without any invasive patterns, showed 100% disease- free survival (DFS). The aT1mi tumors, with minimal (≤ 5 mm) invasive patterns (n = 63), showed a 95.2% 5-year DFS, with recurrences (n = 2) limited to tumors greater than 3 cm in total size (n = 23). Both T and aT stage were significantly associated with DFS; however, survival within the separate T-stage subgroups was stratified according to the aT stage, most notably in the intermediatestage subgroups. In multivariate analysis, the size of invasive patterns (p = .020), pleural invasion (p < .001), and vascular invasion (p = .048) were independent predictors of recurrence, whereas total size failed to achieve statistical significance (p = .121).
Conclusions
This study provides a rationale for histologic risk stratification in pulmonary MA based on the extent of invasive growth patterns with refined criteria for invasion.
Invasive mucinous adenocarcinoma is a distinct histologic variant of lung adenocarcinoma that is characterized by tall columnar cells with basally oriented nuclei and intracytoplasmic mucin and was formerly referred to as mucinous bronchioloalveolar carcinoma [1,2]. In most cases, these tumors characteristically display lepidic growth. The clinical presentation of mucinous adenocarcinoma may vary from a small nodular lesion to lobar/multilobar consolidation, and it is not uncommon to encounter multicentric dissemination at presentation, probably reflecting aerogenous spread (AS) [3]. In terms of genetics, the KRAS mutations are prevalent, and recent studies have discovered various new driver mutations such as CD74-NRG1 fusion in KRAS wild-type cases [4-6].
Although these advances further consolidate mucinous adenocarcinoma as a clinicopathologically distinct variant of lung adenocarcinoma, its prognostic factors are largely unknown. In conventional adenocarcinomas, multiple studies have validated the predictive role of histologic grading, primarily by the predominant architectural pattern, namely lepidic, acinar, papillary, micropapillary, and solid [7-10]. Among the histologic subclassification proposed by the International Association for the Study of Lung Cancer, American Thoracic Society and European Respiratory Society (IASLC/ATS/ERS), the lepidic pattern has attracted a great deal of attention because of its association with a favorable prognosis [11-14]. Based on an increasing number of studies showing excellent survival of lepidic predominant tumors, and in line with the IASLC/ATS/ERS classification, the new 2015 World Health Organization (WHO) classification introduced the concept of diagnostic categories of “minimally invasive adenocarcinoma” and “adenocarcinoma in situ” for completely resected, small (≤3 cm) solitary tumors with minimal (≤5 mm) or no invasion, respectively [1,2]. However, as most cases included in previous studies were non-mucinous adenocarcinomas, the prognostic relevance and the prevalence of lepidic pattern have not been documented for mucinous adenocarcinomas. Furthermore, detailed histomorphologic analysis of the non-lepidic pattern in mucinous adenocarcinomas has not been performed.
To clarify the prognostic significance of lepidic and non-lepidic invasive patterns, we evaluated a series of resected pulmonary mucinous adenocarcinomas with refined criteria for invasion and correlated invasive patterns with clinical outcome.
MATERIALS AND METHODS
Patient identification
Between 1995 and 2013, we identified 4,119 cases of surgically resected lung adenocarcinoma at Samsung Medical Center, Korea. We initially collected 317 cases diagnosed as mucinous adenocarcinoma, as well as cases of mucinous bronchioloalveolar carcinoma, from our pathology reports. On pathologic review, the cytomorphologic features of these tumors were rigorously examined. Tall columnar or goblet cell morphology showing characteristic lepidic growth at the tumor periphery was set as the histologic inclusion criteria in this study. Mixed mucinous and non-mucinous tumors with extracellular rather than intracellular mucin, colloid adenocarcinomas predominantly composed of dissecting mucin pools, and enteric adenocarcinomas were excluded. Cases with a history of preoperative treatment and synchronous primary lung cancers were also excluded. Nine cases were excluded because they had multicentric disease at presentation and were resected for diagnostic purposes. Cases showing solid signet ring cells and a cribriform and tubulopapillary pattern were suspected to be anaplastic lymphoma kinase (ALK)–rearranged tumors, and 12 cases were excluded after subsequent ALK immunohistochemical staining for confirmation [15,16]. Finally, a total of 188 cases of surgically treated mucinous adenocarcinoma were evaluated. This study was approved by the Samsung Medical Center Institutional Review Board (file No. 2016-03-055).
Histologic review
All tumors were sectioned and stained in a routine manner and reviewed by two pathologists (S.H. and J.H.) who were blinded to patient outcome. The mean number of reviewed slides was 4.43 per case, corresponding to 1.25 per centimeter of tumor when the total number of reviewed slides was divided by the sum of the greatest dimensions. Lepidic pattern was defined as tumor growth along preexisting alveolar walls, as previously described (Fig. 1A, B) [1]. For non-lepidic patterns, it was difficult to apply the conventional architectural patterns of non-mucinous adenocarcinomas to mucinous adenocarcinomas. Instead, we categorized non-lepidic patterns into three different patterns based on cytomorphologic, architectural and stromal characteristics compared to the lepidic pattern.
Examples of lepidic pattern and non-distorted acini (pattern 1). (A–F) Low-powered (A, C, E) and high-powered (B, D, F) view. (A, B) Typical lepidic pattern showing strips of tumor cells clinging to alveolar walls. (C, D) In areas where the stroma is increased, acinar structures (pattern 1) are formed without alteration of cytomorphologic features. (E, F) Densely spaced, bland acinar structures (pattern 1). The stroma is elastotic, not desmoplastic. (G, H) Immunohistochemical staining for thyroid transcription factor 1 reveals that round-to-oval spaces embedded in the central scar are alveolar spaces partially lined by tumor cells. Complete replacement of these spaces by tumor cells may form an acinar structure.
Pattern 1 was assigned to areas showing bland, non-distorted acinar structures with increased stroma compared to the lepidic pattern (Fig. 1C–F). Cytomorphologic alteration compared to the lepidic pattern was not apparent, with retention of tall columnar cells with preserved nuclear polarity. Architectural distortion was minimal to the extent that the pattern resembled uninvolved alveolar spaces. Increased stroma, which was the only feature distinguishing this pattern from the lepidic pattern, was almost always elastotic, not desmoplastic. Indeed, this pattern was often more reminiscent of lepidic pattern than a true invasive acinar pattern. Presence of the central scar itself did not permit exclusion of this pattern, unless accompanied by cytomorphologic or architectural changes or prominent desmoplasia.
Pattern 2 was assigned to areas showing invasion into the stroma, as evidenced by cytomorphologic alteration, architectural distortion and stromal desmoplasia (Fig. 2A–D). The tumor cells displayed an irregular, jagged, or anastomosing architecture that was clearly distinguishable from normal alveolar structure. Less columnar cytomorphology with loss of nuclear polarity was typically seen in this pattern. Infiltrating single cells with eosinophilic cytoplasm or fused glands with paler cytoplasm were often observed.
Examples of invasive patterns: pattern 2, invasion into stroma (A–D) and pattern 3, invasion into alveolar spaces (E, F). (A) Jagged, fused glands with loss of nuclear polarity support invasiveness. (B) Anastomosing glands with increased nuclear atypia (pattern 2) seen on the right is distinguished from the bland, non-distorted acinar structure (pattern 1) noted on the left. The photomicrographs 2A and 2B were taken from the same case as in 1E and 1F. (C) Intracytoplasmic mucin is replaced by eosinophilic cytoplasm, resulting in squamoid appearance. (D) The area of glandular fusion shows loss of nuclear polarity and paler cytoplasm compared to the area of lepidic pattern on the right. (E) Proliferation towards alveolar spaces results in a serrated appearance. (F) A micropapillary pattern with ring-like structures is seen.
Pattern 3 was assigned to areas showing invasion into alveolar spaces. This pattern typically arose in the background of the lepidic pattern and showed proliferation toward alveolar spaces (Fig. 2E, F). A similar pattern in non-mucinous adenocarcinoma has been referred to as “low papillary structure” by Fukutomi et al. [17]. Similar to papillary and micropapillary pattern in non-mucinous adenocarcinomas, this pattern did not require desmoplastic stroma. Excess proliferation into airspaces frequently caused tumor cells to float within airspaces. When these floating tumor cells were arranged as single cells, ring-like structures, or tight clusters, which were distinguishable from tumor branches attached to the alveolar wall, they were further subcategorized as a micropapillary pattern (Fig. 2F).
Each pattern was recorded in terms of percentage, except for pattern 1. A clear distinction between pattern 1 and the lepidic pattern was not always feasible, since pattern 1 lacked cytomorphologic changes. Furthermore, since acinar structures in pattern 1 were devoid of any features of invasion such as desmoplasia or cytomorphologic atypia as seen in acinar pattern of invasion in non-mucinous adenocarcinoma, we postulated that pattern 1 might be a morphologic spectrum that still represents lepidic growth (Fig. 1G, H), or at least a growth pattern that is related to indolent biologic behavior as a lepidic pattern. We therefore regarded lepidic and pattern 1 as non-invasive patterns, whereas patterns 2 and 3 were considered unequivocally invasive patterns. To measure the size of invasive patterns, the proportions of patterns 2 and 3 were combined. Since the invasive patterns were frequently multifocal, the size of invasion was calculated by multiplying the percentage by the total size in the majority of cases. The size of confluent invasion measured in a single slide was adopted only when it exceeded the calculated value. According to the size of invasive pattern, conventional T staging was adjusted (aT) as follows: aTis, no invasion; aT1mi, minimal (≤5 mm) invasion; aT1a1, >5 mm, ≤1 cm invasion; aT1a2, >1 cm, ≤2 cm invasion; aT1b, >2 cm, ≤3 cm invasion; aT2a, >3 cm, ≤5 cm invasion or visceral pleural invasion (PL1-2); aT2b, >5 cm, ≤7 cm invasion; aT3, >7 cm invasion or satellite tumor nodule in the same lobe or parietal pleural invasion (PL3); and aT4, satellite tumor nodule in a different ipsilateral lobe. Conventional TNM staging and pleural invasion were assessed according to the seventh American Joint Committee on Cancer TNM staging manual [18].
Nuclear atypia was measured in the area showing the highest degree of atypia, and graded as follows: “mild,” small, slightly irregular nuclei with no nucleoli; “moderate,” intermediate-sized, moderately irregular nuclei with small nucleoli; and “severe,” large, markedly irregular nuclei with vesicular chromatin and prominent nucleoli. AS was considered present when tumor cells were present beyond 2 mm from the edge of the main mass. This included discontinuous tumor islands in lepidic pattern as well as single cells, micropapillary, or ring-like structures, termed tumor spread through air spaces in recent studies [19,20]. Vascular invasion, either lymphatic or venous, and tumor necrosis were examined. Intra-alveolar accumulation of neutrophils, which was previously reported to be related with adverse outcome in mucinous adenocarcinoma, was also evaluated [21,22].
EGFR and KRAS mutation, and ALK rearrangement
EGFR gene mutation was detected by real-time polymerase chain reaction with PNA clamping using the PNA-Clamp EGFR Mutation Detection kit (PANAGENE, Inc., Daejeon, Korea) or by direct sequencing of exons 18, 19, 20, and 21, as previously described [23]. KRAS gene mutation was detected by direct sequencing of codons 12 and 13 in exon 2 and codon 61 in exon 3, as previously described [23]. Immunohistochemical staining for ALK protein (1:30, clone 5A4, Novocastra, Newcastle upon Tyne, UK) was used to detect ALK gene rearrangement, and diffuse moderate to strong cytoplasmic reactivity was regarded as positive, as previously described [23].
Statistical analysis
The correlations between clinicopathologic variables and adjusted tumor (aT) stage were assessed by Fisher exact test and chi-square test. Disease-free survival (DFS) was evaluated using the Kaplan-Meier method, and the log-rank test was used for comparison. Multivariate survival analysis was performed using the Cox proportional hazards model. All statistical analyses were performed using SPSS Statistics ver. 19.0 (IBM Corp., Armonk, NY, USA).
RESULTS
Clinicopathologic characteristics
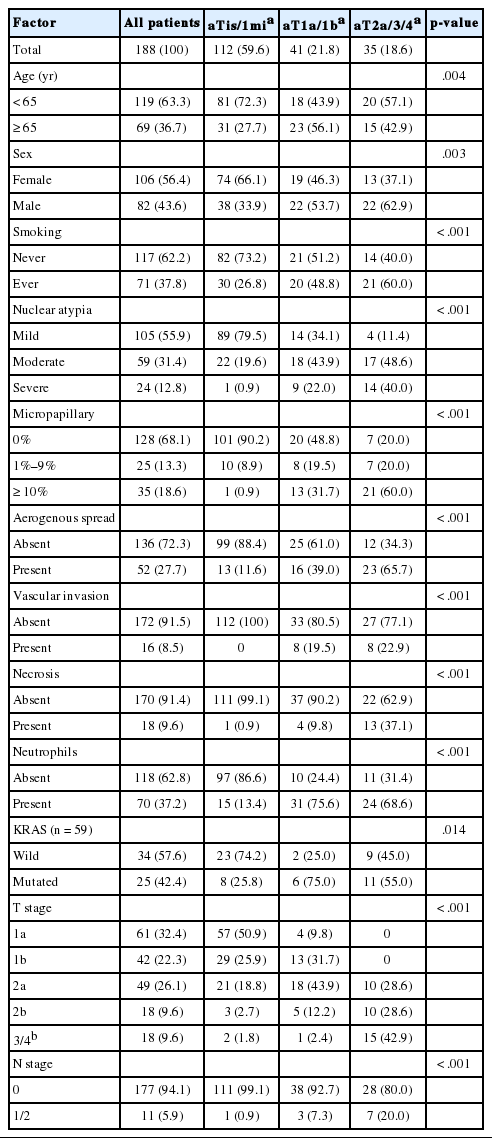
The clinicopathologic features are summarized in Table 1. The mean age was 59.9 years (range, 19 to 84 years), and 63.3% of patients were younger than 65 years. Female patients (56.4%) outnumbered male patients, and never smokers comprised 62.2% of all patients. Fifteen patients (8.0%) underwent wedge resection, one patient underwent segmentectomy, and 172 patients (91.5%) underwent at least lobectomy. Adjuvant chemotherapy was administered in 28 patients (14.9%), of which, eight were American Joint Committee on Cancer stage I, 16 were stage II, and four were stage III.
Correlation of clinicopathologic characteristics with adjusted T stage (aTa)
Mean tumor size was 3.6 cm (median, 2.8 cm; range, 0.5 to 20.0 cm). Nuclear atypia was mild in 105 (55.9%), moderate in 59 (31.4%), and severe in 24 (12.8%) cases. Micropapillary pattern was absent in 128 (68.1%), focally (1%–9%) present in 25 (13.3%), and substantially (≥ 10%) present in 35 (18.6%) cases. AS was present in 52 (27.7%) cases, which presented as lepidic, micropapillary, and both types in 34, 14, and four cases, respectively. Vascular invasion was present in 16 cases (8.5%). Necrosis and intra-alveolar neutrophil accumulation were present in 18 (9.6%) and 70 (37.2%) cases, respectively. Pleural invasion was present in 13 cases (6.9%). Nodal metastasis was present in 11 cases (5.9%).
Proportion of invasive patterns and distribution of aT stage
In all 188 patients, the mean proportion of invasive patterns was 21.4% (pattern 2, 13.0%; pattern 3, 8.4%), and the mean size of invasive patterns was 1.3 cm (median, 0.4 cm; range, 0.0 to 14.0 cm). In 49 cases (26.1%), the tumors were exclusively composed of non-invasive patterns (lepidic and pattern 1), and nine had a central scar. Among 49 non-invasive cases, nine showed a purely lepidic pattern, and 40 showed a mixture of lepidic and pattern 1. The proportion of invasive patterns increased in correlation with increased tumor size. The mean proportion of invasive pattern was 8.4% (pattern 2, 5.9%; pattern 3, 2.5%) in small (≤3 cm) tumors, 34.3% (pattern 2, 21.2%; pattern 3, 13.1%) in intermediate-sized (>3 cm and ≤ 7 cm) tumors, and 50.1% (pattern 2, 27.0%; pattern 3, 23.1%) in large (>7 cm) tumors. Accordingly, as shown in Table 1, 57 of 61 T1a cases (93.4%) and 29 of 42 T1b cases (69.0%) were adjusted to aTis/1mi, whereas only two of 18 T3/4 cases (11.1%) were adjusted to aTis/1mi. In other words, the 112 cases of aTis/1mi were generally small (≤3 cm, T1) tumors (86 cases, 76.8%), although intermediate-sized (>3 cm and ≤7 cm, T2) tumors (24 cases, 21.4%), and even large (>7 cm, T3) tumors (two cases, 1.8%) were also observed.
Correlation of clinicopathologic features with aT stage and predominant invasive pattern
Clinicopathologic features according to aT stage are summarized in Table 1. Advanced aT stage was significantly associated with older age, male sex, and ever smokers (p=.004, p=.003, and p<.001, respectively). Tumors with advanced aT stage had significantly more nuclear atypia, micropapillary pattern, AS, vascular invasion, necrosis, neutrophils, nodal metastasis, and KRAS mutation (all p<.001, except for KRAS mutation p=.014). Significant associations between T stage and clinicopathologic features were similarly noted, with the exception of age (p=.101). To further evaluate the clinicopathologic relevance of a predominant invasive pattern, 85 cases with ≥10% invasive patterns were separated into two groups according to the predominant invasive pattern: 59 pattern 2 predominant tumors (69.4%) and 26 pattern 3 predominant tumors (30.6%). Among clinical and pathologic factors, only micropapillary pattern and AS were significantly prevalent in pattern 3 predominant tumors (both p<.001). The two groups showed no significant difference in DFS and extrathoracic recurrence-free survival, when they were compared in matched aT stage (data not shown).
KRAS and EGFR mutation
KRAS mutations were detected in 25 of 59 cases tested (42.4%). Most mutations were found in codon 12, with one case each of codon 13 (G13D) and codon 61 (Q61H) mutation. Among 23 cases of codon 12 mutations, the G12V mutation was most common (11 cases), followed by G12D (seven cases), G12C (four cases), and G12A (one case). KRAS mutation was significantly less prevalent in low aT stage (25.8%, 75.0%, and 55.0% in aT0/1mi, aT1a/b, and aT2a/b, respectively; p=.014). KRAS mutations showed no significant association with clinical factors including age, sex, and smoking status (all p>.5). Among histologic factors, only neutrophil accumulation was significantly associated with KRAS mutations (p=.015). EGFR mutation was detected in one of 68 cases tested; the single case was a male smoker with an exon 19 deletion, an invasive pattern greater than 5 mm, and recurrent disease. None of the cases showed concomitant KRAS and EGFR mutations.
Prognostic impact of invasion size
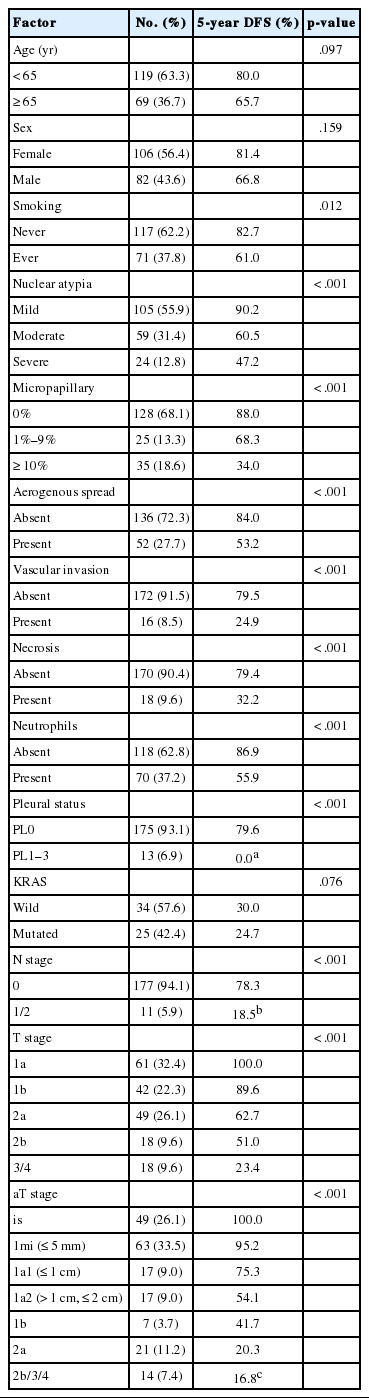
Thirty-six patients (19.1%) had recurrence or died of disease during follow-up. Extrathoracic recurrence was present in 11 patients (5.9%). None of the 16 patients who underwent sublobar resection experienced recurrence; all had small (≤2 cm) tumors, with 8 mm invasion in one case, ≤5 mm invasion in three cases, and no invasion in 12 cases. The median follow-up for patients without recurrence was 43.5 months (range, 0.5 to 184 months). DFS at 5 years for all 188 patients was 75.6%.
As shown in Table 2 and Fig. 3, DFS was significantly associated with T stage (overall p<.001). Patients with small tumors (≤2 cm, T1a) had 5-year DFS of 100%. Patients with T1b, T2a, T2b, and T3/4 tumors had a 5-year DFS of 89.6%, 62.7%, 51.0%, and 23.4%, respectively. DFS was also significantly associated with aT stage (overall p<.001). Forty-nine cases without invasion (aTis), including nine cases of pure lepidic growth, had no recurrence. In 63 cases with minimal invasion (≤5 mm invasion, aT1mi), 5-year DFS was 95.2%. Of these, tumor size was greater than 3 cm in 23 cases, and two of these cases experienced recurrence. These two cases were grossly 3.5-cm- and 4.5-cm-sized tumors, with 5 mm invasion for both. One case had minute (≤5%) micropapillary pattern foci, and both cases had no other adverse histologic features. Recurrence was not observed in 40 aT1mi cases with ≤3 cm, including five cases with AS, all of which were of lepidic type. Patients with aT1a1, aT1a2, aT1b, aT2a, and aT2b/3/4 stage had 5-year DFS of 75.3%, 54.1%, 41.7%, 20.3%, and 16.8% at 2.7 years, respectively.
Correlation of clinicopathologic variables with DFS
Disease-free survival according to T stage (A) and adjusted T stage (B). aTis, no invasion; aT1mi, minimal (≤5 mm) invasion; aT1a1, ≥ 5 mm, ≤1 cm invasion; aT1a2, ≥1 cm, ≤2 cm invasion; aT1b, ≥2 cm, ≤3 cm invasion; aT2a, ≥3 cm, ≤5 cm invasion or visceral pleural invasion (PL1–2); aT2b, ≥5 cm, ≤7 cm invasion; aT3, ≥7 cm invasion or satellite tumor nodule in the same lobe or parietal pleural invasion (PL3); aT4, satellite tumor nodule in a different ipsilateral lobe.
aT stage was also a T stage–independent predictor of recurrence when patient survival within the separate T stage subgroups was assessed according to aT stage (Fig. 4). In the T1b subgroup, a significant difference in survival was observed between aTis/1mi group and aT1a/b group (5-year DFS, 100% and 68.6% for aTis/1mi [n=29] and aT1a/b [n=13], respectively; p=.008). In the T2a subgroup, survival was also significantly stratified by aT stage (5-year DFS, 86.1%, 54.0%, and 0% at 3.9 years for aTis/1mi [n=21], aT1a/b [n=18] and aT2a/b [n=10], respectively; p=.002). In the T2b subgroup, cases with advanced aT stage had a tendency for worse survival (5-year DFS, 100%, 60.0%, and 25.9% for aT0/1mi [n=3], aT1a/b [n=5], and aT2a/b [n=10], respectively; p=0.071). Conversely, survival within the separate aT stage was not relevant to T stage (Fig. 5).
Disease-free survival in separate T stage subgroups according to the adjusted T stage (A, C, E) and grouped adjusted T stage (B, D, F). (A, B) T1b subgroups (n=42). (C, D) T2a subgroups (n=49). (E, F) T2b subgroups (n=18). aTis, no invasion; aT1mi, minimal (≤5 mm) invasion; aT1a1, >5 mm, ≤1 cm invasion; aT1a2, >1 cm, ≤2 cm invasion; aT1b, >2 cm, ≤3 cm invasion; aT2a, >3 cm, ≤5 cm invasion with or without visceral pleural invasion (PL1-2); aT2a-PL*, ≤3 cm invasion but with visceral pleural invasion (PL1-2); aT2b, >5 cm, ≤7 cm invasion.
Disease-free survival in separate adjusted T stage subgroups according to the T stage (A, C) and grouped T stage (B, D). (A, B) aT1a subgroups (n=34). (C, D) aT2a subgroups (n=21). aT1a, >5 mm, ≤2 cm invasion; aT2a, >3 cm, ≤5 cm invasion or visceral pleural invasion (PL1–2).
Univariate analyses of clinicopathologic variables are summarized in Table 2. Smokers had significantly worse DFS (p=.012). Patients with older age and male sex had worse DFS, although this was not statistically significant (p=.097 and p=.159, respectively). KRAS mutation showed no significant associations with survival (p=.076). Nuclear atypia, micropapillary pattern, AS, vascular invasion, and intra-alveolar neutrophils were all associated with worse DFS (all p<.001). Pleural invasion and nodal metastasis were also associated with worse DFS (both p<.001).
In multivariate analysis (Table 3), invasion size retained a significant association with DFS (hazard ratio [HR], 5.57; 95% confidence interval [CI], 1.39 to 22.39; p=.015 for ≤5 mm vs. >5 mm, ≤3 cm and HR, 10.21; 95% CI, 1.95 to 53.59; p=.006 for ≤5 mm vs. >3 cm). Total size was also associated with survival, but to a lesser degree (HR, 2.37; 95% CI, 0.80 to 7.05; p=.121 for ≤ 3 cm vs. >3 cm, ≤ 7 cm and HR, 5.36; 95% CI, 1.07 to 26.81; p=.041 for ≤3 cm vs. >7 cm). Among other factors, pleural invasion (HR, 9.24; p<.001) and vascular invasion (HR, 2.87; p=.048) remained significant predictors of recurrence.
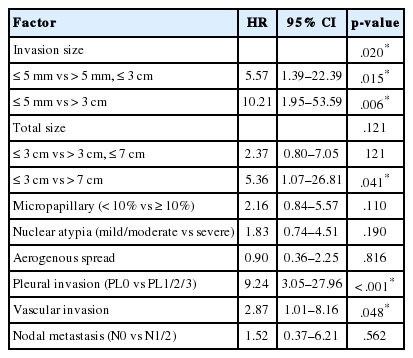
Multivariate analysis for disease-free survival
DISCUSSION
In our largest series of pulmonary mucinous adenocarcinomas to date, we have shown that the prognosis of mucinous adenocarcinoma is largely determined by the size of invasive patterns. Although conventional tumor staging by total size was associated with prognosis, tumors within the separate T stage subgroups showed heterogeneous proportions of invasive growth patterns, which were correlated with patient outcome. Our results indicate that the size of invasive patterns may have greater prognostic impact than gross size in mucinous adenocarcinomas.
We also demonstrated that advanced aT stage and T stage tumors were significantly associated with adverse histologic features and clinical features including older age, male sex, and smoking. Notably, low-stage tumors in our cohort had a significantly lower rate of KRAS mutation, whereas intermediate-and high-stage tumors showed a mutation rate comparable to that in previous studies [4,24,25]. This unexpectedly low rate of KRAS mutation in low-stage, non-invasive mucinous adenocarcinomas was first described by Sato et al. [26]. However, others with a larger number of cases have shown that KRAS mutation status is irrelevant to stage [4,24]. Future studies with data on genetic background in low-stage tumors are needed to support either concept.
In previous studies, mucinous adenocarcinoma accounted for 2%–5% of resected lung adenocarcinomas, which was comparable to 4.6% in our cohort [7-10,27]. The true prognosis of mucinous adenocarcinomas is puzzling, and they are often regarded as aggressive, multicentric, unresectable tumors with dismal prognosis [28]. For resectable cases, however, the most recent study by Shim et al. [4] of 83 mucinous adenocarcinomas based on a Korean and American population showed that recurrence-free survival was not inferior to that of non-mucinous tumors. In addition, absence of extrapulmonary recurrence was documented in their study. Ichinokawa et al. [27] also reported that 46 adenocarcinomas predominantly composed of goblet cells had 95.7% 5-year DFS and absence of nodal metastasis, although they might have excluded cases showing substantial stromal invasion, which generally have altered cytomorphologic features, since an inclusion criterion of ≥90% goblet cell component was employed in their study. Oka et al. [29] reported that, in their series of 13 mucinous adenocarcinomas, eight patients with tumors ≤3 cm had no recurrence. Our data showed results consistent with those from the abovementioned studies in that lymph node metastasis and extrathoracic recurrence rarely occurred in mucinous adenocarcinoma, and small tumors generally showed excellent prognosis. Several studies validating the prognostic impact of the 2011 IASLC/ATS/ERS classification also included cases of mucinous adenocarcinomas. However, due to the rarity of this tumor, only limited numbers were enrolled, and these studies yielded conflicting results [7-10]. We think the limited number of mucinous adenocarcinomas which lack representativeness might have resulted in the varied results observed in these studies. Furthermore, we think it may be misleading to generalize the prognosis of mucinous adenocarcinomas by comparing them as a whole with other non-mucinous adenocarcinomas showing different architectural patterns, since this could disregard the importance of different stages and invasive growth patterns within mucinous adenocarcinoma, which have significant prognostic impact.
Our study is the first to describe the prevalence, prognostic impact, and the criteria of invasive patterns in mucinous adenocarcinoma. Histologic criteria for invasion in lung adenocarcinomas have evolved for over a decade [13,14,30]. However, no study has yet focused on invasion criteria for mucinous adenocarcinoma. In a review of the literature, the presence of a central scar [27] or back-to-back glands [31] was regarded as a feature of invasion. Interestingly, some pathologists seem to interpret a mucinous lepidic pattern itself as invasion based on the assumption that there will be an invasion in the other area of tumor [32]. According to our data, we believe it is reasonable not to interpret lepidic pattern, or nondistorted acini (pattern 1)—even when they are compactly arranged or embedded in a central scar—as an invasive pattern, since these acini can also represent pre-existing alveolar spaces lined by tumor cells, which are still, by definition, a lepidic pattern. Furthermore, none of the cases exclusively composed of pattern 1 and lepidic pattern showed recurrence, and adjustment for tumor stage by subtracting these components has led to more precise prediction of patient outcomes. Thus, we suggest that pattern 1 is a morphologic spectrum of the lepidic pattern, or at least a pattern that is related to indolent biologic behavior as a lepidic pattern. On the other hand, by using the invasion criteria proposed in this study, as many as 81 of 188 cases in our cohort (43.1%) would be categorized as “adenocarcinoma in situ” or “minimally invasive adenocarcinoma” according to the current WHO classification criteria, showing ≤3-cm tumors with ≤5-mm invasion and no other adverse histologic features such as AS [2]. Although this incidence is surprisingly high, none of the cases presented with recurrence, showing that these conceptual diagnostic categories are still valid when our invasion criteria are used.
Our results represent a Korean population from a single institution, and our findings need to be confirmed in further studies with a sufficient number of cases representing other ethnicities. Furthermore, histologic criteria applied in the present study may exhibit interobserver variability, similar to growth pattern analysis for conventional adenocarcinomas [32,33]. Through our histologic review, distinguishing destroyed alveolar spaces from distended alveolar spaces and intra-alveolar proliferation from a lepidic pattern with mild serration was often difficult.
In summary, we showed that the size of invasive patterns determined using the histologic criteria proposed in this study predicts recurrence in pulmonary mucinous adenocarcinomas. Risk stratification relying solely on total size may have pitfalls, since tumors show diverse outcomes that are dependent on the size of the invasive pattern. We expect our data to provide guidance regarding the treatment of this distinct variant of lung adenocarcinoma.
Notes
Conflicts of Interest
No potential conflict of interest relevant to this article was reported.