A demographic study of pathology-proven kidney tumors at a single institution in South Korea over the past 33 years: 1991–2023
Article information

Abstract
Background
While the incidence of kidney tumors is increasing, long-term demographic analyses based on pathological diagnoses remain insufficient. This study aimed to investigate demographic changes regarding pathology-proven kidney tumors over the past 33 years.
Methods
We retrospectively analyzed 4,555 cases from 4,350 patients who underwent renal biopsy or nephrectomy for suspected kidney tumors at Seoul St. Mary’s Hospital from 1991 to 2023.
Results
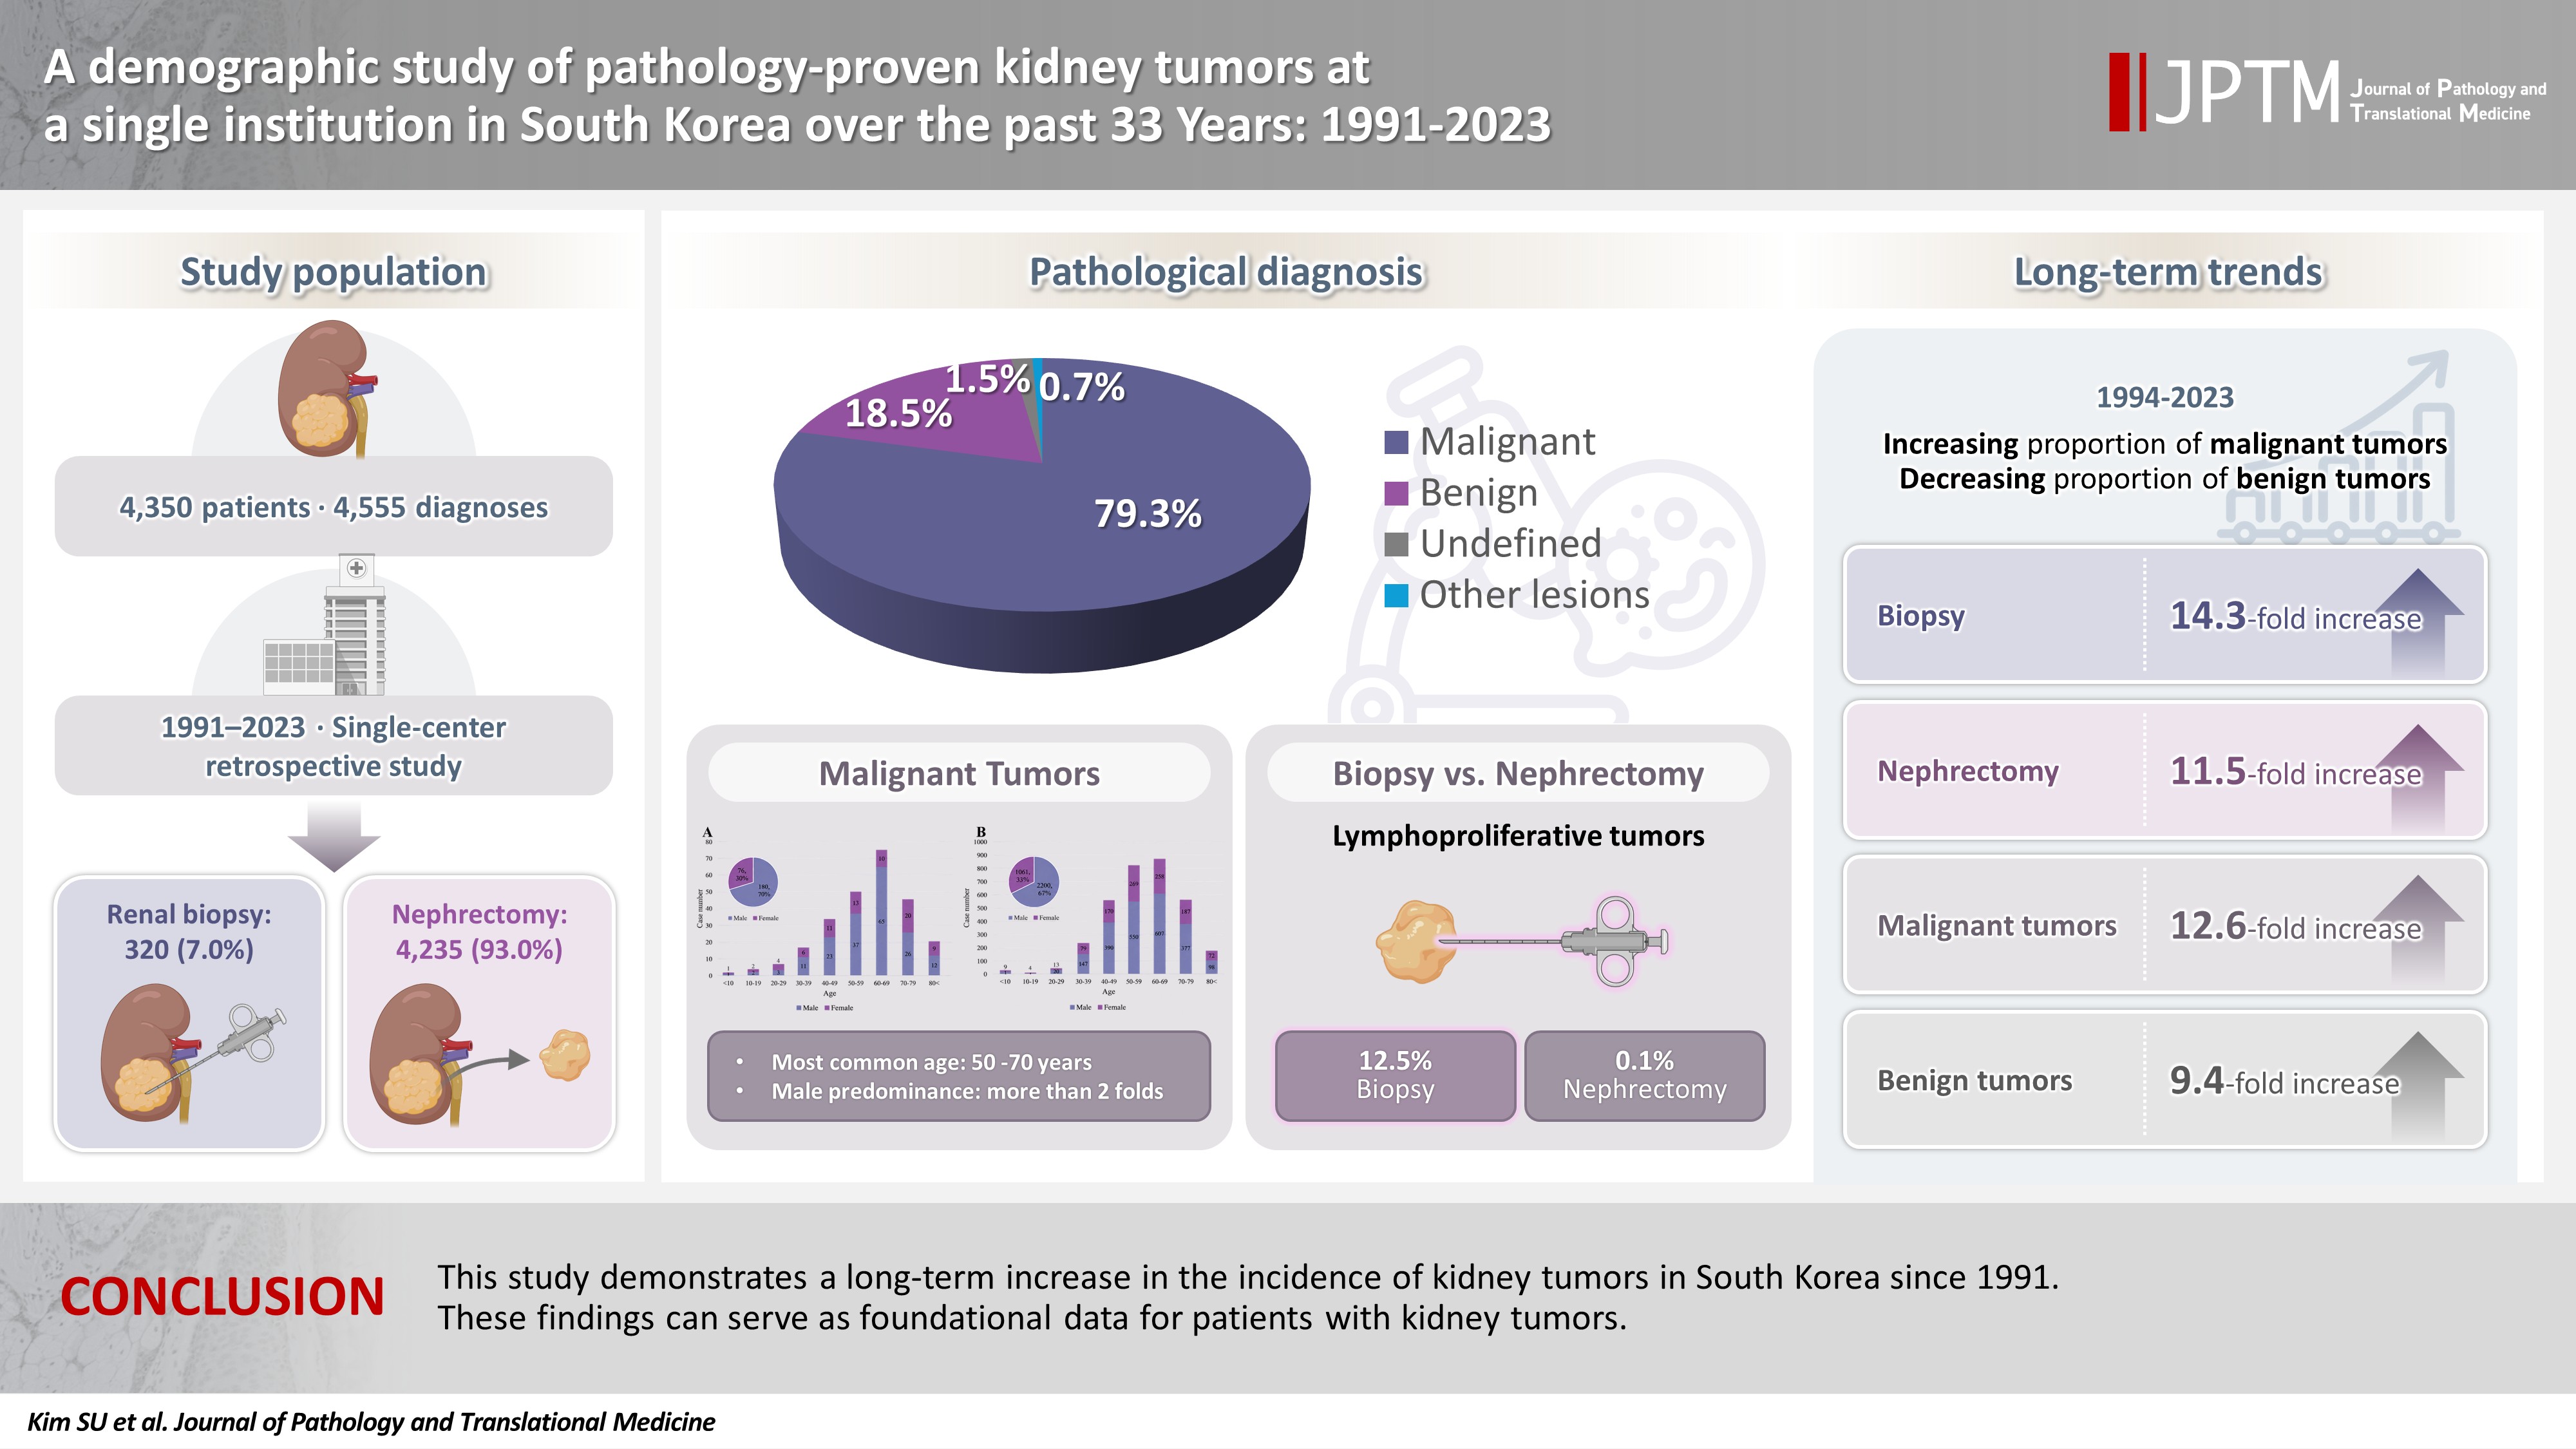
The average age was 58 years, and the male-to-female ratio was 1.7:1. Among 4,555 cases, 7.0% were biopsies and 93.0% were nephrectomies. Tumors were classified into four diagnostic categories: malignant (79.3%), benign (18.5%), undefined (1.5%), and other lesions (0.7%). Over 33 years, biopsies increased 14.3-fold and nephrectomies 11.5-fold, while malignant tumors increased 12.6-fold and benign tumors 9.4-fold. Over time, the proportion of malignant tumors increased (p < .001), while benign tumors decreased (p < .001). As age increased, the proportion of malignant tumors increased (p = .013), while benign tumors showed a decreasing trend (p = .070). Malignant tumors showed a male predominance, while benign tumors showed a female predominance. The frequency of malignant tumors was similar at approximately 80% in biopsy and nephrectomy. However, benign tumors were more common in nephrectomy (19.1%) than in biopsy (10.9%) (p < .001), and unclassified tumors (4.1%) were more common in biopsies (p < .001). Renal cell carcinoma was most common (61.5% of total cases, 77.6% of malignant tumors). Lymphoproliferative tumors were diagnosed more frequently by biopsy (12.5%) than nephrectomy (0.1%) (p < .001).
Conclusions
This study demonstrates a long-term increase in the incidence of renal tumors in South Korea. These findings can serve as foundational data for patients with kidney tumors.
INTRODUCTION
Kidney cancer accounts for approximately 2% of all cancer diagnoses worldwide, and its incidence has more than doubled over the past half-century, particularly in developed countries [1-5]. According to an analysis by the American Cancer Society in 2025, approximately 80,980 new cases of kidney cancer were diagnosed in the United States, and it is estimated that 14,510 people will die from the disease. Kidney cancer is expected to account for 5% of all cancers in men and 3% in women [3]. Additionally, according to the Annual Report of Cancer Statistics in Korea in 2023, the number of new cases of kidney cancer was 7,367, and the crude incidence rate was 14.4 per 100,000 people. Among 288,613 total cancer cases, kidney cancer ranked 10th in incidence. It accounted for 3.4% of cancers in men and 1.7% in women [2]. Most kidney cancers are renal cell carcinoma (RCC), and the incidence rate is about twice as high in men as in women [3,5,6].
The long-term increase in the diagnosis of kidney cancer is partly attributed to the detection of early-stage asymptomatic tumors due to the increased use of medical imaging technologies [1,3,4,6-8], but the primary reason is reported to be the increase in partial nephrectomy for localized tumors [4,9]. In contrast to the incidence rate, the mortality rate of kidney cancer has shown a downward trend since the early 2000s and decreased by 1.5% annually from 2013 to 2022 [1,3,5,6]. In addition, in several population-based studies, the 5-year survival rate for kidney cancer increased from about 56% in the 1980s to over 70% in the 2000s [3,4,10]. Although demographic studies on kidney tumors have been reported domestically and internationally, demographic studies examining all pathology-proven kidney tumors over an extended period are uncommon [11,12]. Since the statistics from Korea’s National Cancer Registry provide only basic data by cancer type, there are limitations in understanding the pathologic subtypes of kidney tumors or changes in pathological diagnoses over time [12].
This study aimed to conduct a long-term demographic analysis of patients who underwent histopathological examination due to clinical suspicion of a kidney tumor. We conducted a retrospective analysis of 4,555 cases of pathology-proven kidney tumors at Seoul St. Mary’s Hospital, one of the leading large hospitals in South Korea, over a 33-year period from 1991 to 2023. To provide baseline data on pathology-proven kidney tumors at a single medical institution in Korea, we analyzed the pathological diagnosis, incidence, age and sex distribution, as well as changes in the frequency of diagnostic categories according to specimen type, age, and time.
MATERIALS AND METHODS
Patient selection
We conducted a retrospective study of 4,555 cases from patients who underwent renal biopsy or nephrectomy for clinically suspected kidney tumors at Seoul St. Mary’s Hospital between January 1991 and December 2023. The total number of patients was 4,350, and in 180 of them, histopathological examination was performed repeatedly from 2 to 4 times. To evaluate long-term demographic and pathologic diagnosis, we reviewed the clinical records and pathology reports of all cases. Cases with incomplete clinical data, inadequate tissue specimens, or those limited to frozen section evaluation were excluded from the analysis.
Data source
We included both renal biopsy and nephrectomy cases to comprehensively analyze kidney tumors. Data were collected on specimen type (biopsy or nephrectomy), patient age, sex, date of procedure, and histopathological diagnosis. A total of 320 diagnoses were obtained from 318 patients who underwent renal biopsy, and 4,235 diagnoses were obtained from 4,032 patients who underwent nephrectomy. Each diagnosis was considered independently; in cases where multiple pathological diagnoses were identified in a single specimen, each was counted separately. The pathological diagnoses of kidney tumors were classified into specific entities and subtypes based on the World Health Organization (WHO) Classification of Tumours (1st–5th editions) [13-17], and previously established diagnoses were not re-reviewed or reclassified. Kidney tumors were arbitrarily grouped into four diagnostic categories according to pathological diagnosis: malignant tumor, benign tumor, undefined tumor (lesions considered neoplastic but difficult to classify precisely), and other lesions (those not falling into the aforementioned categories). Malignant tumors were divided into epithelial (RCC, urothelial/squamous/adenocarcinoma, neuroendocrine), stromal cell/mixed, embryonal, lymphoproliferative and metastatic; and benign tumors were divided into epithelial, stromal cell/mixed, embryonal, and cystic. The frequency and distribution of all kidney tumor diagnoses were analyzed, and associations with patient age, sex, disease category, and temporal trends were evaluated. To examine trends over time, they were analyzed over three consecutive 10-year periods (1994–2003, 2004–2013, and 2014–2023), after excluding 30 nephrectomies performed before 1994. To investigate the correlation between age and diagnostic categories of the kidney tumors, patients were classified into five age groups (<20, 20–39, 40–59, 60–79, and ≥80).
Statistical analysis
Statistical analysis of the data was performed using R v.4.4.2 (R Foundation for Statistical Computing, Vienna, Austria). The normality and homogeneity of variance assumptions were assessed with the Shapiro-Wilk and Bartlett tests, respectively. Continuous variables were presented as mean ± standard deviation and compared using ANOVA or the Kruskal-Wallis test. If significant differences were observed, post-hoc analyses were performed using Tukey's honest significant difference test or Dunn’s test with Bonferroni correction. Categorical variables were expressed as frequencies (%) and compared using the chi-square test. Post-hoc analyses with Bonferroni correction were applied for pairwise comparison of proportions between specific groups. Logistic regression analysis was used to evaluate trends in disease prevalence over time. The statistical significance level was set at p < .05.
RESULTS
Demographics of kidney tumors
A total of 4,555 diagnoses were made in 4,350 patients who underwent pathological evaluation for suspected kidney tumors between 1991 and 2023. Of these, 320 cases (7.0%) were biopsy specimens and 4,235 cases (93.0%) were nephrectomy specimens. The average age of all patients was 58 years, of which 2,749 were male and 1,601 were female, with 1.7 times more males than females. The proportion of males was higher than that of females among all patients, which was observed in both biopsy cases (2.0 times) and nephrectomy cases (1.7 times). However, no statistical significance was observed in age and sex ratio between biopsy and nephrectomy cases (Table 1). The age distribution of patients with kidney tumors increased sharply after the 30s, showing the highest incidence in the 60s, and decreased after the 70s (Fig. 1).
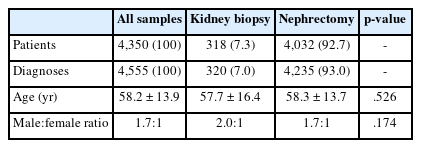
Demographic data for 4,350 patients with kidney tumors confirmed by renal biopsy or nephrectomy
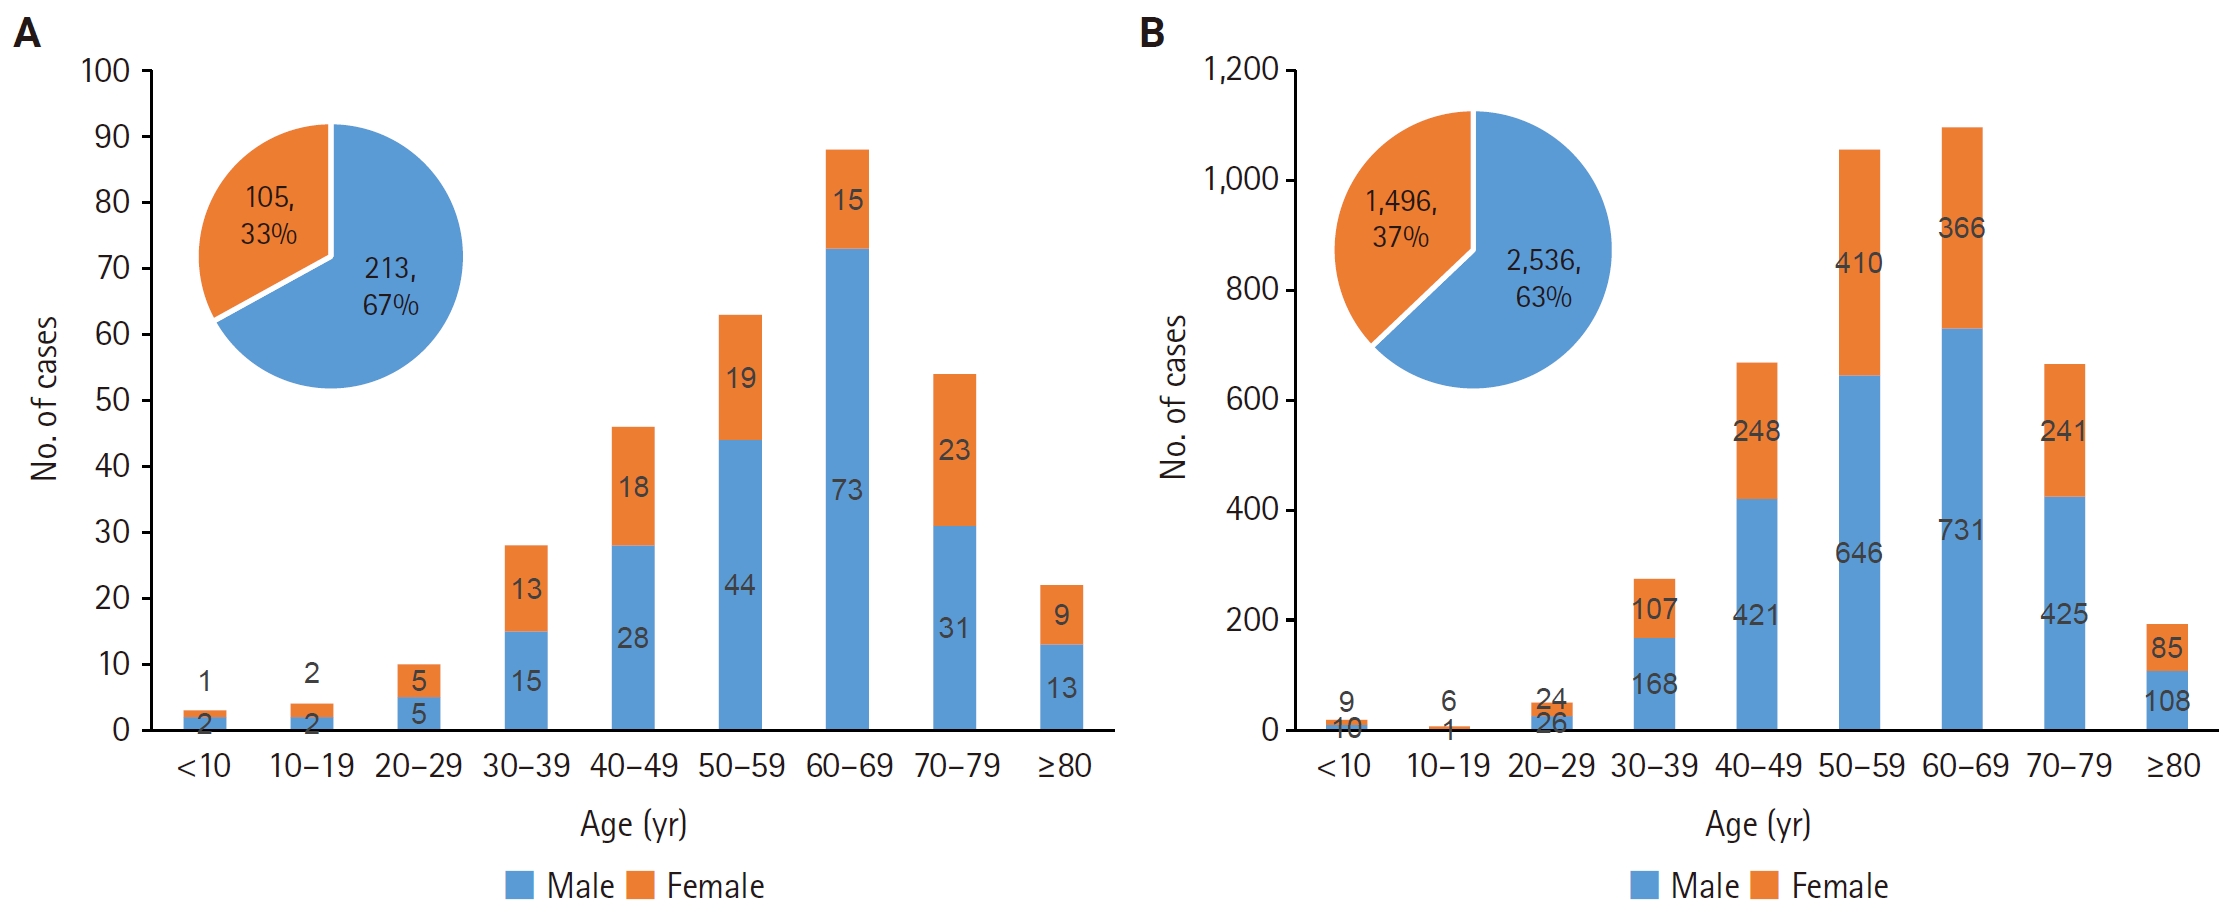
Age and sex distribution of 318 patients who underwent renal biopsy (A) for kidney tumors and 4,032 patients who underwent nephrectomy (B).
Categories of kidney tumors
Classification of kidney tumors according to pathological diagnostic categories can be found in Table 2. Among all kidney tumors, there were 3,610 cases of malignant tumors (79.3%), 842 cases of benign tumors (18.5%), 69 cases of undefined tumors (1.5%), and 34 cases of other lesions (0.7%). When comparing biopsy cases and nephrectomy cases, malignant tumors accounted for approximately 80% in both cases, with no difference in diagnostic frequency (p = .680). On the other hand, for benign tumors, the diagnostic frequency was higher in nephrectomy cases (19.1%) compared to renal biopsy (10.9%) (p < .001), while for undefined tumors (p < .001) and other lesions (p < .001), the diagnostic frequency was higher in biopsy (4.1%, 4.7%) compared to nephrectomy (1.3%, 0.4%).
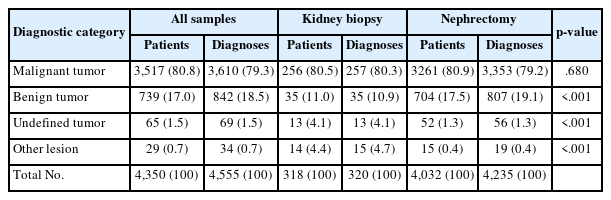
Diagnostic categories for a total of 4,555 pathologically confirmed renal tumors in 4,350 patients
Temporal trends of kidney tumors
Decadal changes of kidney tumors
The number of biopsies performed for the diagnosis of kidney tumors increased 4.6-fold from 1994–2003 (16 cases) to 2004–2013 (73 cases), and increased 14.3-fold to 2014–2023 (229 cases) (Fig. 2A). The number of nephrectomy cases also increased over time during the same period, from 263 cases to 708 cases (2.7-fold), and to 3,031 cases (11.5-fold) (Fig. 2B).
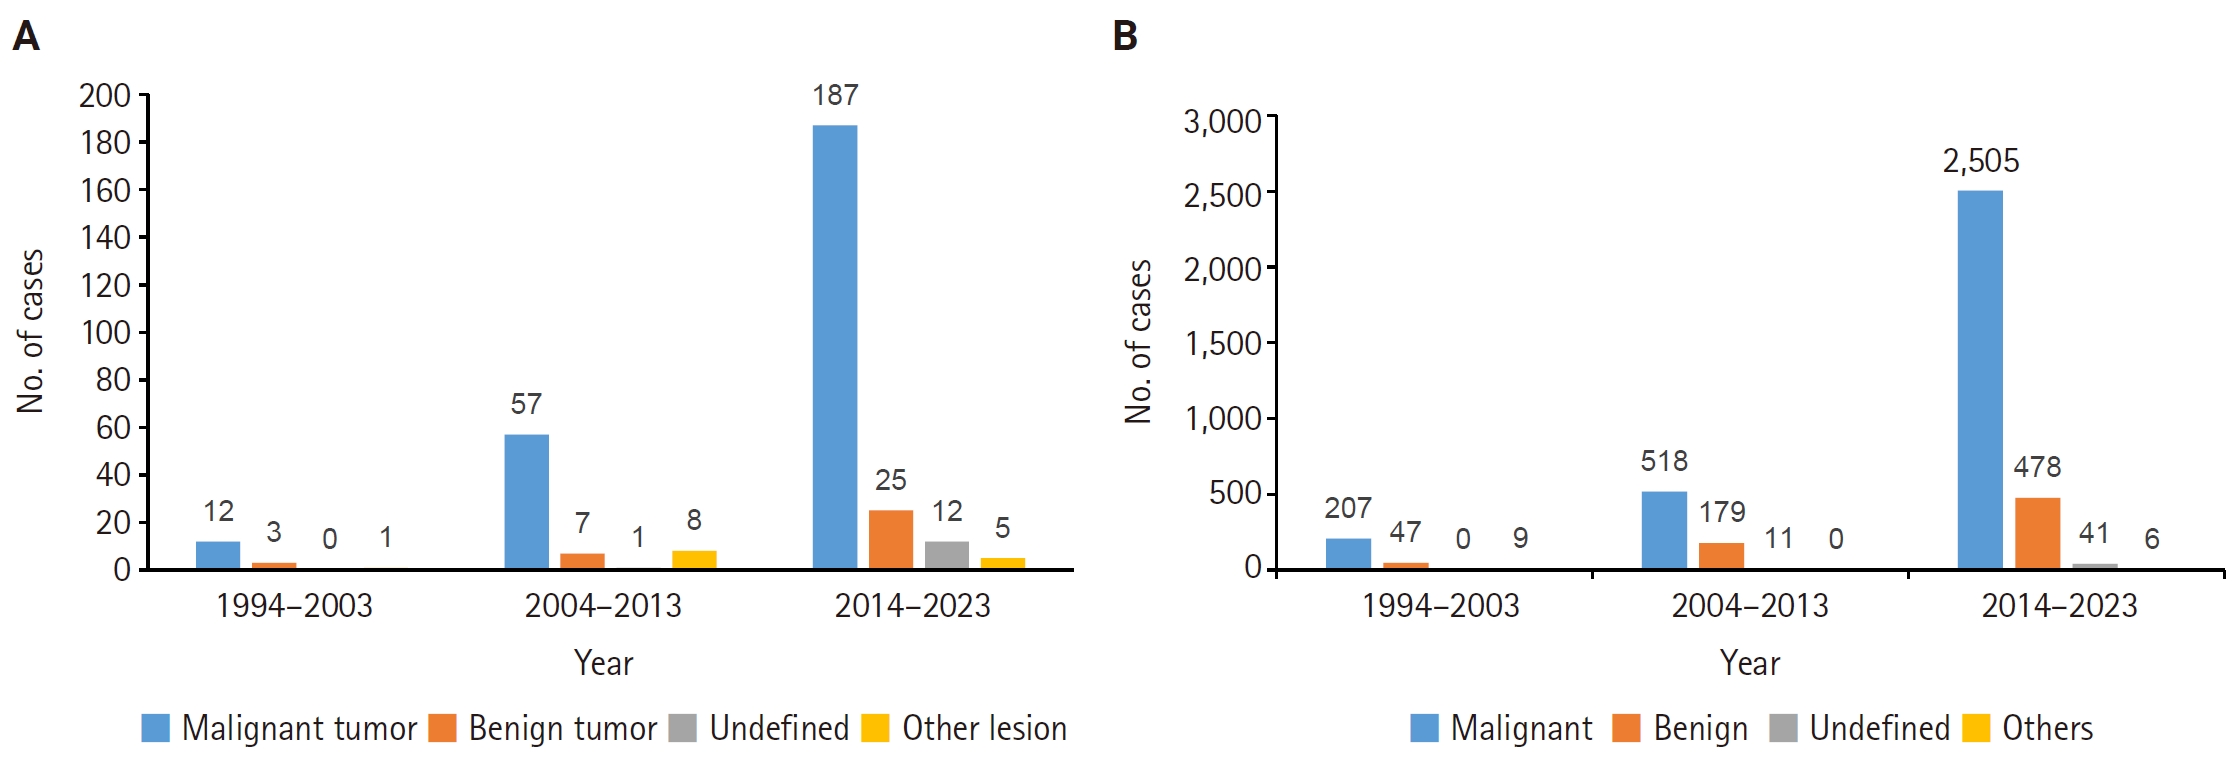
Decadal changes in the number of 318 renal biopsies (A) and 4,002 nephrectomies (B) performed for kidney tumors. They were analyzed over three consecutive 10-year periods (1994–2003, 2004–2013, and 2014–2023). (A) In biopsy cases, the temporal distribution of diagnostic categories was similar. There were no significant differences in temporal variation among malignant, benign, and undefined tumors. (B) In nephrectomy cases, significant differences in temporal distribution were observed; as time increased, the proportion of malignant tumors increased (p < .001), while that of benign tumors decreased (p < .001).
Decadal changes of kidney tumors classified by tumor categories
The distribution of diagnostic categories over time was statistically significant (p < .001). Logistic regression analysis showed that the proportion of malignant tumors increased over time (p < .001), while the proportion of benign tumors decreased (p < .001). Malignant tumors increased 12.6-fold from 228 cases in 1994–2003 to 2,881 cases in 2014–2023. Similarly, benign tumors also increased 9.4-fold over the same period, from 56 to 527 cases. In biopsy cases, the distribution of malignant, benign, and undefined categories was similar across time. There were no significant temporal changes in the proportions of malignant (p = .760), benign (p = .609), or undefined tumors (p = .079) (Fig. 2A). In contrast, nephrectomy cases showed a significant difference in distribution over time. The proportion of malignant tumors increased with time (p < .001), while the proportion of benign tumors decreased (p < .001). Additionally, while the Undefined category showed no significant change over time (p = .120), the other lesions category decreased significantly over time (p < .001) (Fig. 2B).
Decadal changes of surgical procedures
The number of surgeries varied significantly over time according to surgical procedures (p < .001).
The total number of surgeries increased 2.7-fold from the 1994–2003 period (263 cases) to the 2004–2013 period (708 cases), and 11.5-fold by the 2014–2023 period (3,031 cases). The proportion of excision/partial nephrectomies increased consistently, accounting for 15.6% (41/263) in 1994–2003, 41.1% (291/708) in 2004–2013, and 61.0% (1,850/3,031) in 2014–2023. On the other hand, the proportion of simple/total/radical nephrectomies decreased steadily during the same period from 84.4% (222/263) to 58.9% (417/708), and further to 39.0% (1,181/3,031).
Differences in diagnostic categories of kidney tumors by age group
Significant differences were observed in the mean age between diagnostic categories (p = .044), and the frequency by age group also showed differences according to age group (p = .031). Logistic regression analysis revealed that as age increased, the proportion of malignant tumors increased (p = .013), while the proportion of benign tumors showed a decreasing trend (p = .070). In biopsy cases, the proportion of malignant tumors increased sharply with age after 20, rising from 63.2% in the 20–39 age group to 95.5% in the ≥80 age group. Conversely, the proportion of benign tumors was highest in the 20–39 age group (31.6%), followed by the 40–59 age group (13.8%), the 60–79 age group (5.6%), and the ≥80 age group (0%) (Fig. 3A). Significant differences in mean age were observed between diagnostic categories (p = .002), and the average age of the malignant group was 10.6 years higher than that of the benign group (p = .002). Analysis by age group also revealed significant differences in the distribution of diagnostic categories (p = .002). With increasing age, the proportion of malignant tumors significantly increased (p = .003), while the proportion of benign tumors significantly decreased (p < .001). No significant association with age was observed for undefined tumors or other lesions. In nephrectomy cases, there was no significant difference in mean age between diagnostic categories (p = .080), and in the logistic regression analysis, there was no significant association with age in most diagnostic categories (Fig. 3B).
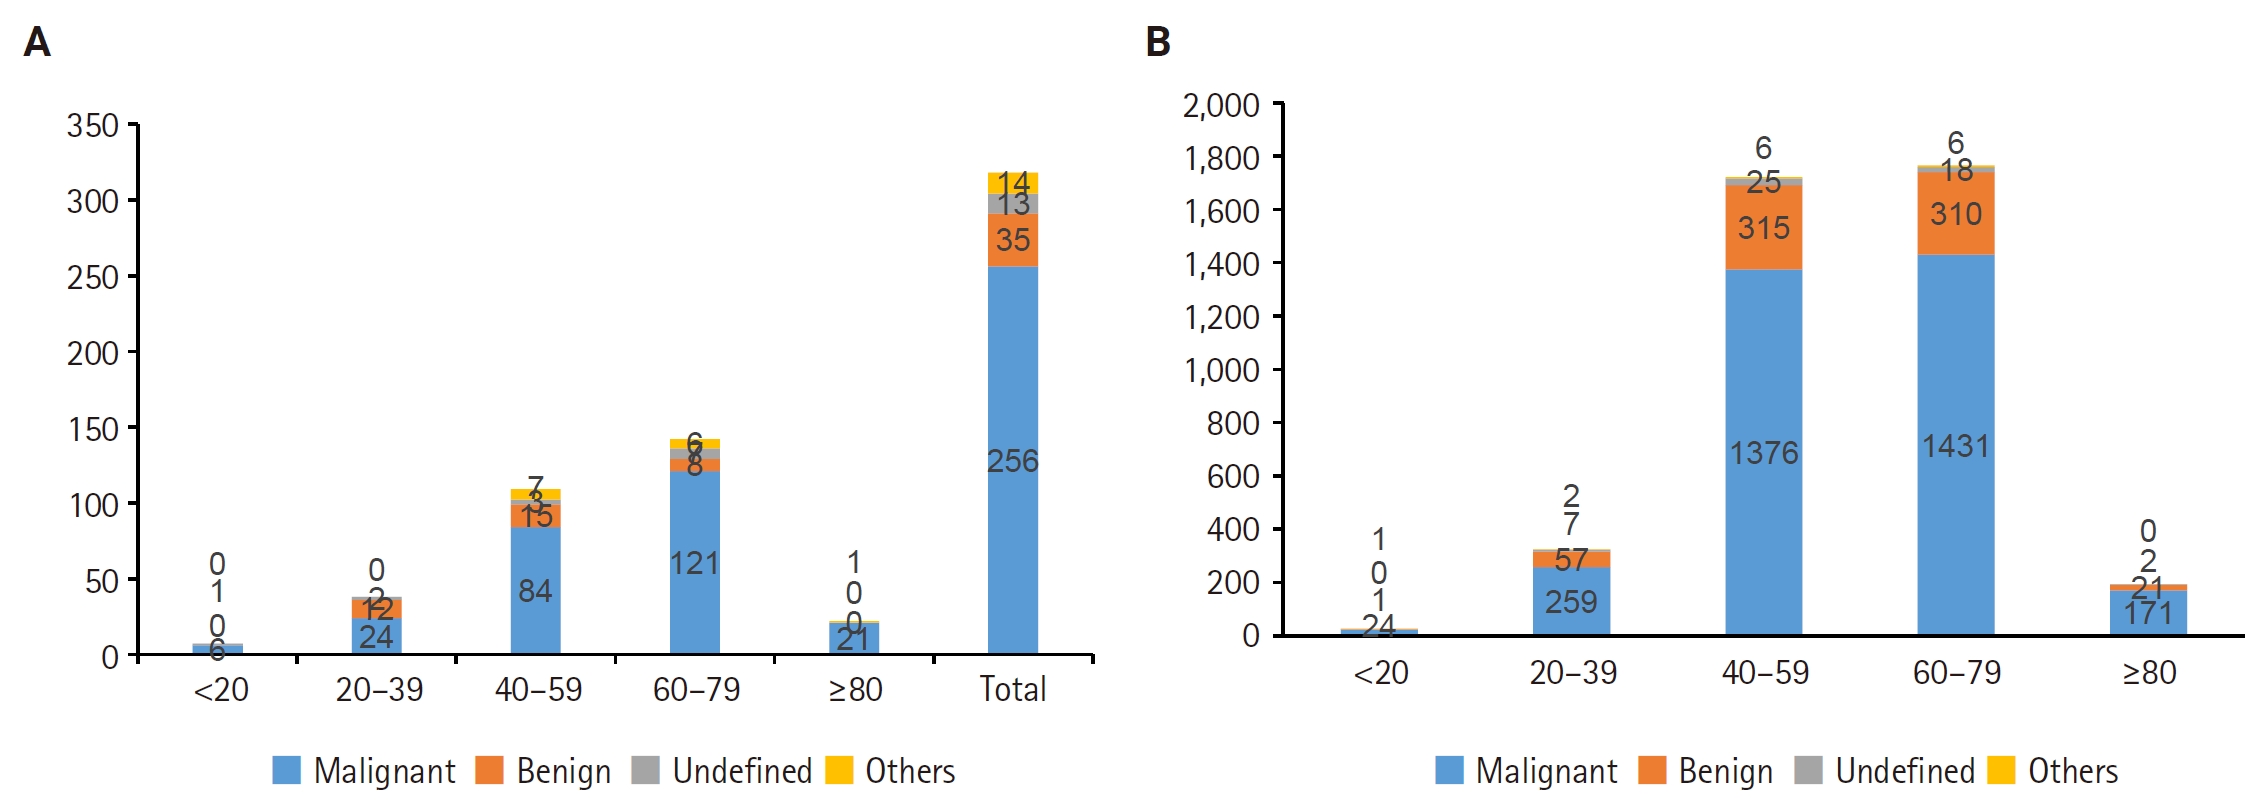
Distribution of kidney tumor diagnostic categories across five age groups in 318 renal biopsy cases (A) and 4,032 nephrectomy cases (B). Cases were stratified into five age groups: <20, 20–39, 40–59, 60–79, and ≥80 years. (A) In renal biopsy cases, the proportion of malignant tumors increased with age among patients aged 20 years or older, reaching 95.5% in the ≥80-year age group. Conversely, the proportion of benign tumors was highest in the 20–39-year age group (31.6%) and decreased thereafter. The mean age of patients with malignant tumors was 10.6 years higher than that of patients with benign tumors (p = .002). (B) In nephrectomy cases, mean age did not differ significantly among diagnostic categories (p = .080).
Demographics and pathologic diagnostic entities of malignant kidney tumors
Among 3,517 patients diagnosed with malignant tumors of the kidney, the age distribution increased starting in the 40s, peaked in the 60s, and decreased after age 70. The male-to-female ratio was observed to be more than twice as high in both patients who underwent biopsy (2.4 times) and nephrectomy (2.1 times) (Fig. 4). Among 257 malignant tumors diagnosed by renal biopsy, RCC was the most common (n = 151, 58.8%), followed by urothelial/squamous/adenocarcinoma (n = 43, 16.7%), lymphoproliferative tumors (n = 32, 12.5%), and metastatic tumors (n = 21, 8.2%) (Table 3). A distinct difference was observed in the diagnostic spectrum of malignant kidney tumors between biopsy and nephrectomy specimens. In biopsy cases, the proportion of RCC (58.8% vs. 79.0%) was relatively lower compared to nephrectomy (p < .001), while the proportions of lymphoproliferative tumors (12.5% vs. 0.1%) and metastatic carcinomas (8.2% vs. 1.6%) were observed to be higher (p < .001), respectively.
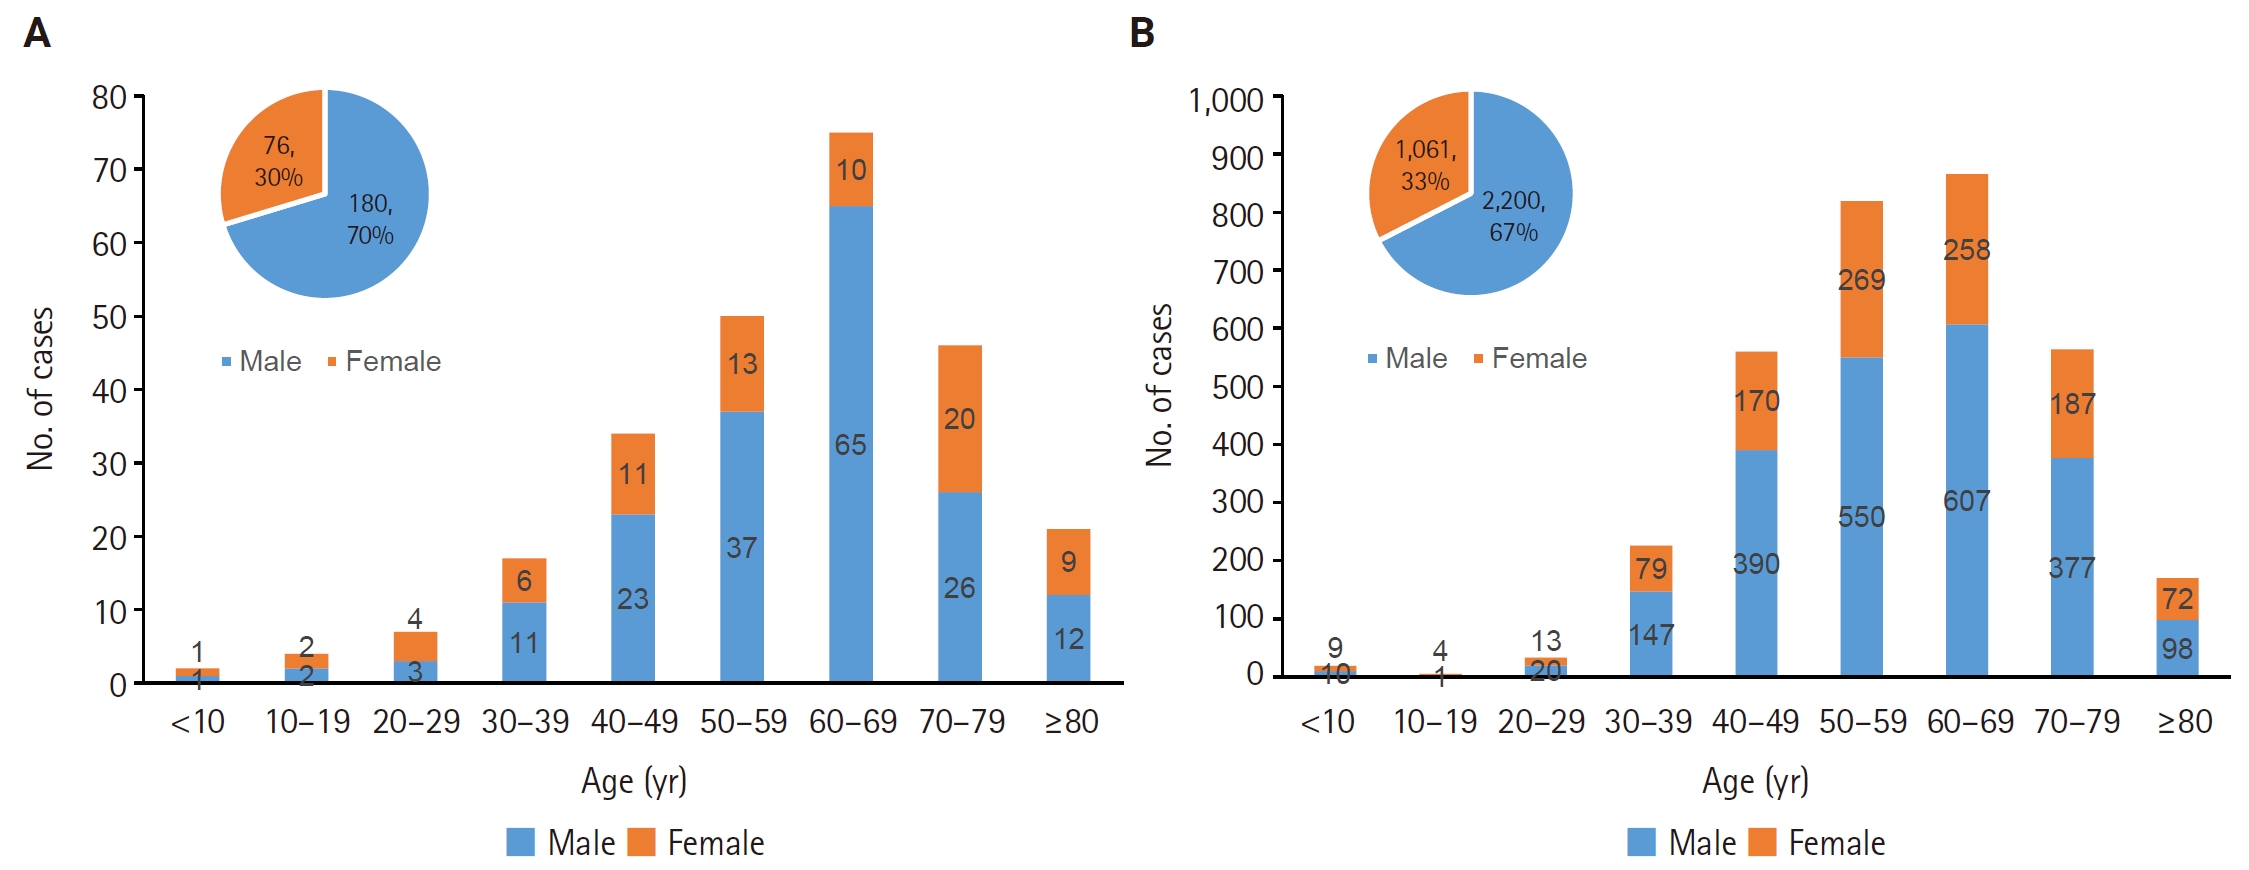
Age and sex distribution of patients with pathologically diagnosed malignant tumors from 256 renal biopsies (A) and 3,261 nephrectomies (B).
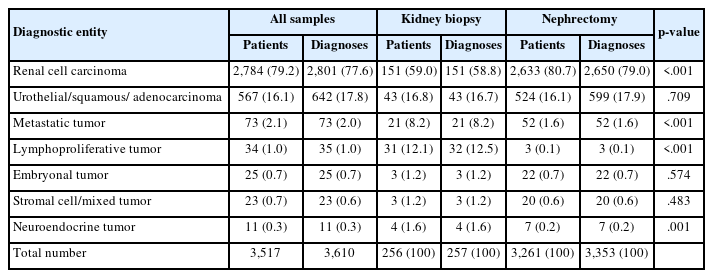
Diagnostic entities of malignant kidney tumors pathologically confirmed by renal biopsy or nephrectomy
RCC was the most commonly diagnosed malignant tumor by biopsy, with the clear cell subtype being the most prevalent, accounting for 100 cases (66.2%). Other subtypes included NOS/unclassified (18 cases, 11.9%), chromophobe (9 cases, 6.0%), papillary (9 cases, 6.0%), sarcomatoid (6 cases, 4.0%), and collecting duct carcinoma (5 cases, 3.3%). Rarely, there were clear cell papillary (2 cases, 1.3%), eosinophilic, solid and cystic (1 case, 0.7%), and translocation subtypes (1 case, 0.7%). There were 43 cases of urothelial/squamous/adenocarcinoma; invasive urothelial carcinoma was the most common (35 cases, 81.4%), followed by squamous cell carcinoma (3 cases, 7.0%), adenocarcinoma (2 cases, 4.7%), poorly differentiated malignant tumor (2 cases, 4.7%), and non-invasive papillary urothelial carcinoma (1 case, 2.3%). There were 32 cases of lymphoproliferative tumors, with diffuse large B-cell lymphoma being the most common (16 cases, 50.0%), followed by lymphoblastic leukemia (6 cases, 18.8%) and mucosa-associated lymphoid tissue (MALT) lymphoma (5 cases, 15.6%). In addition, acute myeloblastic leukemia, high-grade B-cell lymphoma, follicular lymphoma, Burkitt lymphoma, and malignant lymphoma, NOS were each diagnosed in 1 case. In particular, for lymphoproliferative tumors, a significant difference in diagnostic frequency was observed between biopsy (12.5%) and nephrectomy (0.1%) cases (p < .001).
The diagnostic categories and frequencies of 3,353 malignant tumors diagnosed by nephrectomy are shown in Table 3. The most common diagnosis was RCC (2,650 cases, 79.0%), followed by urothelial/squamous/adenocarcinoma (599 cases, 17.9%), metastatic tumor (52 cases, 1.6%), embryonal tumor (22 cases, 0.7%), stromal/mixed tumor (20 cases, 0.6%), neuroendocrine tumor (7 cases, 0.2%), and lymphoproliferative tumor (3 cases, 0.1%). Among the RCC subtypes, the clear cell subtype (2,141 cases, 80.8%) was the most common, followed by papillary (182 cases, 6.9%), chromophobe (171 cases, 6.5%), clear cell papillary (53 cases, 2.0%), acquired cystic disease-associated (27 cases, 1.0%), sarcomatoid (26 cases, 1.0%), and translocation (15 cases, 0.6%) subtypes. In addition, NOS/unclassified (9 cases, 0.3%), eosinophilic solid and cystic (8 cases, 0.3%), collecting duct carcinoma (5 cases, 0.2%), mucinous tubular and spindle cell carcinoma (4 cases, 0.2%), hybrid oncocytic/chromophobe (2 cases, 0.1%), and tubulocystic (2 cases, 0.1%) subtypes were diagnosed rarely with very low frequencies. As very rare subtypes, one case each of fumarate hydratase-deficient, succinate dehydrogenase-deficient, elongin C (ELOC)-deficient, thyroid-like follicular carcinoma of kidney, and oncocytic papillary RCC was diagnosed. Urothelial/squamous/adenocarcinoma was the second most common type of carcinoma, accounting for a total of 599 cases (17.9%). Among these, invasive urothelial carcinoma (428 cases, 71.5%), including sarcomatoid (6 cases) or plasmacytoid differentiation (1 case), was the most common, followed by non-invasive papillary urothelial carcinoma (89 cases, 14.9%), urothelial carcinoma in situ (71 cases, 11.9%), squamous cell carcinoma (10 cases, 1.7%), and clear cell adenocarcinoma (1 case, 0.2%). All 22 cases of embryonal tumors were nephroblastoma. Among the 20 cases of stromal cell/mixed tumors, epithelioid angiomyolipoma (AML) (12 cases, 60%) and leiomyosarcoma (4 cases, 20%) were identified, while synovial sarcoma, undifferentiated pleomorphic sarcoma, inflammatory malignant fibrous histiocytoma, and malignant solitary fibrous tumor were each diagnosed in 1 case (5%). A total of seven neuroendocrine tumors were diagnosed, identified as neuroendocrine carcinoma (3 cases), Ewing sarcoma (2 cases), and neuroblastoma (2 cases). There were three lymphoproliferative tumors, consisting of two cases of MALT lymphoma and 1 case of diffuse large B-cell lymphoma. In a total of 73 patients with metastatic cancer confirmed by renal biopsy or nephrectomy, 19 primary sites were identified. The most common primary sites were the retroperitoneum (16 cases, 21.9%), colorectum (13 cases, 17.8%), lung (10 cases, 13.7%), thyroid (6 cases, 8.2%), and ovary (6 cases, 8.2%) (Fig. 5). The detailed pathological diagnoses of metastatic cancer are summarized in Table 4.
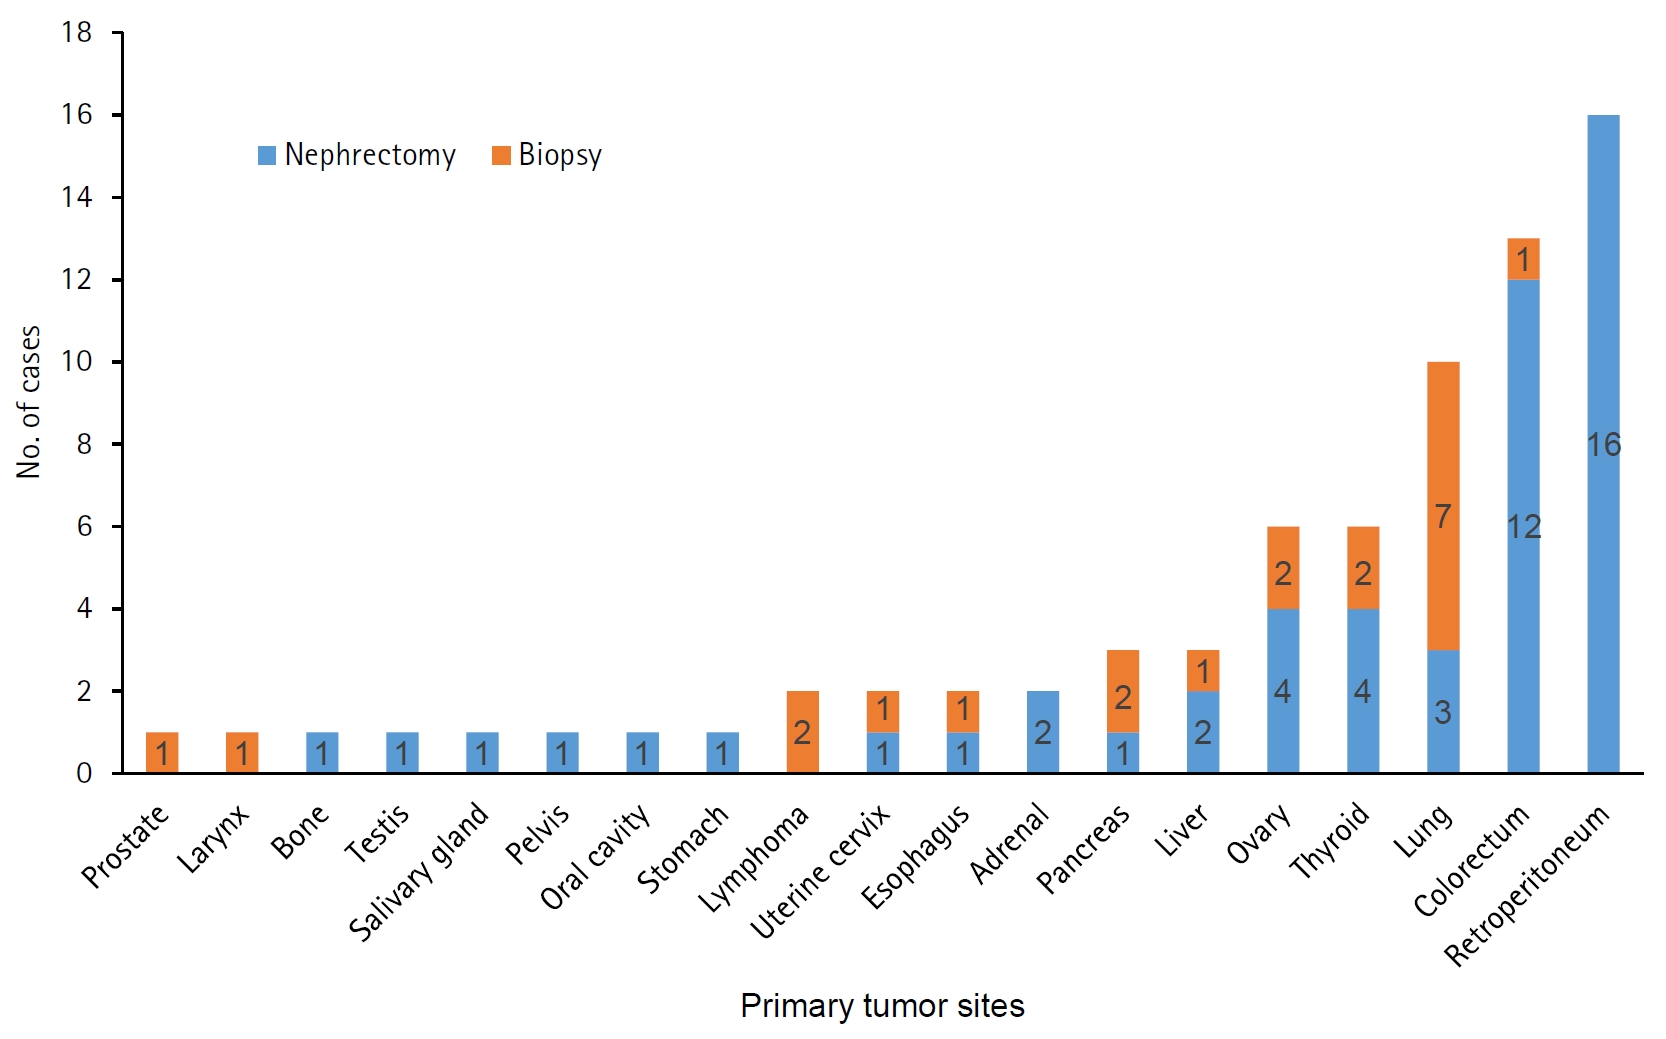
Primary tumor sites in 73 patients diagnosed with renal metastatic cancer by renal biopsy or nephrectomy.
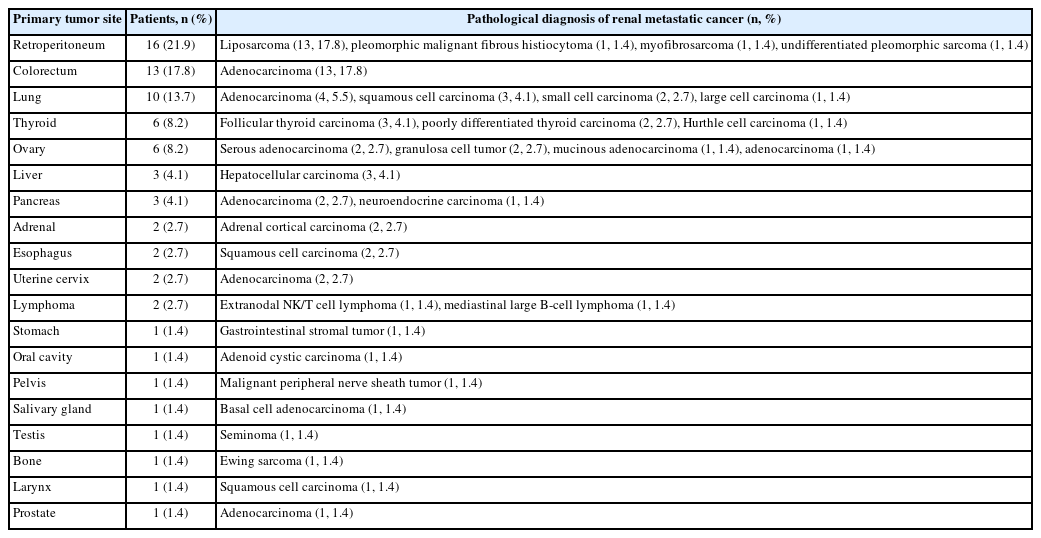
Primary tumor site and pathologic diagnosis in 73 patients with renal metastatic cancer confirmed by renal biopsy or nephrectomy
Demographics and pathologic diagnostic entities of benign kidney tumors
An analysis of the age distribution of 739 patients with benign kidney tumors revealed an increasing trend starting from the 30s, peaking in the 50s and 60s, and decreasing after age 70. Among all patients who underwent biopsy or nephrectomy, the proportion of women was 1.42 times higher than that of men. Furthermore, the sex distribution differed significantly across age groups (p = .003). The female predominance was more pronounced in the 40–59-year group (1.89:1), whereas it was less marked in the 60–79-year group (1.03:1) (Fig. 6). Among the 35 benign tumors diagnosed by biopsy, stromal cell/mixed lesions (22 cases, 62.9%) were the most common, including AML (18 cases, 81.8%), leiomyoma (2 cases, 9.1%), and one case each (4.5%) of mixed epithelial and stromal tumor and myxoid spindle cell lesion with lymphoplasmacytic infiltration. The second most common category was benign tumors of renal epithelial origin (7 cases, 20.0%), including oncocytoma (5 cases, 71.4%), oncocytic renal cell tumor (1 case, 14.3%), and oncocytic cells with mild atypism (1 case, 14.3%). In addition, five cases of simple cyst and one nephrogenic tumor were identified. Of the 807 benign tumors diagnosed by nephrectomy, cystic lesions (499 cases, 61.8%) were the most common diagnostic category, most of which were simple or multilocular cysts (491 cases, 98.4%). Other cystic lesions were rare (<1.0%), including epidermoid cysts (2 cases) and perirenal cysts (2 cases), and single cases of medullary cystic disease, Müllerian cyst, renal sinus cyst, and unilateral renal cystic disease. Stromal cell/mixed lesions (200 cases, 24.8%) were the second most common, with AML (165 cases, 82.5%) being the most common, and the remaining tumors can be found in Table 5. Benign tumors of renal epithelial origin (106 cases, 13.1%) were the third most common diagnostic category, and included oncocytoma (75 cases, 70.8%), papillary adenoma (26 cases, 24.5%), and metanephric adenoma (5 cases, 4.7%). In addition, there was one case each of nephrogenic adenoma and inverted urothelial neoplasm.
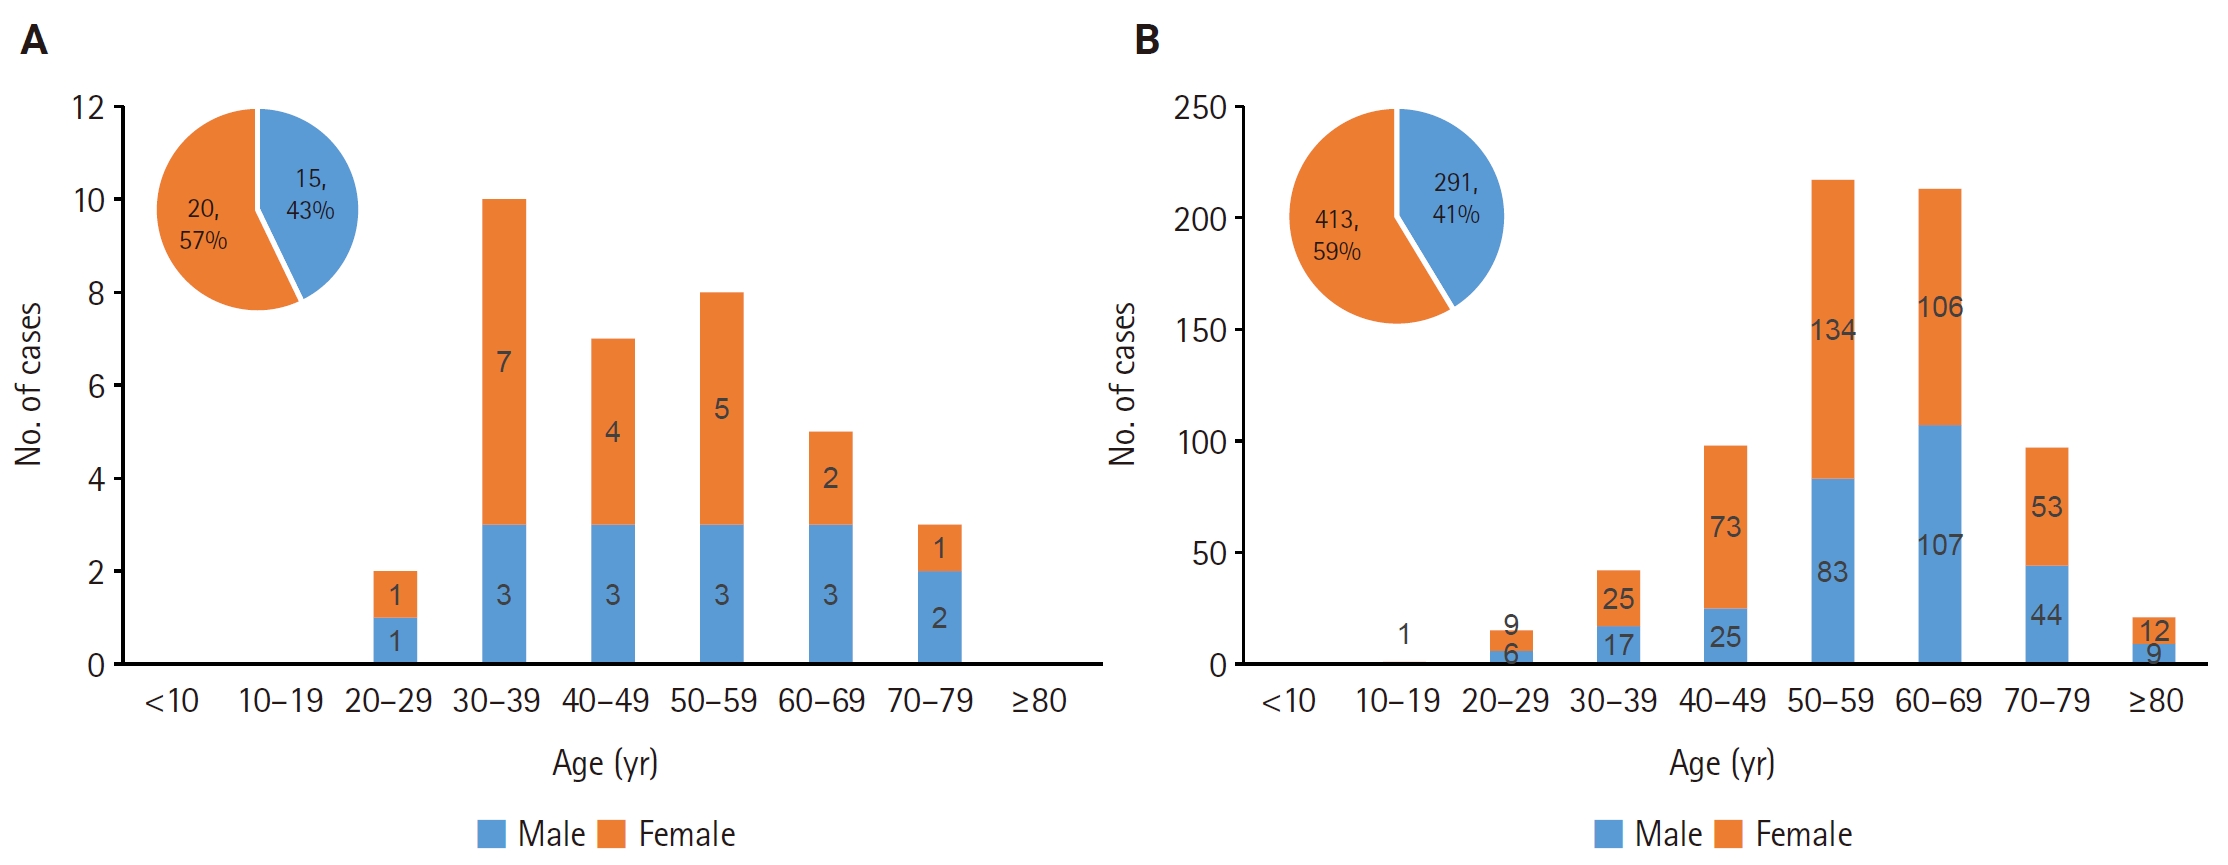
Age and sex distribution of patients with pathologically diagnosed benign tumors from 35 renal biopsies (A) and 704 nephrectomies (B).
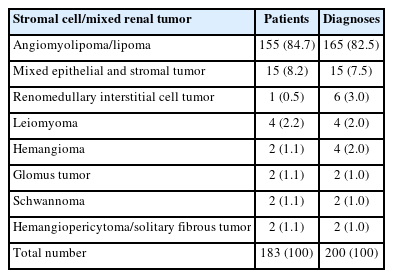
Diagnosis of pathologically confirmed stromal cell/mixed benign renal tumors by nephrectomy
Demographics and pathologic diagnostic entities of undefined kidney tumors
Of the 65 patients diagnosed with undefined kidney tumors, the age distribution was mainly between the 40s and 60s (45 patients, 69%), and the ratio of men to women was higher in men in both biopsy (5.5 times) and nephrectomy (2.25 times). There were a total of 13 cases diagnosed as undefined on renal biopsy, including renal cell tumors (7 cases, 53.8%), of which 3 were subsequently confirmed as RCC in nephrectomy tissue. Lymphoproliferative disease (2 cases, 15.4%) was also subsequently confirmed as IgG4-related disease and lymphoid granulomatosis, respectively, by nephrectomy, and spindle cell neoplasm (1 case, 7.7%) was subsequently confirmed as synovial sarcoma. No further examinations were performed for focal infiltration of atypical cells (2 cases, 15.4%) and urothelial proliferation (1 case, 7.7%). Among the 56 cases of undefined tumors diagnosed by nephrectomy, the origins were renal epithelial (50 cases, 89.3%), urothelial (5 cases, 8.9%), and lymphoproliferative disease, possibly IgG4-related disease (1 case, 1.8%). Among the renal epithelial origin tumors, there were multilocular cystic renal neoplasm of low malignant potential/ multilocular cystic RCC (40 cases, 80%) and low-grade oncocytic tumor (5 cases, 10%), while the remaining cases included one each of oncocytic cystic renal tumor, papillary neoplasm, renal cell tumor, renal neoplasm with tubular structures, and unilocular cystic renal neoplasm of low malignant potential. In cases of urothelial origin, urothelial proliferation with uncertain malignant potential (3 cases, 60%) and non-invasive papillary urothelial neoplasm of low malignant potential (2 cases, 40%) were diagnosed.
Demographics and pathologic diagnostic entities of other kidney lesions
Of the 34 cases classified as other kidney lesions, 12 were diagnosed as unremarkable and 1 each as extramedullary hematopoiesis, total infarction of the tumor, and malakoplakia through biopsy (15 cases). Through nephrectomy (19 cases), 18 were confirmed as unremarkable and 1 as total infarction of the tumor.
DISCUSSION
This study retrospectively analyzed patients with kidney tumors who underwent biopsy or nephrectomy over 33 years at a leading tertiary general hospital in South Korea, and summarized long-term demographic changes experienced in actual clinical practice. In particular, this study is meaningful in that it evaluated 4,555 pathology-proven kidney tumors, analyzing the trends of pathological diagnostic categories changing over time and by age groups. Although demographic studies on kidney cancer have been reported both domestically and internationally [1,5,6,8,11], comprehensive long-term analyses focusing on pathology-proven kidney tumors remain limited, thereby restricting the understanding of changes in pathology over time [12].
Kidney cancer accounts for about 2% of cancer diagnoses worldwide, and its incidence has more than doubled over the past half-century, mainly in developed countries [1-6]. According to an analysis by the American Cancer Society in 2025, approximately 80,980 new cases of kidney cancer were diagnosed in the United States, and it is expected that kidney cancer will account for 5% of all cancers in men and 3% in women [3]. Additionally, according to the Annual Report of Cancer Statistics in Korea in 2023, the number of new cases of kidney cancer was 7,367, and the crude incidence rate was 14.4 per 100,000 people. Among the 288,613 total cancer cases, kidney cancer ranked 10th in incidence, accounting for 3.4% in men and 1.7% in women [2], so the incidence rate in Korea is still lower than that in the United States [11,12]. In this study, the average age of all patients with kidney tumors was 58 years, and the male-to-female ratio was 1.7:1. The age distribution of these patients showed a rapid increase starting from their 30s, peaking in the 60s, and decreasing after their 70s. These results were similar to previous reports [5,11,17-20]. A study conducted in the United States also found that the age-standardized incidence rate from 2000 to 2020 was highest in the 70–84 age group, but the incidence rate also significantly increased in the younger age group under 39, which was analyzed to be associated with an increase in metabolic diseases such as obesity and diabetes [5].
Of the total 4,555 cases in this study, biopsies accounted for 320 cases (7.0%) and nephrectomy for 4,235 cases (93.0%). Over the past 33 years, the number of biopsies increased 14.3-fold and the number of nephrectomy procedures increased 11.5-fold, while the number of malignant tumors increased 12.6-fold and benign tumors increased 9.4-fold. The long-term increasing trend in the incidence of kidney cancer is attributed to factors such as the increased detection of asymptomatic tumors due to advancements in medical imaging technology [1,3,4], and the rise in metabolic diseases [5], but the primary cause is known to be the increase in localized tumors [4,9]. We also analyzed cases by separating biopsies and nephrectomy procedures, as the number of biopsies performed to diagnose kidney tumors has increased rapidly since 2000, particularly in the last 10 years. Specifically, our number of biopsies increased 4.6-fold from 1994–2003 to 2004–2013, and increased 14.3-fold to 2014–2023. Percutaneous biopsy for the diagnosis of kidney tumors was first introduced in 1951 [21] but its use in cancer diagnosis was initially limited due to technical concerns. However, since the 2000s, with advancements in imaging and biopsy technology, renal mass biopsy (RMB) has been increasing due to its high diagnostic efficiency (sensitivity of 95–99%, specificity of 96–100%) [6,22,23]. Additionally, according to a study analyzing the National Cancer Database for Renal Cell Carcinoma patients from 2004 to 2015, the number of RMBs increased 3.5-fold from 1,586 to 5,629 cases, with a significant increase observed particularly in cases with a tumor size of 2–4 cm (p < .001) or in the ablation group (p < .001) [24].
All tumors were classified into four diagnostic categories in our study: 79.3% malignant, 18.5% benign, 1.5% undefined, and 0.7% other lesions. When comparing biopsy and nephrectomy cases, malignant tumors accounted for approximately 80% in both groups, with no difference in diagnostic frequency (p = .680); however, the diagnostic frequency of benign tumors was lower in biopsy (10.9%) compared to nephrectomy (19.1%) (p < .001). This is explained by the fact that RMB is not commonly performed on lesions with characteristic benign imaging features, such as AML or simple cysts [23,24]. In this study, the change in kidney tumors over time was observed to have increased 2.8-fold over the 20-year period from 1994–2003 to 2004–2013, and approximately 11.7-fold over the 30-year period to 2014–2023. Previous national statistics in South Korea reported that kidney cancer increased approximately 3.2-fold through a single-year comparison from 1999 to 2020 [11,12]. This difference in the magnitude of the increase may be the result of a complex interplay of factors, including differences in the unit of analysis, the characteristics of data based on a single institution, and the effect of specific tumors being concentrated in that institution. Therefore, rather than making an absolute comparison of the scale of increase, it is more appropriate to interpret this in terms of the long-term increasing trend and direction of kidney tumors consistently reported in various studies [5,25-27].
In our study, malignant kidney tumors showed male predominance (2.1:1) and were most frequently diagnosed in older adults, consistent with previous studies [1,3,6,8,11,25]. Previous reports indicate that the incidence rate has steadily increased with age and generally peaks around age 75 [28,29]. In the United States, the average age at diagnosis of RCC was 64 [1,29]. This may, in part, be explained by the higher utilization of healthcare services and increased use of imaging studies in older patients, which raise the likelihood of detecting clinically significant lesions [7,30]. In addition, the possibility of selection bias may also be considered, as surgical indications may be applied more selectively in frail patients [31,32]. Further analyses comparing these findings with population-based data will be necessary to better clarify these observations. In this study, RCC was the most common diagnosis among malignant tumors (77.6%) as well as all tumors (61.5%). The proportion of RCC among malignant tumors diagnosed by nephrectomy was 79.0%, which was slightly lower than the generally reported rate of over 85% [8,17,29,33]. This difference may be due to the tendency to prefer biopsy for determining treatment strategies in clinical situations where surgical resection is inappropriate or systemic treatment is being considered [6,23,34,35]. Among RCC cases, the clear cell subtype was the most prevalent (80.8%), consistent with previous reports [1-3,17,25].
We observed a distinct difference in the diagnostic spectrum of malignant kidney tumors between biopsy and nephrectomy cases. As shown in Table 3, RCC was the most common malignancy in both groups, but its proportion was lower in biopsy cases than in nephrectomy cases (58.8% vs. 79.0%, p < .001). In contrast, the proportions of lymphoproliferative tumors (12.5% vs. 0.1%, p < .001), metastatic carcinomas (8.2% vs. 1.6%, p < .001), and neuroendocrine tumors (1.6% vs. 0.2%, p = .001) were significantly higher in biopsy specimens than in nephrectomy. The lower proportion of RCC in biopsy specimens and the higher frequency of lymphoproliferative, metastatic, and neuroendocrine tumors may reflect selection bias in clinical practice. It is believed that this is because RMB is generally performed when imaging findings do not show typical characteristics of RCC, and thus when lymphoma, metastatic cancer or neuroendocrine tumors are suspected [3,6,7,23,31,36]. Lymphoproliferative disease of the kidney is rarer than RCC, but it is important, particularly in transplant patients and young age groups [2,3]. Since it can be difficult to distinguish from RCC by imaging alone, accurate diagnosis through biopsy is important [6,23,31]. Among 73 patients with metastatic carcinoma, 19 distinct primary sites were identified. The most common primary site was the retroperitoneum (21.9%). This distribution differs from previous reports, in which the lung has consistently been identified as the most frequent primary site [17,37,38]. This discrepancy may be due to selection bias caused by specific circumstances such as the tertiary medical center being located in the capital of a country. In this study, liposarcoma was the most common metastatic entity, while it is reported that about 5.3% of tumors that metastasize to the kidneys originate from the sarcoma lineage [38].
Benign kidney tumors were 1.42 times more frequent in women than in men, and were most frequently diagnosed in middle-aged adults, generally consistent with previous reports [9,17-19,33]. A meta-analysis of 9,665 kidney tumors in Europe found that women were 2.55 times more likely to have benign lesions than men [18]. The higher proportion of women is likely due to the fact that AML is known to occur more than twice as often in women, especially aged 40 to 60 [9,18,20,39,40]. A large-scale ultrasound analysis of 61,389 patients in Germany showed that the prevalence of sporadic AML was about 2.1 times higher in women (0.60%) than in men (0.28%), and 68.1% of all AML cases were found in women [39]. It has been reported that the more common cause of benign tumors such as AML in women is likely due to the influence of estrogen [20]. Furthermore, the number of benign tumors increased 9.4-fold from 1994–2003 to 2014–2023. Although the number of benign tumors increased over time, the proportion of benign tumors among all kidney tumors decreased (p < .001) and showed a decreasing trend with increasing age (p = .070). The decrease in the proportion of benign tumors among all tumors over time is attributed to the relative increase in malignant tumors and improved imaging technology, which has reduced the need for biopsies or surgical interventions for lesions confirmed as benign [9,31]. Differences were also observed depending on the specimen, with benign tumors being diagnosed more frequently in nephrectomy (19.1%) than in biopsy (10.9%) (p < .001). This differs from the frequency of benign tumors (6.5%–7.1%) among kidney tumors resected under suspicion of malignancy reported in studies in Korea [9,33,41], and it is believed that this is because clinically clear benign lesions were also included in the surgical subjects for various clinical reasons in this study.
The diagnosis frequency of undefined tumor was higher by biopsy (4.1%) than by nephrectomy (1.3%) (p < .001), likely because biopsies were frequently performed first in cases of radiologically suspicious tumors. Specifically, in biopsies, a clear diagnosis could not be made due to a lack of specimens or rare diseases, while in nephrectomy specimens, the diagnosis of the tumor was confirmed but the reported tumor category was actually borderline (91.1%) or the classification of the tumor had not yet been established (8.9%).
This study has several limitations. First, it is a retrospective study based on pathology records from a single institution, and there is a possibility of selection bias because the number of biopsy specimens was too small compared to nephrectomy specimens. Future studies should include prospective multicenter research and molecular profiling analysis. Second, although kidney tumors were classified according to the WHO classification (1st to 5th editions), previous pathological diagnoses were not systematically re-reviewed or reclassified according to the latest standards. Furthermore, due to the limited availability of molecular genetic data, there is a possibility that tumor subtypes may be misclassified. Third, due to the nature of biopsies, which are diagnosed based on limited tissue samples, there may be limitations in classifying detailed subtypes, which may have led to some tumors being categorized as ‘undefined tumor.’ Finally, because there were very few cases of nephrectomy following biopsy and a lack of follow-up data on survival rates and treatment responses, analysis regarding biopsy-nephrectomy concordance and clinical outcomes could not be included.
In conclusion, this study reveals demographic changes indicating a long-term increase in kidney tumors in South Korea over the past 33 years. These results will serve as foundational data to enhance our understanding of kidney tumors and to respond appropriately to evolving clinical practices and treatments.
Notes
Ethics Statement
This study was approved by the Institutional Review Board (IRB) of The Catholic University of Korea, Seoul St. Mary’s Hospital (IRB approval No. 2024-3117-0001, date of approval: 10 January 2025). It was performed in accordance with the Declaration of Helsinki. The requirement for written informed consent was waived because of its retrospective nature.
Availability of Data and Material
The datasets generated or analyzed during the study are available from the corresponding author on reasonable request.
Code Availability
Not applicable.
Author Contributions
Conceptualization: YJC. Data curation: YJC, SUK, JK. Formal analysis: SUK, JK. Investigation: YJC, SUK, JK. Funding acquisition: YJC. Methodology: YJC, HN, JK. Project administration: YJC, SUK. Resources: HN, JK. Software: SUK, JK. Supervision: YJC. Validation: YJC. Visualization: SUK, JK. Writing—original draft: SUK, YJC. Writing—review & editing: YJC. Approval of final manuscript: all authors.
Conflicts of Interest
The authors declare that they have no potential conflicts of interest.
Funding Statement
This study was supported by a grant (Project Number: 9991006769, KMDF_PR_20200901_0096) of the Korea Medical Device Development Fund. It was also supported by a grant (NTIS, KMDF_RnD_20200901_0096) funded by the Korea government (the Ministry of Science and ICT, the Ministry of Trade, Industry and Energy, the Ministry of Health & Welfare, the Ministry of Food and Drug Safety).