Multicenter evaluation of the PASS score as a negative predictive tool and the impact of inter-observer variability in pheochromocytoma and paraganglioma risk stratification
Article information

Abstract
Background
The Pheochromocytoma of the Adrenal Gland Scaled Score (PASS) is widely used for risk stratification in pheochromocytoma and paraganglioma (PPGL), but its clinical utility is limited by inter-observer variability of its parameters and inconsistent predictive performance.
Methods
We conducted a multicenter retrospective study of 1,518 patients with PPGL from five tertiary referral centers in Korea. Prognostic utility of PASS system was assessed using logistic regression, Kaplan-Meier analysis, and receiver operating characteristic (ROC) curve analysis. Inter-observer variability was inferred by comparing area under the ROC curve (AUCs) across institutions. Simplified PASS systems were developed based on multivariable analysis of key histopathological parameters.
Results
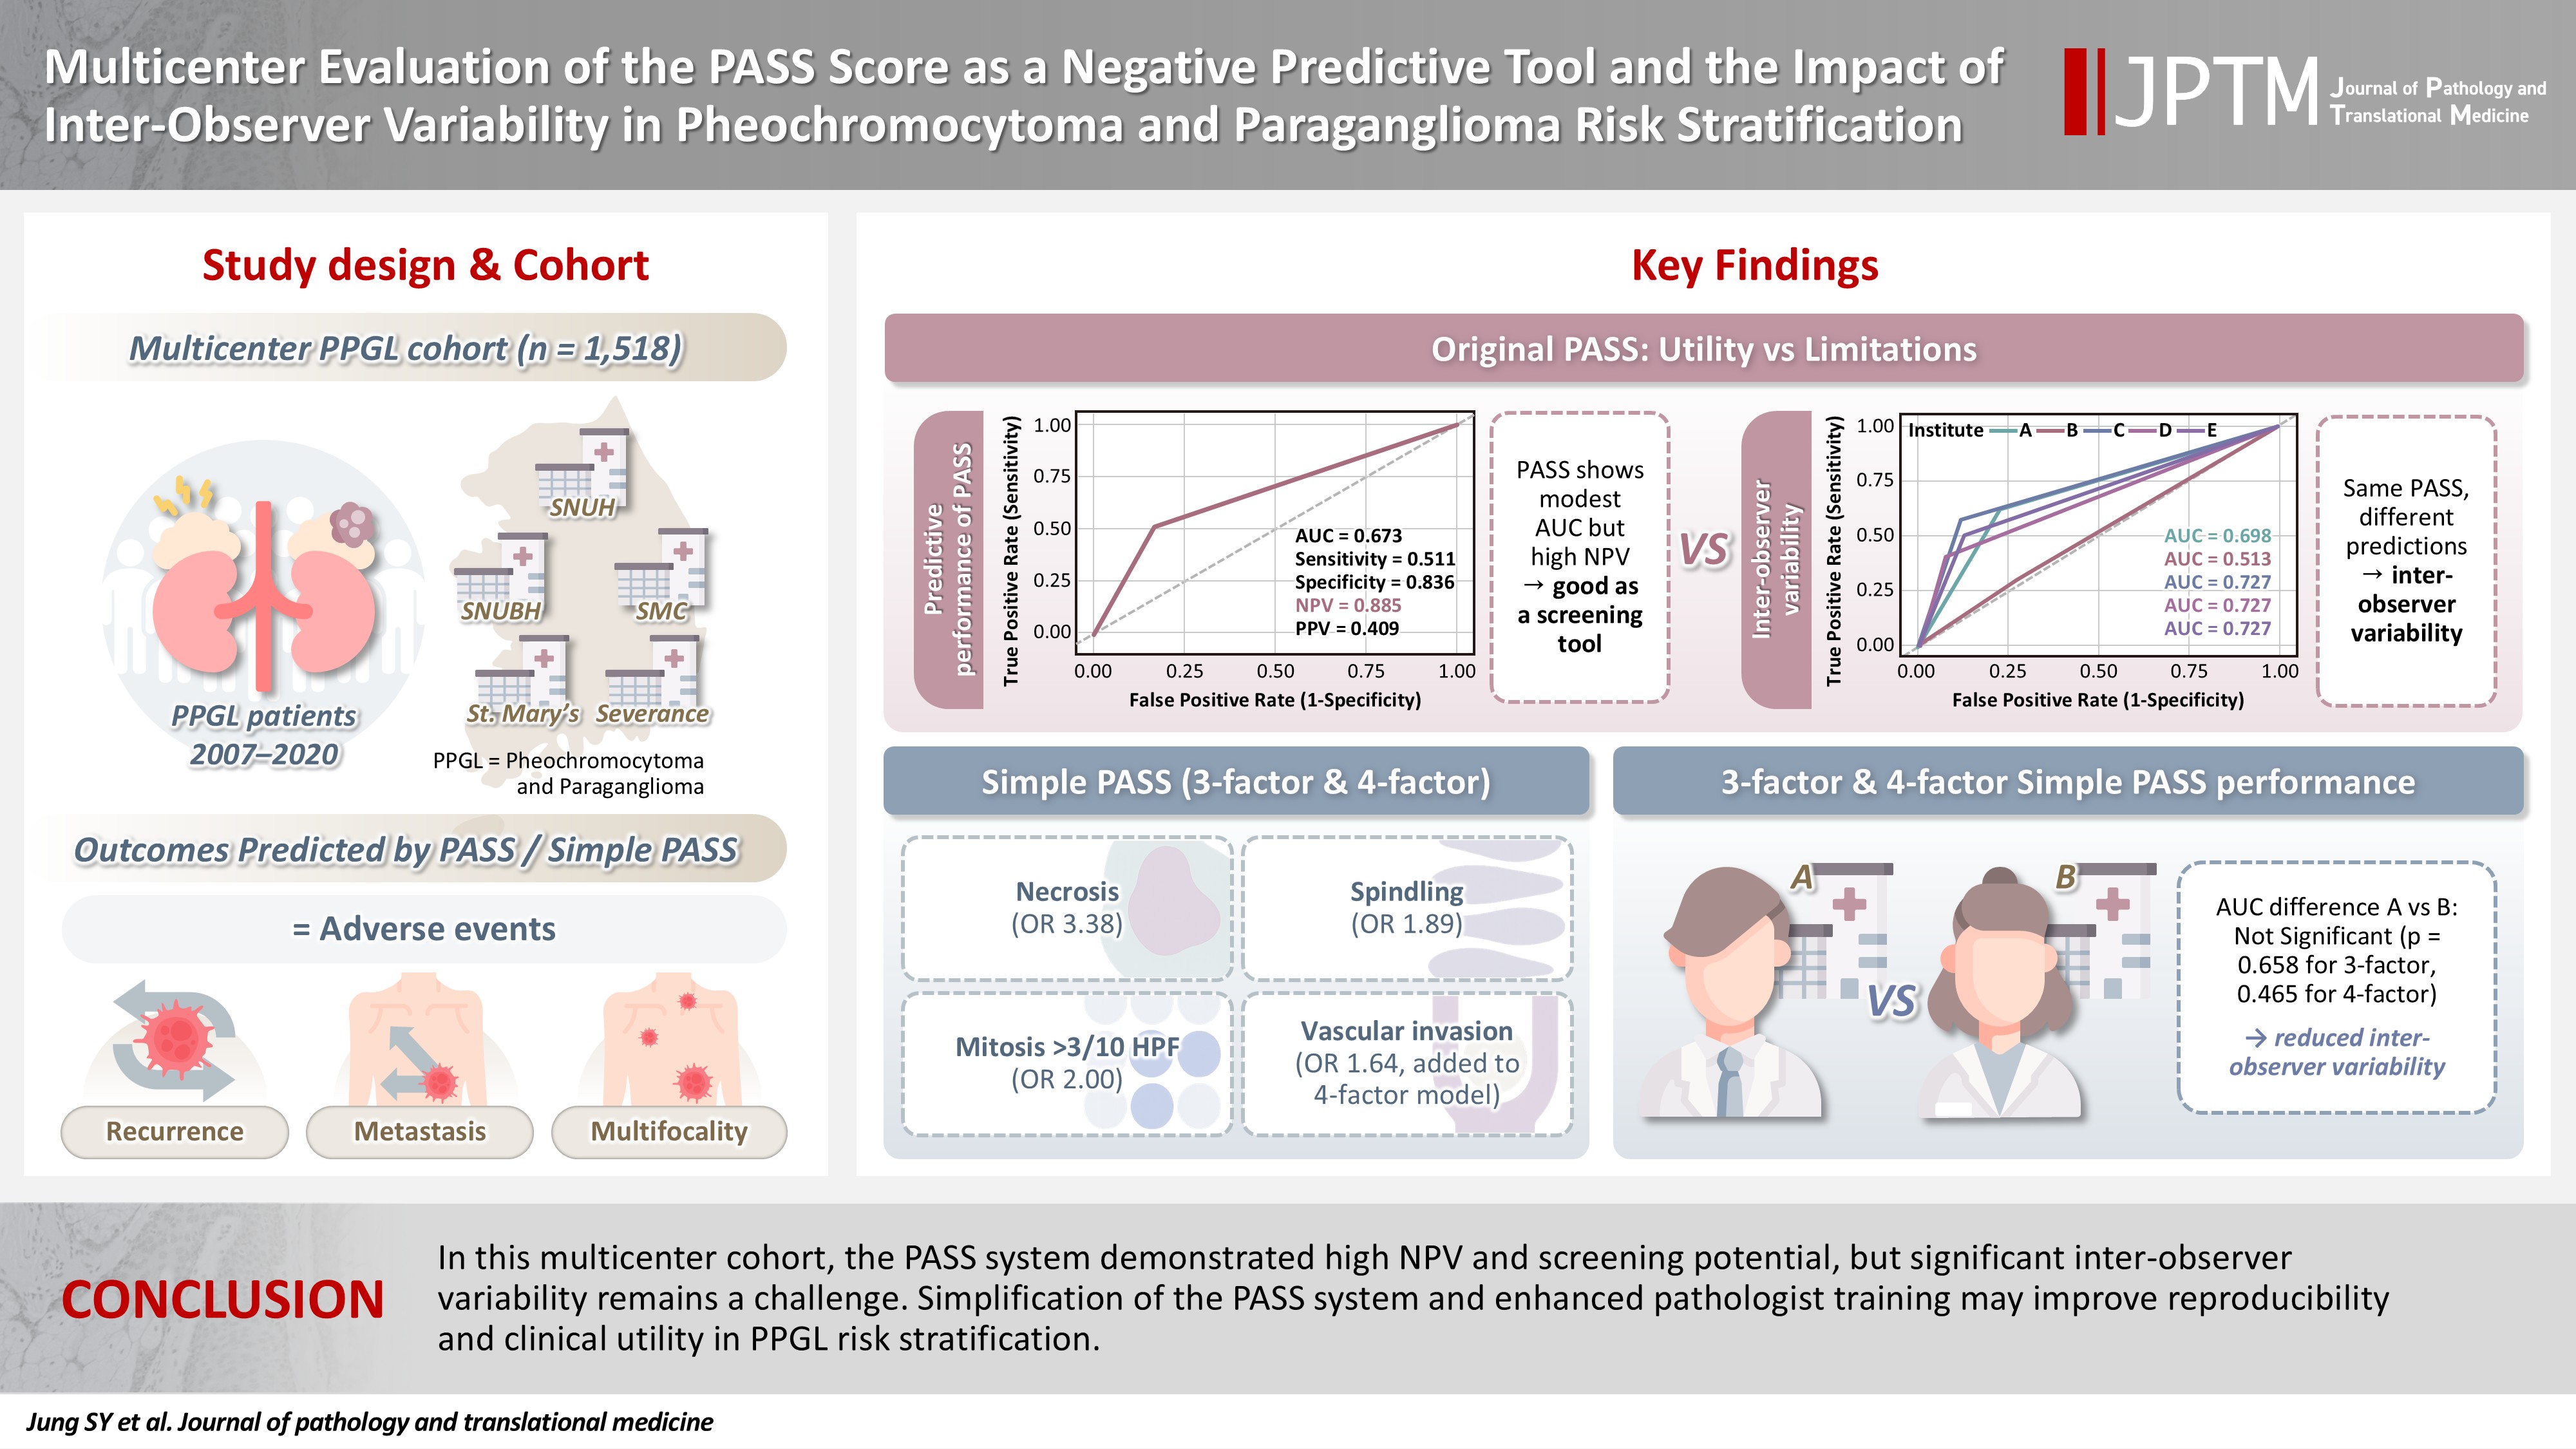
The PASS system was a significant predictor of adverse events and recurrence-free survival. Although the PASS system demonstrated only modest discriminative ability (AUC, 0.673), it showed a high negative predictive value (NPV, 0.885), supporting its usefulness as a screening tool for benign behavior. However, there was significant inter-institutional variability in PASS performance (AUC; range, 0.513 to 0.727; p < .05). The 3-factor Simple PASS, which incorporates necrosis, spindling, and mitotic figures, exhibited less inter-observer variation. The 4-factor Simple PASS, which adds vascular invasion to the 3-factor model, also showed reduced inter-observer variability and improved AUC and NPV compared to the original PASS system.
Conclusions
In this multicenter cohort, the PASS system demonstrated high NPV and screening potential, but significant inter-observer variability remains a challenge. Simplification of the PASS system and enhanced pathologist training may improve reproducibility and clinical utility in PPGL risk stratification.
INTRODUCTION
Pheochromocytomas, which are now categorized as adrenal paragangliomas (PPGL) and PPGL are rare neuroendocrine tumors arising from the adrenal medulla and the paraganglia of the autonomic nervous system, respectively, with diverse clinical behaviors ranging from benign to highly aggressive forms [1-3]. Accurate prognostication remains a challenge due to the heterogeneous nature of these tumors and the lack of universally accepted histopathological grading systems [1-3]. The Pheochromocytoma of the Adrenal Gland Scaled Score (PASS) has been proposed to stratify the risk of malignancy and adverse clinical outcomes [4,5]. However, limitations such as inter-observer variability and inconsistent predictive performance have been reported, raising concerns about its clinical utility [6-9].
The PASS, originally developed by Thompson, incorporates multiple histopathological parameters but lacks quantitative standards for each, leading to variability in interpretation and application across institutions [4,6-11]. Previous research has demonstrated that the PASS, despite its modest overall performance, maintains a high negative predictive value (NPV), suggesting a potential role as a screening tool [5,12-14].
Given these challenges, there is a need to refine prognostic models for PPGL to improve reproducibility and predictive accuracy. Recent efforts to develop a simplified scoring system, focusing on key histopathological features with the strongest associations to adverse events, have shown promise in reducing inter-observer variability and enhancing prognostic performance [5,11,15-18]. This multicenter study aims to evaluate the prognostic significance of the PASS across five tertiary referral centers in Korea, assess inter-institutional variability, and validate the utility of simplified PASS scoring systems for risk stratification in PPGL patients.
MATERIALS AND METHODS
Study cohort and data collection
Five tertiary referral centers in Korea participated in this multi center study investigating the prognostic factors for paragangliomas. The participating institutions were Seoul National University Hospital (SNUH), Seoul National University Bundang Hospital (SNUBH), Samsung Medical Center (SMC), Seoul St. Mary’s Hospital, and Severance Hospital. All data were fully anonymized and merged prior to analysis, so that investigators were blinded to the identity of the contributing institutions.
A total of 1,523 patients diagnosed with PPGL from 2007 to 2020 in 5 hospitals were initially identified. Among these, three cases of gangliocytic paraganglioma and two cases of cauda equina paraganglioma were excluded from the cohort, as these entities are currently classified as composite gangliocytoma/neuroma and neuroendocrine tumor, and cauda equina neuroendocrine tumor, respectively, according to the latest World Health Organization (WHO) classification of endocrine and neuroendocrine tumors [1]. Therefore, the final study cohort comprised 1,518 patients.
Of the total cohort, PASS information was available in 1,079 cases.
Definition of clinical outcomes
Adverse events were defined as the presence of recurrence, metastasis, or multifocality. Recurrence was defined as tumor relapsing in the vicinity of the operative bed. Metastasis was defined as pathologically or radiologically confirmed tumor spread to sites outside the operative bed, specifically bone and lymph nodes [17,19-21]. Multifocality was defined as the presence of additional tumors, excluding bone or lymph node, detected at the time of pathological diagnosis. Recurrence-free survival (RFS) was defined as the interval from the date of surgery to the most recent follow-up or the time when an adverse event occurred.
Statistical analysis
All statistical analyses were performed using R Software (R Foundation for Statistical Computing, Vienna, Austria). Continuous variables were compared using analysis of variance (ANOVA), and categorical variables were analyzed with Fisher’s exact test. Survival outcomes were evaluated with Kaplan-Meier plots and the log-rank test in the subset of 363 cases with available RFS data. Univariable and multivariable Cox proportional hazards models were used to assess prognostic factors for RFS in these 363 cases. For adverse event outcomes, univariable and multivariable logistic regression analyses were conducted separately for patients with available PASS data (n = 1,079). Pair-wise Delong test was performed for comparison of area under the receiver operating characteristic curve (AUC) among five institutes. A two-sided p-value < .05 was considered statistically significant.
RESULTS
Baseline characteristics
The baseline characteristics of the study cohort are summarized in Table 1. Mean age, sex distribution, tumor size, tumor localization, PASS, and disease status are presented for each hospital. Significant differences in mean age were observed among the institutes (ANOVA, p < .05); specifically, hospital D had a higher mean age compared to hospitals A and E. PASS also differed significantly among groups, with hospital A exhibiting higher scores than the other hospitals. For categorical variables such as sex, tumor localization, and disease status, the proportions are reported in Table 1. For tumor localization, cases of paraganglioma in which the localization could not be identified in the electronic medical records were classified as unknown. Statistically significant differences among hospitals were identified for localization and disease state (Fisher’s exact test; p-values are shown in Table 1).
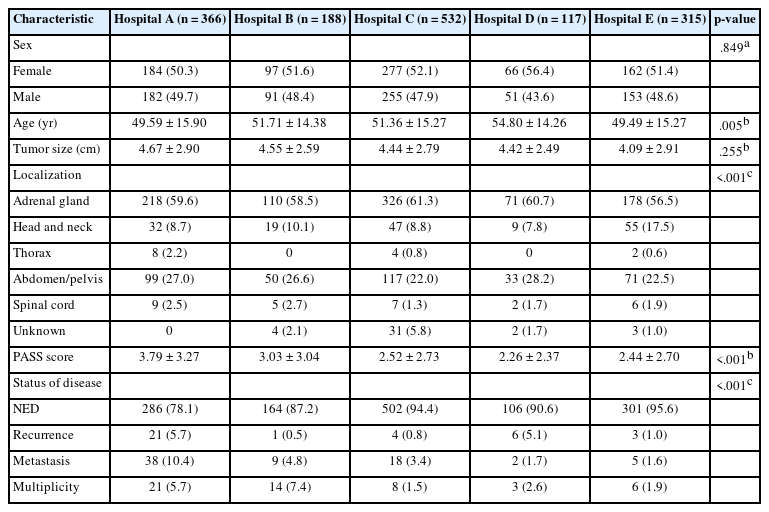
Baseline characteristics of this cohort
PASS as prognostic indicator of adverse events
Univariable and multivariable logistic regression analyses were performed to evaluate the odds ratios of each variable in the total cohort of 1,518 cases (Table 2). In univariable analysis, all variables except sex were statistically significant. However, in multivariable analysis, only age (per 10 years) (odds ratio [OR], 0.68; 95% confidence interval [CI], 0.60 to 0.76; p < .001) and PASS category (intermediate risk [4–5]: OR, 2.05; 95% CI, 1.22 to 3.35; high risk (≥6): OR, 4.83; 95% CI, 3.12 to 7.50; p < .001) remained significant.
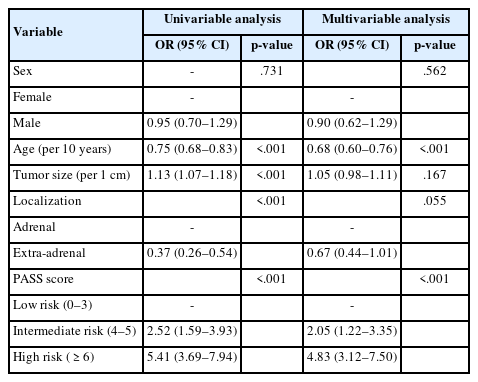
Logistic regression analysis for adverse events
Kaplan-Meier survival analyses were conducted for the 363 cases with available survival data. Survival curves were stratified by age (≤45 years vs. >45 years), sex, tumor localization (adrenal vs. extra-adrenal), tumor size (≤5.0 cm vs. >5.0 cm), and PASS category (low risk [≤3], intermediate risk [4–5], high risk [≥6]), as shown in Fig. 1. According to the log-rank test, significant differences in survival were observed for age and PASS score categories (all p < .001). In contrast, sex, tumor localization, and tumor size did not show statistically significant differences in survival.
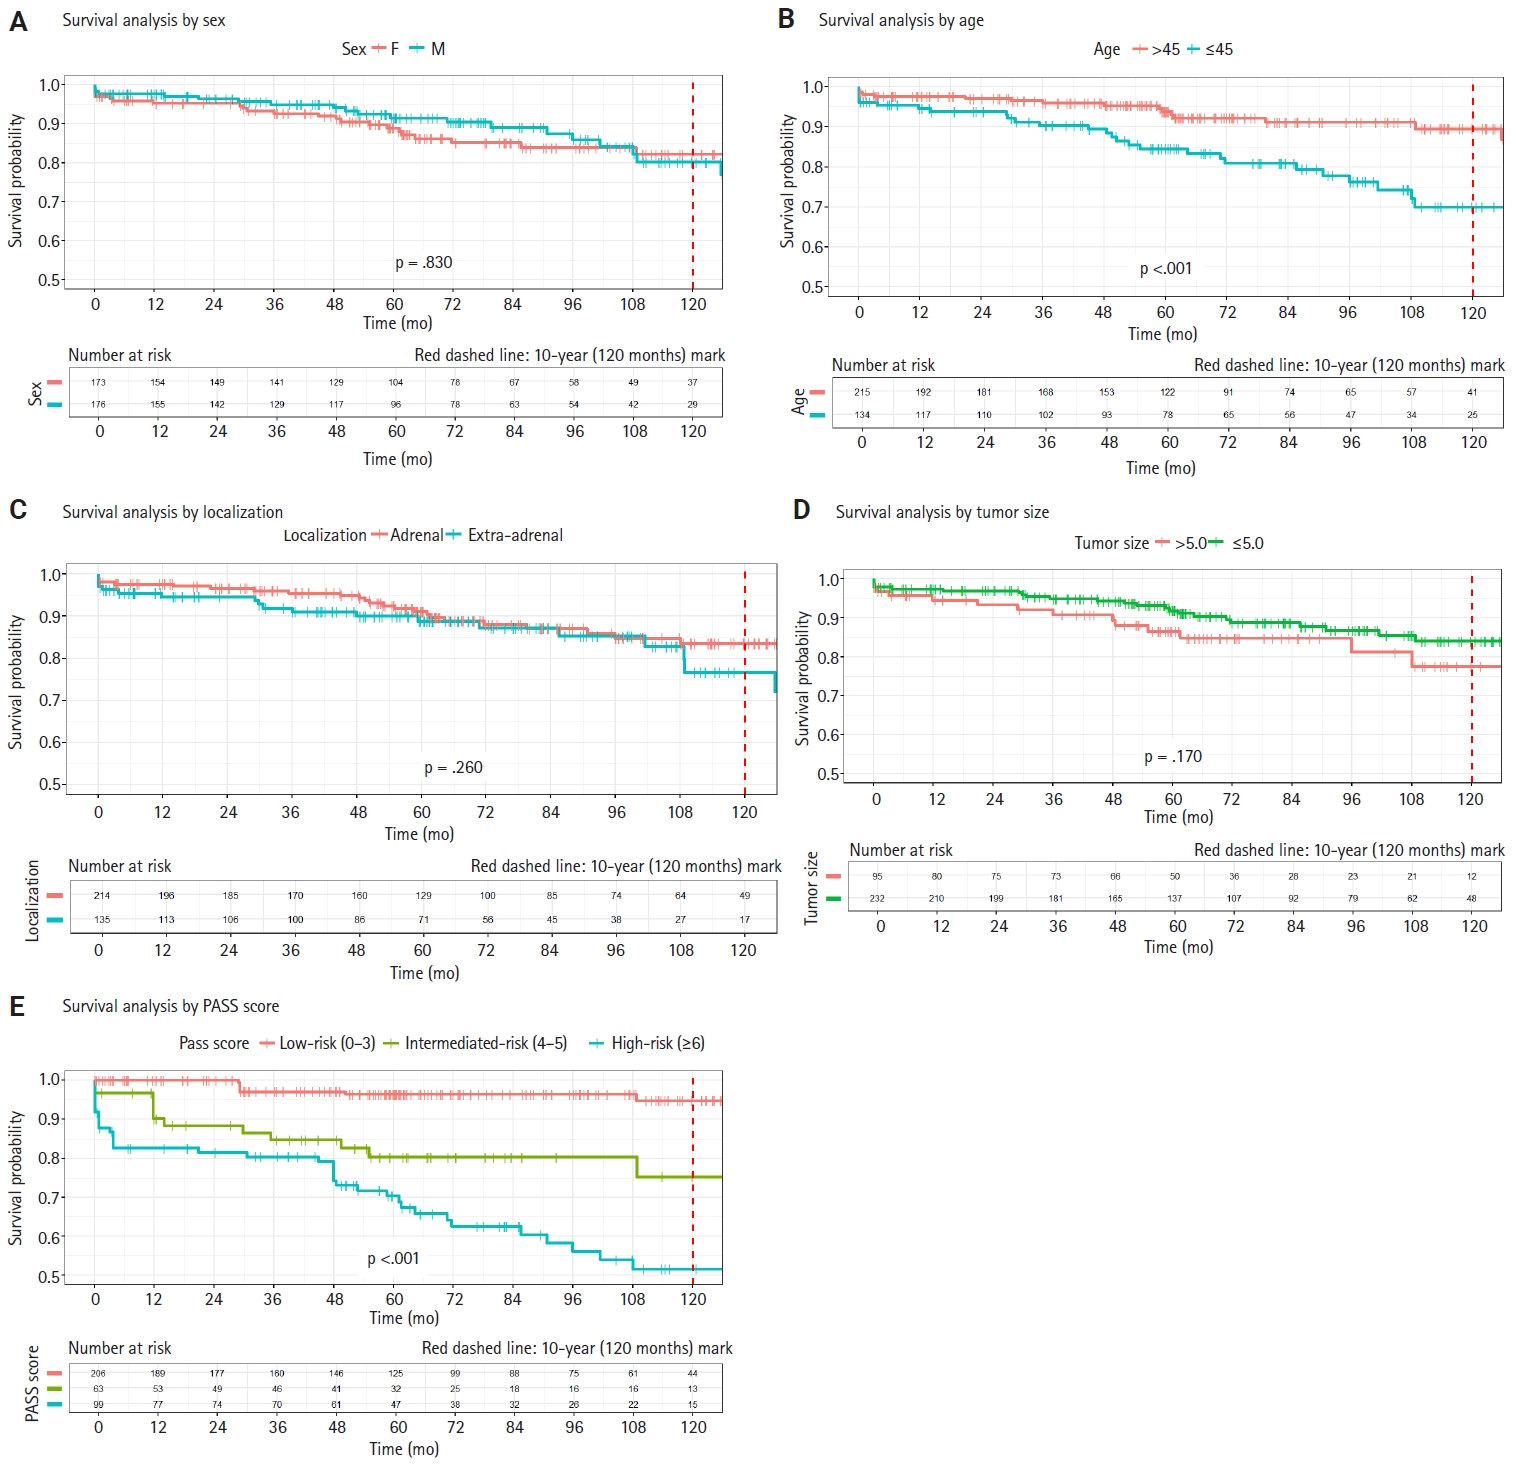
Kaplan-Meier survival curves for 363 cases with available survival data. Significant differences in survival were observed for age (B) and Pheochromocytoma of the Adrenal Gland Scaled Score (PASS) score (E) categories (p < .001, log-rank test). No statistically significant differences are found for sex (A), tumor localization (C), or tumor size (D).
Cox proportional hazards regression analysis for disease-free survival indicated that all variables except sex were statistically significant in univariable analysis (Table 3). In multivariable analysis, age (per 10 years) (hazard ratio [HR], 0.71; 95% CI, 0.60 to 0.83; p < .001), localization (extra-adrenal: HR, 2.96; 95% CI, 1.71 to 5.14; p < .001), and PASS category (intermediate risk [4–5]: HR, 6.12; 95% CI, 2.3 to 16.3; high risk [≥6]: HR, 12.5; 95% CI, 5.49 to 28.5; p < .001) remained significant. Both multivariable logistic regression and Cox proportional hazards analyses demonstrated the prognostic significance of histopathological grading systems.
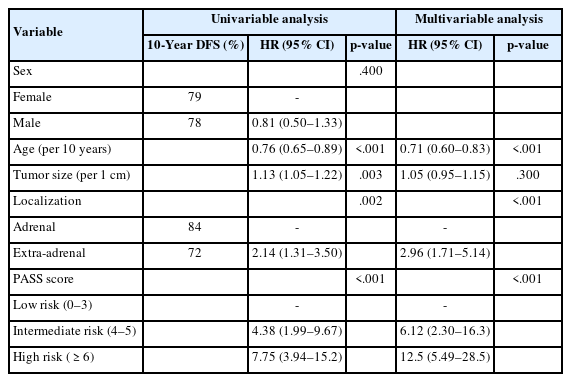
Cox proportional HR analysis for DFS
The screening role of PASS: high NPV offsets modest predictive performance
The predictive performance of the PASS score for adverse events was further evaluated using logistic regression-based receiver operating characteristic (ROC) curve analysis, as summarized in Fig. 2A. The PASS demonstrated an AUC of 0.673, sensitivity of 0.511, specificity of 0.836, NPV of 0.885, and positive predictive value (PPV) of 0.409. The grid plot demonstrated a low incidence of adverse events in the low-risk group (53 of 720 patients [7.4%]) and a comparatively higher incidence in both the intermediate-risk group (32 of 169 patients [18.9%]) and the high-risk group (59 of 190 patients [31.1%]) (Fig. 2B). Previous studies, including a recent meta-analysis, have also suggested that the high NPV of the PASS supports its utility as a screening tool for risk stratification in pheochromocytoma and PPGL [14]. Our findings are consistent with these prior reports, indicating that while the predictive accuracy of the PASS system alone may be suboptimal, its high NPV renders it a valuable prognostic grading system.
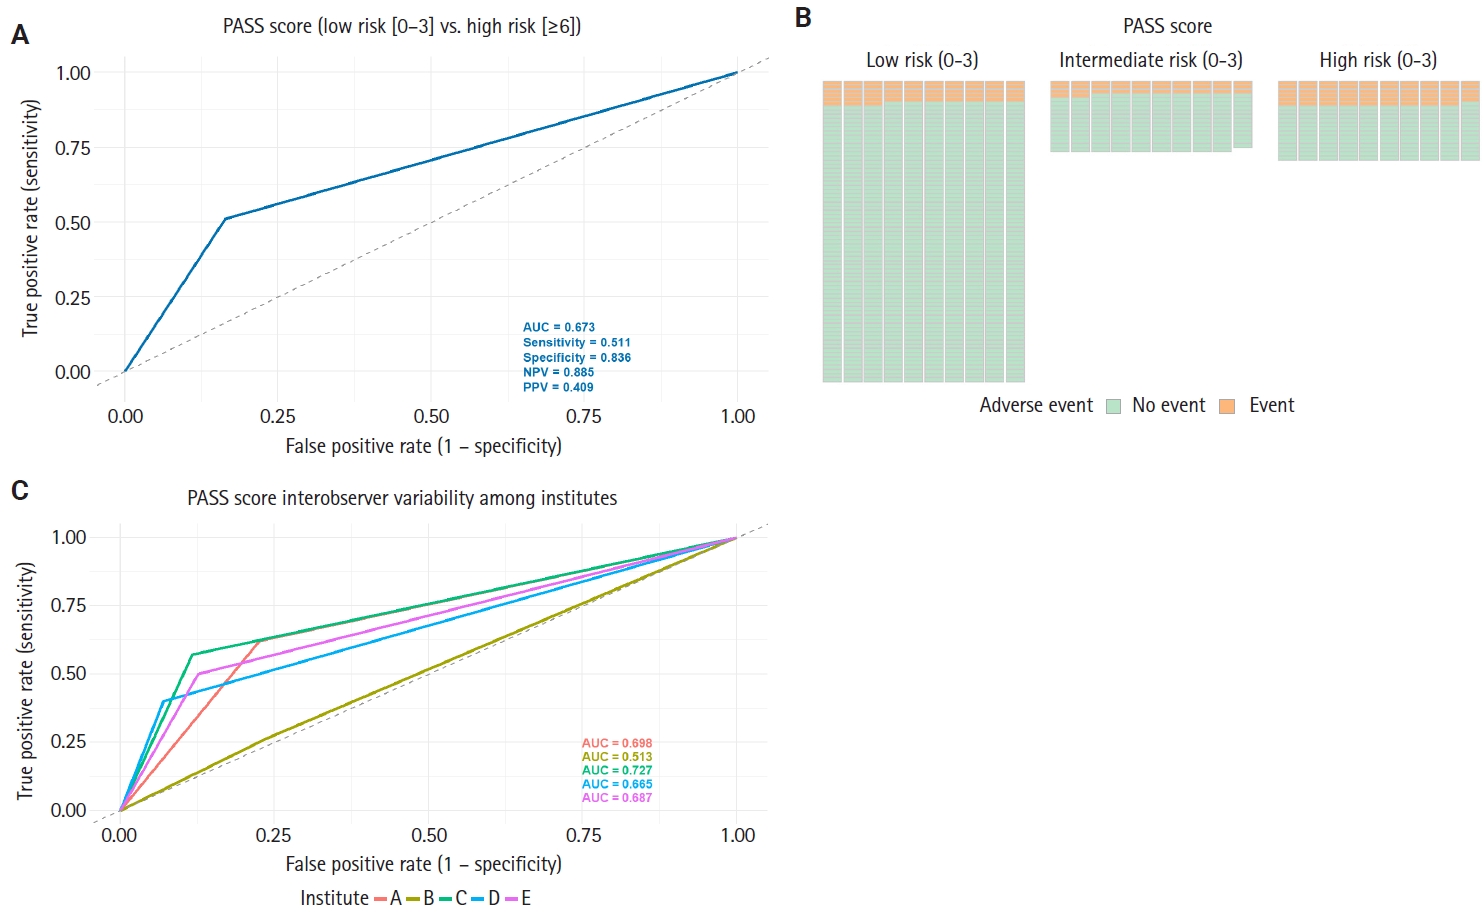
Predictive performance of Pheochromocytoma of the Adrenal Gland Scaled Score (PASS) for adverse events and its inter-observer variability. (A) Receiver operating characteristic (ROC) curve for the PASS score and (B) grid plot showing the distribution of adverse events by PASS risk group. (C) Comparison of the area under the ROC curve (AUC) for the PASS score across five institutions. Notable variability in AUC values illustrates inter-observer differences in predictive performance among centers. NPV, negative predictive value; PPV, positive predictive value.
Inter-observer variability of the PASS
The PASS is composed of multiple histopathological parameters, many of which lack quantitative or objective criteria. As a result, concerns have been raised regarding inter-observer variability in its application [8,9]. To further assess this issue, the predictive performance of the PASS for adverse events was evaluated across five different hospitals. The AUC for each institution was as follows: hospital A, 0.698; hospital B, 0.513; hospital C, 0.727; hospital D, 0.665; and hospital E, 0.687 (Fig. 2C). Pairwise DeLong tests revealed statistically significant differences in AUC between hospital A and hospital B, as well as between hospital B and hospital C (p < .05) (Table 4). These findings indirectly demonstrate inter-observer variability in the application of the PASS score, or at the very least, highlight discrepancies in its predictive performance among different institutions.
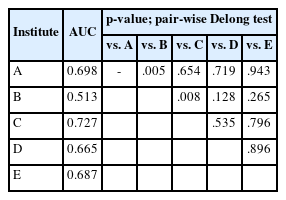
AUC of PASS score by institutes
The distribution of positive cases for each PASS parameter in the adverse event group revealed that nuclear pleomorphism, capsular invasion, and nuclear hyperchromasia were the most frequently observed features (Fig. 3A). Notably, when the proportion of each PASS parameter was further analyzed across the four participating institutes, substantial variation was observed in several parameters—including capsular invasion and nuclear hyperchromasia (Fig. 3B). These findings not only identify which parameters are most commonly seen in the adverse event group but also suggest inter-observer variability in PASS parameter assessment among institutions, underscoring the limitation of applying PASS.
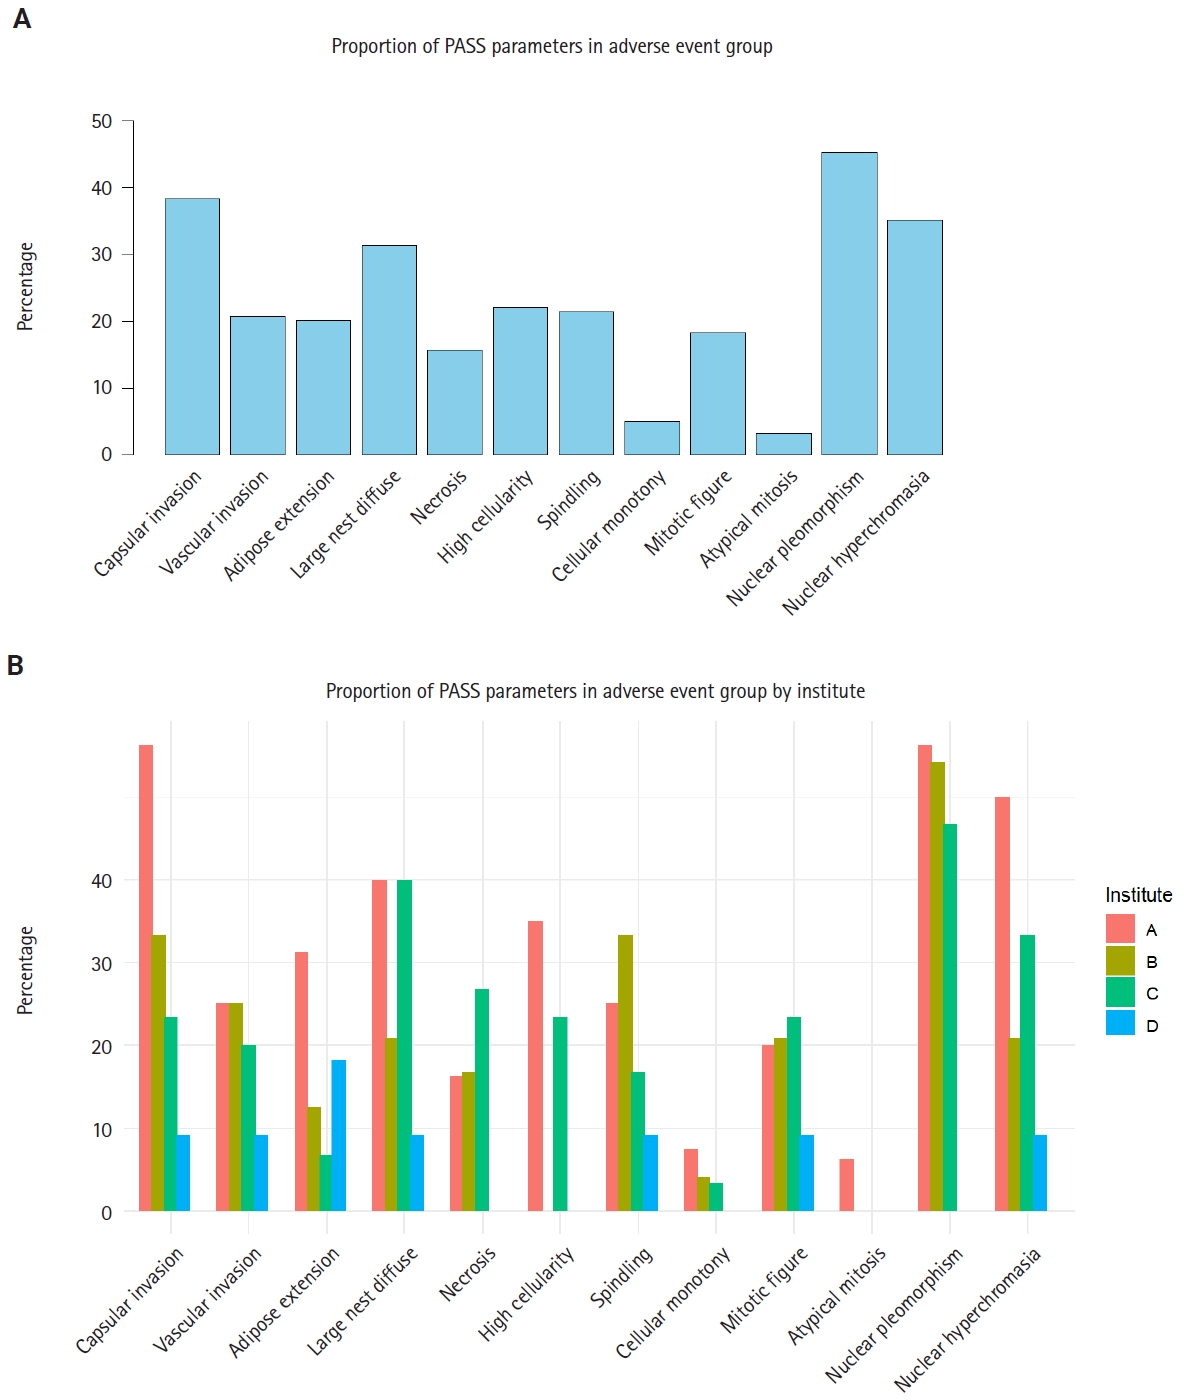
Proportion of Pheochromocytoma of the Adrenal Gland Scaled Score (PASS) parameters in adverse event group. (A) Proportion of positive cases for each PASS parameter in the adverse event group. Parameters are displayed in order of frequency across the entire cohort. (B) Proportion of positive cases for each PASS parameter in the adverse event group, stratified by institute. The variable distribution across centers highlights inter-observer variability.
Multivariable analysis of PASS parameters and development of the Simple PASS
Multivariable logistic regression analysis was conducted on 560 samples with available PASS parameter scoring to evaluate the association between individual PASS parameters and adverse events (Table 5). Among the PASS parameters, only confluent necrosis, tumor cell spindling, and mitotic figures (>3 per 10 high-power fields [HPF] were statistically significant. Specifically, confluent necrosis was associated with an OR of 3.38 (95% CI, 1.76 to 6.52; p < .001), tumor cell spindling with an OR of 1.89 (95% CI, 1.13 to 3.12; p =.016), and mitotic figures (>3/10 HPF) with an OR of 2.00 (95% CI, 1.10 to 3.58; p = .023). These three parameters were included in the 3-factor Simple PASS, while vascular invasion—despite its marginal significance (OR, 1.64; 95% CI, 0.94 to 2.83; p = .080)—was added to the 4-factor Simple PASS. This decision took into account that other scoring systems, such as GAPP (grading of adrenal pheochromocytoma and paraganglioma) and COPPS (COmposite Pheochromocytoma/paraganglioma Prognostic Score), also incorporate vascular invasion as a parameter [5,18].
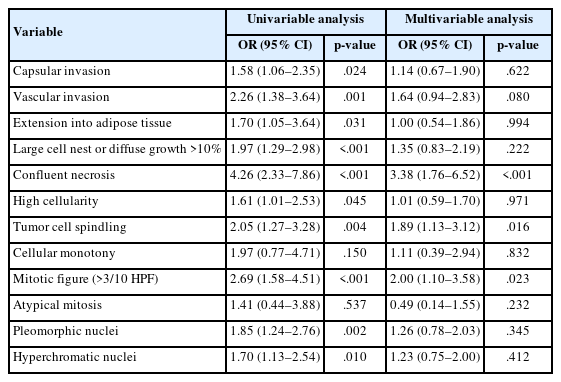
ORs of PASS parameter for adverse event
Based on these odds ratios, the 3-factor Simple PASS was developed by assigning 3 points to confluent necrosis, 2 points to spindling, and 2 points to increased mitotic figures. ROC curve analysis identified an optimal cut-off of 1 point according to the Youden index, indicating that the presence of any single parameter was sufficient to classify a case as high-risk. When high risk was defined as the presence of one or more parameters, subsequent ROC analysis yielded an AUC of 0.646, sensitivity of 0.519, specificity of 0.740, NPV of 0.837, and PPV of 0.374 (Fig. 4A). Furthermore, the 4-factor Simple PASS was created by adding vascular invasion, assigned one point, to the original 3-factor model. Using the same optimal cut-off of 1 point, as determined by the Youden index, ROC analysis demonstrated an AUC of 0.701, sensitivity of 0.497, specificity of 0.891, NPV of 0.938, and PPV of 0.374 (Fig. 4B). Notably, the 4-factor Simple PASS showed improved AUC, specificity, and NPV compared to the original PASS.
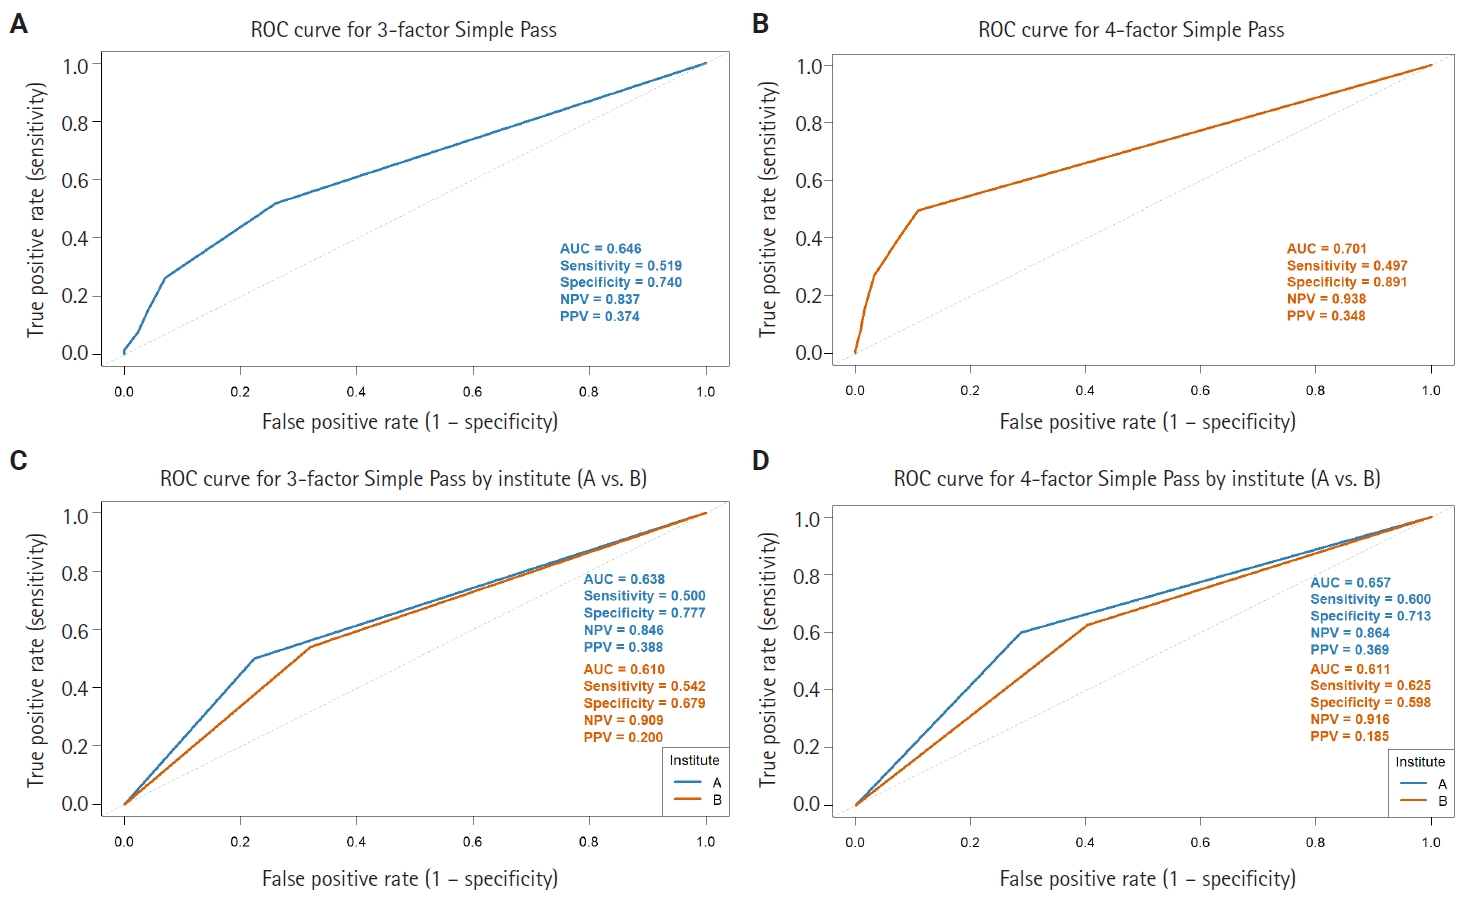
Simplified Pheochromocytoma of the Adrenal Gland Scaled Score (PASS) models. (A) Receiver operating characteristic (ROC) curve analysis of the 3-factor Simple PASS, constructed by only confluent necrosis, spindling, and high mitotic count (3>10 high-power fields). (B) ROC curve analysis of the 4-factor Simple PASS, adding vascular invasion to the 3-factor model. The 4-factor Simple PASS demonstrates improved area under the ROC curve (AUC), specificity, and negative predictive value compared to the original PASS system. (C, D) Comparison of the AUC for both Simple PASS systems between hospitals A and B. Unlike the original PASS system, the differences of AUC between the two institutions in both simplified models are not statistically significant, suggesting reduced inter-observer variability with the simplified scoring system. NPV, negative predictive value; PPV, positive predictive value.
When comparing the performance of the simplified PASS systems between hospitals A and B, the difference in AUC was less pronounced than that observed with the original PASS in both simplified models (Fig. 4C, D). Importantly, the difference in AUC between the two hospitals for the simplified PASS was not statistically significant (DeLong test p = .658 for the 3-factor model and .465 for the 4-factor model), in contrast to the significant difference observed with the original PASS score (p = .005). These findings suggest that applying the simplified PASS reduces inter-observer variability.
DISCUSSION
The clinical utility of the PASS system for risk stratification in PPGL has been demonstrated in numerous previous studies, supporting their roles as prognostic indicators for adverse clinical outcomes [10-14,16,22]. In the present multicenter study, we validated the prognostic impact of PASS using what is, to the best of our knowledge, the largest cohort to date. Our results align with prior research, confirming that PASS is associated with adverse events and RFS. Specifically, multivariable logistic regression analysis in our cohort of 1,518 cases revealed that age and PASS were independent predictors of adverse events, with age per 10 years having an OR of 0.68 (95% CI, 0.60 to 0.76; p < .001) and high-risk PASS scores (≥6) conferring an OR of 4.83 (95% CI, 3.12 to 7.50; p < .001). ROC curve analysis showed that the PASS score had an AUC of 0.673, sensitivity of 0.511, specificity of 0.836, and a notably high NPV of 0.885. These findings are consistent with previous meta-analyses and large-scale studies, which have emphasized the high NPV of the PASS as a screening tool, despite its modest overall discriminative performance [5,12-14]. The association between younger age and adverse events may be explained by the fact that adverse events often involve multiplicity, and younger patients are more likely to carry germline mutations and exhibit multiplicity [23-25]. Further studies are warranted to precisely define adverse events using genetic profiles, to distinguish true adverse events from mere multiplicity.
A major advantage of the PASS system is its simplicity and cost-effectiveness, as it can be assessed solely on histopathological grounds without the need for additional molecular or clinical data [5,12]. However, the PASS system incorporates numerous parameters, many of which lack quantitative definitions, leading to substantial inter-observer variability [6-9]. This issue has been widely recognized in the literature, and our multicenter analysis provides further robust evidence that both the diagnostic validity and interpretative application of the PASS score are subject to considerable variability across institutions. Specifically, diagnostic performance as measured by AUC ranged from 0.513 to 0.727 among the five participating centers, with statistically significant pairwise differences observed in certain comparisons. Furthermore, our detailed exploration of individual PASS parameters demonstrated substantial heterogeneity in their assessment: for instance, capsular invasion and nuclear hyperchromasia showed pronounced discrepancies in the proportion of positive cases among centers. Such inter-institutional differences are likely attributable to variability in pathologists’ interpretation and implementation of the PASS criteria. These results underscore the persistent challenge of inter-observer variability.
In response to the limitations of the PASS, several alternative grading systems have been introduced, including the GAPP and other composite models [15-18]. However, each of these systems has its own constraints, such as limited validation, reliance on additional clinical or biochemical data, or continued subjectivity in parameter assessment. Despite these limitations, the PASS remains a valuable screening tool due to its high NPV, and ease of use based solely on histopathology [14].
To address inter-observer variability and improve the prognostic performance of PASS, we conducted multivariable analysis to identify the parameters most strongly associated with adverse events. Based on these results and previous studies, confluent necrosis, tumor cell spindling, and increased mitotic figures (>3/10 HPF) were incorporated into a 3-factor simplified PASS scoring system, while vascular invasion was additionally included to develop a 4-factor simplified PASS. Notably, the 4-factor model—where single presence of vascular invasion, necrosis, spindling and increased mitosis can be assigned as high-risk group—demonstrated improved AUC (0.701), specificity (0.891), and NPV (0.938) compared to the original PASS score, despite the reduced number of parameters. Furthermore, when comparing the performance of both simplified PASS systems between hospitals A and B, the difference in AUC was not statistically significant, suggesting reduced inter-observer variability relative to the original PASS system.
This study has several limitations. First, we did not review pathological slides or revise the initially diagnosed PASS to avoid retrospective bias, as the main goal of this study was to evaluate how well the PASS system performs in real-world practice with respect to diagnostic accuracy and inter-observer variability. During data collection, we realized that the absence of a refined consensus on the definitions of each parameter might have contributed to inter-observer variability, underscoring the high demand for precise and standardized definitions of each factor. As a multicenter retrospective analysis, the completeness and consistency of data collection may be suboptimal. While the relationship between PASS score and adverse events was the primary focus, survival data and detailed PASS parameter information was limited, resulting in smaller sample sizes (n = 560) for some analyses. Furthermore, we did not directly assess inter-observer agreement by having multiple pathologists independently review the same slides; rather, we inferred variability indirectly by comparing AUCs for adverse event prediction across institutions. Future studies should incorporate direct inter-observer concordance assessments to more precisely quantify variability. Another limitation concerns the definition of adverse events. Given that PPGL can arise anywhere along the paraganglionic system, distinguishing between multifocality, metastasis, and recurrence can be challenging, and these categories may overlap biologically [26,27]. We included multifocal tumors as adverse events but recognize that their biological behavior may differ from truly metastatic or recurrent tumors, potentially diminishing the predictive power of the PASS [28,29]. Additionally, previous studies suggest patients with germline mutations are more prone to multifocal PPGL, and immunohistochemistry (IHC) for S-100 and SOX-10 can be used to distinguish metastasis from multifocal tumors [18,23-25]. Taken together, future research should incorporate genetic data and additional IHC study to distinguish multifocal cases from metastasis and refine the definition of adverse events accordingly.
In conclusion, this study validates the prognostic impact of the PASS in the largest cohort of PPGL patients to date, confirming the high NPV and screening potential of the PASS. However, significant inter-observer variability remains a major challenge. Efforts to reduce this variability—such as enhanced training for pathologists and simplification of the PASS system—are warranted. Our findings highlight the importance of focusing on key histopathological parameters and support ongoing initiatives to streamline and standardize risk stratification in paraganglioma.
Notes
Ethics Statement
The study protocol was approved by the Institutional Review Board of Seoul National University Hospital (IRB no. H-2108-062-1243) and conducted in accordance with the principles of the Declaration of Helsinki. Formal written informed consent was not required with a waiver by the appropriate IRB and/or national research ethics committee.
Availability of Data and Material
Data supporting the findings of this study are available from the corresponding author on reasonable request.
Code Availability
Not applicable.
Author Contributions
Conceptualization: SJ, JKW. Formal analysis: SJ. Investigation: all authors. Methodology: SJ, JKW. Project Administration: CKJ. Supervision: JKW, KCJ. Visualization: SJ. Writing—original draft: SJ. Writing—review and editing: JKW, KCJ. Approval of final manuscript: all authors.
Conflicts of Interest
C.K.J. and S.Y.P., the editors-in-chief and S.W.H., contributing editor of the Journal of Pathology and Translational Medicine, were not involved in the editorial evaluation or decision to publish this article. All remaining authors have declared no conflicts of interest.
Funding Statement
This research was supported by The Korean Society of Pathologists Grant No. KSPG2021-01.