E-submission
Articles
- Page Path
- HOME > J Pathol Transl Med > Volume 48(1); 2014 > Article
-
Original Article
Altered Expression of PTEN and Its Major Regulator MicroRNA-21 in Pulmonary Neuroendocrine Tumors - Hyoun Wook Lee, Seung Yeon Ha1, Mee Sook Roh2
-
Korean Journal of Pathology 2014;48(1):17-23.
DOI: https://doi.org/10.4132/KoreanJPathol.2014.48.1.17
Published online: February 25, 2014
Department of Pathology, Samsung Changwon Hospital, Sungkyunkwan University School of Medicine, Changwon, Korea.
1Department of Pathology, Gachon University Gil Medical Center, Incheon, Korea.
2Department of Pathology, Dong-A University College of Medicine, Busan, Korea.
- Corresponding Author: Mee Sook Roh, M.D. Department of Pathology, Dong-A University College of Medicine, 26 Daesingongwon-ro, Seo-gu, Busan 602-715, Korea. Tel: +82-51-240-2833, Fax: +82-51-243-7396, 'msroh@dau.ac.kr'
• Received: December 24, 2013 • Revised: January 27, 2014 • Accepted: January 27, 2014
© 2014 The Korean Society of Pathologists/The Korean Society for Cytopathology
This is an Open Access article distributed under the terms of the Creative Commons Attribution Non-Commercial License (http://creativecommons.org/licenses/by-nc/3.0/) which permits unrestricted non-commercial use, distribution, and reproduction in any medium, provided the original work is properly cited.
Abstract
-
Background
- Phosphatase and tensin homolog on chromosome ten (PTEN) is one of the most frequently inactivated tumor suppressors in various tumor types. MicroRNA-21 (miR-21) may affect tumor progression by post-transcriptional repression of expression of tumor suppressors, such as PTEN. This study was conducted to evaluate the significance of PTEN expression in pulmonary neuroendocrine (NE) tumors and to analyze the relationship between PTEN and miR-21 expressions.
-
Methods
- Expressions of PTEN and miR-21 were investigated by immunohistochemistry and real time reverse transcription-polymerase chain reaction, respectively, in 75 resected pulmonary NE tumors (23 typical carcinoids [TCs], nine atypical carcinoids [ACs], 22 large cell NE carcinomas [LCNECs], and 21 small cell lung carcinomas [SCLCs]).
-
Results
- Loss of PTEN expression was observed in four of 23 TCs (17.4%), four of nine ACs (44.4%), 16 of 22 LCNECs (72.7%) and nine of 21 SCLCs (42.9%) (p=.025). The expression level of miR-21 was significantly higher in high-grade NE carcinomas than in carcinoid tumors (p<.001). PTEN expression was inversely correlated with miR-21 expression (p<.001).
-
Conclusions
- This study suggests that aberrant expression of PTEN in relation to miR-21 may represent an important step in the development and progression of pulmonary NE tumors.
- Case selection
- We evaluated a total of 75 cases that had the histologic diagnosis of primary pulmonary NE tumor. The tissues were obtained from patients who underwent surgery between 2003 and 2012 at three university hospitals, including Samsung Changwon Hospital, Gachon University Gil Medical Center, and Dong-A University Medical Center. For an accurate histologic diagnosis of pulmonary NE tumors, hamatoxylin and eosin-stained slides from each case were reviewed by two experienced pulmonary pathologists (S.Y.H and M.S.R) based on the revised World Health Organization (WHO) classification in 2004,19 and only unequivocal cases were used. To demonstrate the NE phenotype, immunohistochemical staining for general NE markers, such as chromogranin-A, synaptophysin, and CD56 was performed, if necessary. The tumors were diagnosed as 23 TCs, nine ACs, 22 LCNECs, and 21 SCLCs. The Institutional Review Board of each institute approved our study and written informed consent was obtained from all the patients before surgery to permit the use of their resected samples for research.
- Immunohistochemical analysis of PTEN expression
- Immunohistochemical staining for PTEN was performed on formalin-fixed, paraffin-embedded (FFPE), 4 µm-thick tissue microarray (TMA) sections using the avidin-biotin-peroxidase complex method. For all TMAs, three cores of different areas from the representative tumor were removed from each case, and these were put in a new blank recipient paraffin block according to a previously described method.22 All sections were deparaffinized in a series of xylene baths, and rehydration was performed with a series of graded alcohol solutions. To enhance immunoreactivity, microwave antigen retrieval was performed at 750 W for 30 minutes in Tris-ethylenediaminetetraacetic acid buffer (pH 9.0). After blocking endogenous peroxidase activity with 5% hydrogen peroxidase for 10 minutes, the sections were incubated for one hour at room temperature with a mouse monoclonal antibody against PTEN (1:50, 6H2.1, Millipore, Billerica, MA, USA). An Envision Chem Detection Kit (DakoCytomation, Carpinteria, CA, USA) was used for the secondary antibody at room temperature for 30 minutes. After washing the tissue samples in Tris buffered saline for 10 minutes, 3,3'-diaminobenzidine was used as a chromogen, and Mayer's hematoxylin counterstain was then applied. As positive control, normal breast tissue with previously confirmed PTEN expression, was used in all TMAs. Negative control was obtained by substituting primary antibody with buffer.
- The percentage and intensity of immunoreactive tumor cells in each core were recorded, and the final value of the positive tumor cells was determined as the mean immunoreactivity of the three cores. PTEN immunoreactivity was defined as those showing a cytoplasmic with/without nuclear staining pattern of the tumor tissue with minimal staining of the background. Grading of PTEN immunoreactivity was based on the distribution and intensity of staining according to a previously described method.23,24 Distribution was scored as 0 (<5%), 1 (5-40%), 2 (41-70%), or 3 (>70%) to indicate the percentage of positive cells of interest. The intensity of the signal was scored as 0 (no signal), 1 (weak expression), 2 (moderate expression), or 3 (strong expression). The tumors with a multiplied score exceeding 6 were recorded as having positive immunoreactivity for PTEN; all other scores were considered to have loss of PTEN expression. The immunostained sections were assessed by two independent pathologists (H.W.L and M.S.R) without any knowledge of pathological information on the cases, and any discrepancies were resolved by consensus.
- Real time reverse transcription-polymerase chain reaction for miR-21 expression
- The detailed real time reverse transcription-polymerase chain reaction (RT-PCR) for miR-21 expression was previously described.21 Briefly, total RNA was extracted from the representative FFPE tissue sections using the Ambion RecoverAll Total Nucleic Acid Isolation Kit (Applied Biosystems, Foster City, CA, USA). The quality and quantity of the isolated total RNA were measured using a NanoDrop ND-1000 spectrophotometer (Thermo Fisher Scientific, Rockford, IL, USA). The real time RT-PCR for miR-21 expression was analyzed using the TaqMan miRNA RT kit with specifically designed stem-loop RT primers for miR-21 according to the manufacturer's instructions and ABI PRISM 7000 Sequence Detection System (Applied Biosystems). We also quantified the transcripts of U6 small nuclear RNA (U6) as an endogenous control for normalizing the levels of miR-21. All experiments were performed in duplicate to confirm reproducibility. Following amplification, the mean threshold cycle (Ct) values of each sample were determined from duplicate reactions and then normalized against the corresponding U6 Ct values, which were calculated as delta Ct (ΔCt=CtmiR-21-CtU6). All data presented were normalized to Ct (ΔCt) values.
- Statistical analysis
- Statistical analysis was performed using SPSS ver. 18.0 (SPSS Inc., Chicago, IL, USA). The correlation between PTEN expression and histologic subtypes of pulmonary NE tumors were analyzed using a contingency table and Bonferroni correction chi-square or Fisher's exact test. One way analysis of variance with a post hoc of Scheffe test was used to determine the association between the expression levels of miR-21 and histologic subtypes of pulmonary NE tumors or PTEN expression. A p<.05 was considered statistically significant.
MATERIALS AND METHODS
- Differential expression of PTEN according to the histologic subtypes of pulmonary NE tumors
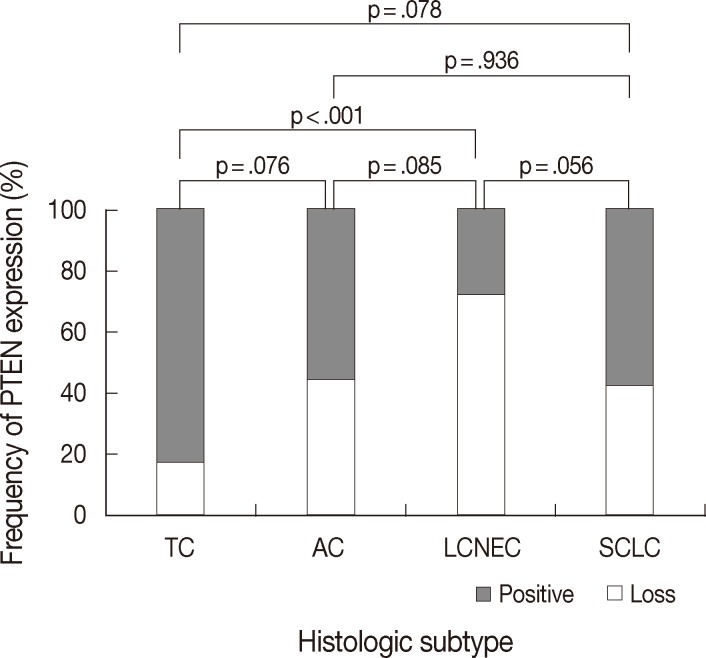
- PTEN immunoreactivity was observed both in the cytoplasm and nuclei, where cytoplasmic staining was predominant in most cases. All cores for each tumor demonstrated similar staining characteristics. Loss of PTEN expression was observed in four of 23 TCs (17.4%), four of nine ACs (44.4%), 16 of 22 LCNECs (72.7%), and nine of 21 SCLCs (42.9%) (p=.025) (Fig. 1). The frequency of PTEN expression was clearly different between the histologic subtypes of pulmonary NE tumors (p=.025) (Table 1). In pairwise comparison, the frequency of loss of PTEN expression was significantly different between TC and LCNEC (p<.001). Although the p-value did not reach statistical significance, the frequency of loss of PTEN expression tended to be higher in AC than in TC (p=.076), in SCLC than in TC (p=.078), and in LCNEC than in AC (p=.085). In particular, the difference in loss of PTEN expression between SCLC and LCNEC was marginally significant (p=.056). However, there was no significant difference between AC and SCLC (p=.936) (Fig. 2). Although the frequency of loss of PTEN expression was significantly higher in high-grade NE carcinomas than in carcinoid tumors (p=.005), it was significantly higher in LCNEC than in carcinoid tumors (p<.001), whereas there was no significant difference between carcinoid tumors and SCLC (p=.193).
- Differential expression of miR-21 according to the histologic subtypes of pulmonary NE tumors
- MiR-21 was consistently overexpressed in all subtypes of pulmonary NE tumors. The mean ΔCt values±standard deviation (SD) for miR-21 expression were -4.13±1.67 in TC, -4.66±1.39 in AC, -6.35±1.30 in LCNEC, and -6.12±1.27 in SCLC. The expression level of miR-21 was clearly different between the histologic subtypes of pulmonary NE tumors (p<.001) (Table 1). In pairwise comparison, the expression level of miR-21 was significantly higher in high-grade NE carcinomas than in carcinoid tumors (p<.001). Furthermore, the expression level of miR-21 was significantly higher in LCNEC than in TC (p<.001), in SCLC than in TC (p<.001), and in LCNEC than in AC (p=.037). However, no difference was found between TC and AC (p=.824) and between LCNEC and SCLC (p=.965) (Fig. 3). All these findings were similar to our previous study performed on a smaller number of specimens,21 except for no significant difference between AC and SCLC (p=.069 in present study vs p=.044 in previous study).
- Correlation between PTEN and miR-21 expressions in pulmonary NE tumors
- The mean ΔCt values for miR-21 expression was higher in tumors with loss of PTEN expression (mean±SD, -6.11±1.52) than that in tumors with positive PTEN expression (mean±SD, -4.81±1.62). PTEN expression showed an inverse correlation with miR-21 expression in pulmonary NE tumor tissues (p<.001). According to histologic subtypes, a statistically significant inverse correlation was observed between miR-21 and PTEN protein in TC (p=.014) and LCNEC (p=.005), whereas no similar correlation was found in either AC (p=.487) or SCLC (p=.086) (Table 2).
RESULTS
- To the best of our knowledge, this work represents the first study to investigate the differential expression of PTEN in relation to miR-21 expression in pulmonary NE tumors. The results of our study suggest that the expression levels of PTEN and miR-21 were different depending on the histologic subtypes of pulmonary NE tumors. Furthermore, PTEN expression had an inverse correlation with miR-21 expression in pulmonary NE tumor tissues.
- PTEN is one of the most frequently inactivated tumor suppressors in different tumor types. Loss of PTEN expression is associated with lymph node metastasis, tumor grade, and stage in several different human malignancies.4-9 However, current literature on PTEN expression in pulmonary NE tumors is limited, and the immunohistochemical expression patterns of PTEN in NE tumors of other organs have been reported in only a few studies.23 Loss of PTEN expression was significantly more frequent in patients with advanced WHO grade and in patients with higher Ki-67 index in pancreatic NE tumors.23 In our study, the frequency of loss of PTEN expression was clearly different between the histologic subtypes of pulmonary NE tumors. Interestingly, although the p-value did not reach statistical significance, the frequency of loss of PTEN expression tended to be higher in LCNEC than in SCLC (p=.056).
- miR-21 is one of the most prominent miRNAs implicated in many human cancers including the lung and has been associated with poor survival and poor therapeutic outcome.8,13-17,25,26 Xiong et al.27 suggested that higher expression levels of miR-21 in adenomas and carcinomas relative to normal surrounding colonic tissue represents an early cellular event in the progression to cancer. The present findings and our previous results21 show that miR-21 is consistently overexpressed in all subtypes of pulmonary NE tumors. Furthermore, the expression level of miR-21 was significantly higher in high-grade NE carcinomas than in carcinoid tumors. These findings suggest that altered expression of miR-21 may be an early event underlying early tumorigenesis of pulmonary NE tumors and could be pivotal in progressing to a complete malignant phenotype.
- It has been demonstrated that miRNA can induce tumorigenesis, for example, by downregulating tumor suppressor genes.13-17,28 It has been reported that PTEN, an important tumor suppressor, is regulated by multiple miRNAs including miR-21 in various cancers.8,13-15,27,29 Zhou et al.29 reported that miR-21 overexpression drastically inhibited PTEN protein expression and that silencing of miR-21 increased the level of PTEN protein in cancer stem-like cells in hepatocellular carcinoma. They also found that migration and invasiveness of these cells weakened by anti-miR-21 was rescued by knockdown of PTEN, PDCD4, or RECK. miR-21 inhibitor transfection increased the luciferase-reporter activity of the PTEN-3'-UTR construct and increased PTEN protein levels but not PTEN mRNA levels in NSCLC cell lines.8 In our present study, we also found an inverse correlation between miR-21 and PTEN expressions in pulmonary NE tumor tissues. In this context, PTEN may be the target of miR-21, and inactivating PTEN in relation to miR-21 upregulation might play an important role in the development of pulmonary NE tumors. However, miR-21 and PTEN expressions demonstrated no negative correlation, especially in SCLC, in contrast to LCNEC. These findings further suggest that miR-21, along with its different mechanisms and targets and a few associated genes, forms complex regulatory networks and mechanisms that play an important role in mediating SCLC formation, growth, and progression. Further functional analysis of other target molecules regulated by miR-21 could be of help to clarify the different biological characteristics of LCNECs and SCLCs.
- In conclusion, this study suggests that aberrant expression of PTEN and miR-21 may represent an important step in the development and progression of pulmonary NE tumors. Moreover, differential expression of PTEN and miR-21 according to histological subtypes of pulmonary NE tumors can be used as an adjunctive diagnostic tool or biomarker. However, further studies with a large number of cases, especially ones including more ACs, are needed to validate our findings. An understanding of the molecular mechanisms affecting PTEN and miR-21 expression in relation to the PI3K-AKT-mTOR signaling pathway will also be essential in designing a new alternative therapeutic target for pulmonary NE tumors.
DISCUSSION
Acknowledgments
Acknowledgments
- 1. Maehama T, Dixon JE. The tumor suppressor, PTEN/MMAC1, dephosphorylates the lipid second messenger, phosphatidylinositol 3,4,5-trisphosphate. J Biol Chem 1998; 273: 13375–13378. PMID: 9593664. ArticlePubMed
- 2. Stambolic V, Suzuki A, de la Pompa JL, et al. Negative regulation of PKB/Akt-dependent cell survival by the tumor suppressor PTEN. Cell 1998; 95: 29–39. PMID: 9778245. ArticlePubMed
- 3. Tamura M, Gu J, Matsumoto K, Aota S, Parsons R, Yamada KM. Inhibition of cell migration, spreading, and focal adhesions by tumor suppressor PTEN. Science 1998; 280: 1614–1617. PMID: 9616126. ArticlePubMed
- 4. Lee JI, Soria JC, Hassan KA, et al. Loss of PTEN expression as a prognostic marker for tongue cancer. Arch Otolaryngol Head Neck Surg 2001; 127: 1441–1445. PMID: 11735811. ArticlePubMed
- 5. Depowski PL, Rosenthal SI, Ross JS. Loss of expression of the PTEN gene protein product is associated with poor outcome in breast cancer. Mod Pathol 2001; 14: 672–676. PMID: 11454999. ArticlePubMed
- 6. McMenamin ME, Soung P, Perera S, Kaplan I, Loda M, Sellers WR. Loss of PTEN expression in paraffin-embedded primary prostate cancer correlates with high Gleason score and advanced stage. Cancer Res 1999; 59: 4291–4296. PMID: 10485474. PubMed
- 7. Tachibana M, Shibakita M, Ohno S, et al. Expression and prognostic significance of PTEN product protein in patients with esophageal squamous cell carcinoma. Cancer 2002; 94: 1955–1960. PMID: 11932897. ArticlePubMed
- 8. Zhang JG, Wang JJ, Zhao F, Liu Q, Jiang K, Yang GH. MicroRNA-21 (miR-21) represses tumor suppressor PTEN and promotes growth and invasion in non-small cell lung cancer (NSCLC). Clin Chim Acta 2010; 411: 846–852. PMID: 20223231. ArticlePubMed
- 9. Zhu X, Qin X, Fei M, et al. Loss and reduced expression of PTEN correlate with advanced-stage gastric carcinoma. Exp Ther Med 2013; 5: 57–64. PMID: 23251242. ArticlePubMed
- 10. Marsit CJ, Zheng S, Aldape K, et al. PTEN expression in non-small-cell lung cancer: evaluating its relation to tumor characteristics, allelic loss, and epigenetic alteration. Hum Pathol 2005; 36: 768–776. PMID: 16084946. ArticlePubMed
- 11. Forgacs E, Biesterveld EJ, Sekido Y, et al. Mutation analysis of the PTEN/MMAC1 gene in lung cancer. Oncogene 1998; 17: 1557–1565. PMID: 9794233. ArticlePubMed
- 12. Bartel DP. MicroRNAs: genomics, biogenesis, mechanism, and function. Cell 2004; 116: 281–297. PMID: 14744438. ArticlePubMed
- 13. Meng F, Henson R, Wehbe-Janek H, Ghoshal K, Jacob ST, Patel T. MicroRNA-21 regulates expression of the PTEN tumor suppressor gene in human hepatocellular cancer. Gastroenterology 2007; 133: 647–658. PMID: 17681183. ArticlePubMedPMC
- 14. Meng F, Henson R, Lang M, et al. Involvement of human micro-RNA in growth and response to chemotherapy in human cholangiocarcinoma cell lines. Gastroenterology 2006; 130: 2113–2129. PMID: 16762633. ArticlePubMed
- 15. Zhang BG, Li JF, Yu BQ, Zhu ZG, Liu BY, Yan M. MicroRNA-21 promotes tumor proliferation and invasion in gastric cancer by targeting PTEN. Oncol Rep 2012; 27: 1019–1026. PMID: 22267008. ArticlePubMedPMC
- 16. Gabriely G, Wurdinger T, Kesari S, et al. MicroRNA 21 promotes glioma invasion by targeting matrix metalloproteinase regulators. Mol Cell Biol 2008; 28: 5369–5380. PMID: 18591254. ArticlePubMedPMC
- 17. Asangani IA, Rasheed SA, Nikolova DA, et al. MicroRNA-21 (miR-21) post-transcriptionally downregulates tumor suppressor Pdcd4 and stimulates invasion, intravasation and metastasis in colorectal cancer. Oncogene 2008; 27: 2128–2136. PMID: 17968323. ArticlePubMed
- 18. Fei J, Lan F, Guo M, Li Y, Liu Y. Inhibitory effects of anti-miRNA oligonucleotides (AMOs) on A549 cell growth. J Drug Target 2008; 16: 688–693. PMID: 18982517. ArticlePubMed
- 19. Travis WD, Brambilla E, Müller-Hermelink HK, Harris CC. World Health Organization classification of tumours: pathology and genetics of tumours of the lung, pleura, thymus and heart. Lyon: IARC Press, 2004.
- 20. Swarts DR, Ramaekers FC, Speel EJ. Molecular and cellular biology of neuroendocrine lung tumors: evidence for separate biological entities. Biochim Biophys Acta 2012; 1826: 255–271. PMID: 22579738. ArticlePubMed
- 21. Lee HW, Lee EH, Ha SY, et al. Altered expression of microRNA miR-21, miR-155, and let-7a and their roles in pulmonary neuroendocrine tumors. Pathol Int 2012; 62: 583–591. PMID: 22924844. ArticlePubMed
- 22. Choi CH, Kim KH, Song JY, et al. Construction of high-density tissue microarrays at low cost by using self-made manual microarray kits and recipient paraffin blocks. Korean J Pathol 2012; 46: 562–568. PMID: 23323107. ArticlePubMedPMC
- 23. Han X, Ji Y, Zhao J, Xu X, Lou W. Expression of PTEN and mTOR in pancreatic neuroendocrine tumors. Tumour Biol 2013; 34: 2871–2879. PMID: 23686804. ArticlePubMed
- 24. Ahn S, Hwangbo W, Kim H, Kim CH. Naked cuticle Drosophila 1 expression in histologic subtypes of small adenocarcinoma of the lung. Korean J Pathol 2013; 47: 211–218. PMID: 23837013. ArticlePubMedPMC
- 25. Volinia S, Calin GA, Liu CG, et al. A microRNA expression signature of human solid tumors defines cancer gene targets. Proc Natl Acad Sci U S A 2006; 103: 2257–2261. PMID: 16461460. ArticlePubMedPMC
- 26. Markou A, Tsaroucha EG, Kaklamanis L, Fotinou M, Georgoulias V, Lianidou ES. Prognostic value of mature microRNA-21 and microRNA-205 overexpression in non-small cell lung cancer by quantitative real-time RT-PCR. Clin Chem 2008; 54: 1696–1704. PMID: 18719201. ArticlePubMed
- 27. Xiong B, Cheng Y, Ma L, Zhang C. MiR-21 regulates biological behavior through the PTEN/PI-3 K/Akt signaling pathway in human colorectal cancer cells. Int J Oncol 2013; 42: 219–228. PMID: 23174819. ArticlePubMed
- 28. Gregory RI, Shiekhattar R. MicroRNA biogenesis and cancer. Cancer Res 2005; 65: 3509–3512. PMID: 15867338. ArticlePubMed
- 29. Zhou L, Yang ZX, Song WJ, et al. MicroRNA-21 regulates the migration and invasion of a stem-like population in hepatocellular carcinoma. Int J Oncol 2013; 43: 661–669. PMID: 23708209. ArticlePubMed
References
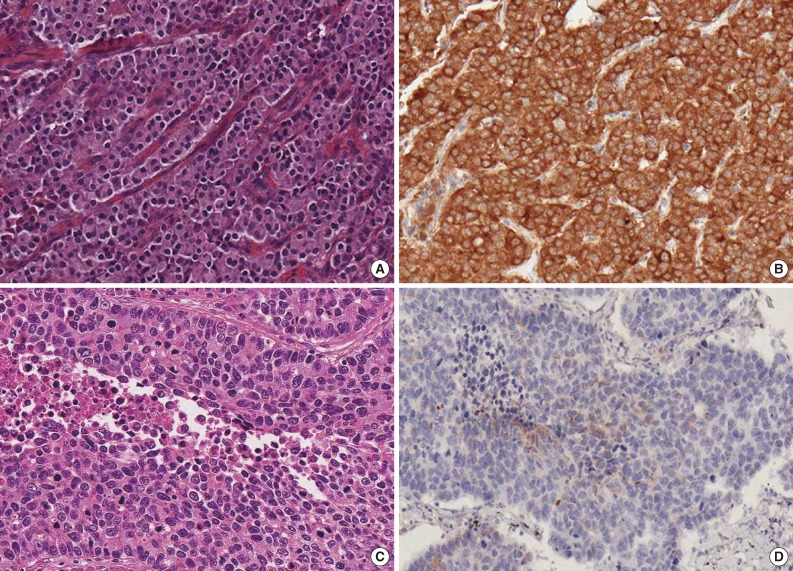
Fig. 1Representative histologic features and immunohistochemical findings for phosphatase and tensin homolog on chromosome ten (PTEN) of typical carcinoid (TC) and large cell neuroendocrine carcinoma (LCNEC). A TC (A) shows positive expression of PTEN (B), whereas a LCNEC (C) shows loss of PTEN expression (D).

Fig. 2Comparison of the frequency of phosphatase and tensin homolog on chromosome ten (PTEN) expression with histologic subtypes of 75 pulmonary neuroendocrine (NE) tumors. The frequency of loss of PTEN expression was different between the histologic subtypes of pulmonary NE tumors (p=.025). In pairwise comparison, the frequency of loss of PTEN expression was significantly different between typical carcinoids (TCs) and large cell neuroendocrine carcinomas (LCNECs) (p<.001). AC, atypical carcinoid; SCLC, small cell lung carcinoma.

Fig. 3Comparison of mean normalized Ct (ΔCt) values of microRNA-21 (miR-21) with histologic subtypes of 75 pulmonary neuroendocrine (NE) tumors. The expression level of miR-21 was clearly different between the histologic subtypes of pulmonary NE tumors (p<.001). In pairwise comparison, the expression level of miR-21 was significantly higher in large cell neuroendocrine carcinoma (LCNEC) than in typical carcinoid (TC) (p<.001), in small cell lung carcinoma (SCLC) than in TC (p<.001), and in LCNEC than in atypical carcinoid (AC) (p=.037).
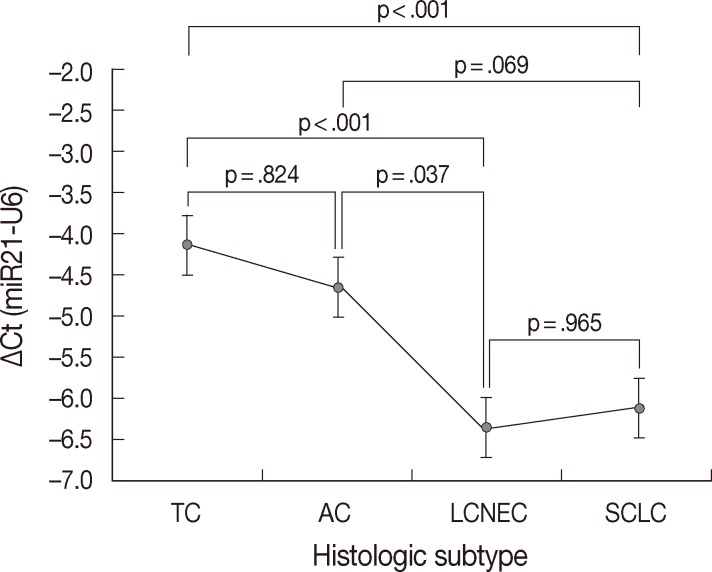
Table 1.Differential expressions of PTEN and miR-21 according to the histologic subtypes of 75 pulmonary neuroendocrine tumors
Table 2.Correlation between PTEN expression and normalized Ct values of miR-21 in 75 pulmonary neuroendocrine tumors
Figure & Data
References
Citations
Citations to this article as recorded by 
- Role of microRNAs in regulating cell proliferation, metastasis and chemoresistance and their applications as cancer biomarkers in small cell lung cancer
Monu Pandey, Abhirup Mukhopadhyay, Surender K. Sharawat, Sachin Kumar
Biochimica et Biophysica Acta (BBA) - Reviews on Cancer.2021; 1876(1): 188552. CrossRef - Neuroendocrine Tumors Are Enriched in Cowden Syndrome
Alison Greidinger, Susan Miller-Samuel, Veda N. Giri, Michele Sue-Ann Woo, Saranya Akumalla, Charnita Zeigler-Johnson, Scott W. Keith, Daniel P. Silver
JCO Precision Oncology.2020; (4): 551. CrossRef - Prognostic and predictive role of the PI3K–AKT–mTOR pathway in neuroendocrine neoplasms
P. Gajate, T. Alonso-Gordoa, O. Martínez-Sáez, J. Molina-Cerrillo, E. Grande
Clinical and Translational Oncology.2018; 20(5): 561. CrossRef - Genetic and epigenetic drivers of neuroendocrine tumours (NET)
Annunziata Di Domenico, Tabea Wiedmer, Ilaria Marinoni, Aurel Perren
Endocrine-Related Cancer.2017; 24(9): R315. CrossRef - Expression of hsa-let-7b-5p, hsa-let-7f-5p, and hsa-miR-222-3p and their putative targets HMGA2 and CDKN1B in typical and atypical carcinoid tumors of the lung
Pietro Di Fazio, Moritz Maass, Silvia Roth, Christian Meyer, Joana Grups, Peter Rexin, Detlef K Bartsch, Andreas Kirschbaum
Tumor Biology.2017; 39(10): 101042831772841. CrossRef - The regulatory role of aberrant Phosphatase and Tensin Homologue and Liver Kinase B1 on AKT/mTOR/c-Myc axis in pancreatic neuroendocrine tumors
Tsung-Ming Chang, Yan-Shen Shan, Pei-Yi Chu, Shih Sheng Jiang, Wen-Chun Hung, Yu-Lin Chen, Hsiu-Chi Tu, Hui-You Lin, Hui-Jen Tsai, Li-Tzong Chen
Oncotarget.2017; 8(58): 98068. CrossRef - Pulmonary atypical carcinoid in a patient with Cowden syndrome
Hiroaki Tsunezuka, Kaori Abe, Junichi Shimada, Masayoshi Inoue
Interactive CardioVascular and Thoracic Surgery.2016; 22(6): 860. CrossRef - Differential miRNA-Expression as an Adjunctive Diagnostic Tool in Neuroendocrine Tumors of the Lung
Melanie Demes, Christoph Aszyk, Holger Bartsch, Joachim Schirren, Annette Fisseler-Eckhoff
Cancers.2016; 8(4): 38. CrossRef - microRNA-21 promotes osteogenic differentiation of mesenchymal stem cells by the PI3K/β-catenin pathway
Yu-Bin Meng, Xue Li, Zhao-Yang Li, Jin Zhao, Xu-Bo Yuan, Yu Ren, Zhen-Duo Cui, Yun-De Liu, Xian-Jin Yang
Journal of Orthopaedic Research.2015; 33(7): 957. CrossRef - Inhibition of NADPH oxidase protects against metastasis of human lung cancer by decreasing microRNA-21
Song Yan, Gang Liu, Changyan Pei, Wenqing Chen, Pei Li, Qiang Wang, Xintian Jin, Jiajia Zhu, Mengzhu Wang, Xiyu Liu
Anti-Cancer Drugs.2015; 26(4): 388. CrossRef
 PubReader
 Cite this Article