 E-submission
Articles
- Page Path
- HOME > J Pathol Transl Med > Volume 46(6); 2012 > Article
-
Case Report
Cervical Lymphadenopathy Mimicking Angioimmunoblastic T-Cell Lymphoma after Dapsone-Induced Hypersensitivity Syndrome - Min Young Rim, Junshik Hong, Inku Yo, Hyeonsu Park, Dong Hae Chung1, Jeong Yeal Ahn2, Sanghui Park3, Jinny Park, Yun Soo Kim, Jae Hoon Lee
-
Korean Journal of Pathology 2012;46(6):606-610.
DOI: https://doi.org/10.4132/KoreanJPathol.2012.46.6.606
Published online: December 26, 2012
Department of Internal Medicine, Gachon University Gil Hospital, Gachon University of Medicine and Science, Incheon, Korea.
1Department of Pathology, Gachon University Gil Hospital, Gachon University of Medicine and Science, Incheon, Korea.
2Department of Laboratory Medicine, Gachon University Gil Hospital, Gachon University of Medicine and Science, Incheon, Korea.
3Department of Pathology, Ewha Womans University School of Medicine, Seoul, Korea.
- Corresponding Author: Sanghui Park, M.D. Department of Pathology, Ewha Womans University School of Medicine, 1071 Anyangcheon-ro, Yangcheon-gu, Seoul 158-710, Korea. Tel: +82-2-2650-5822, Fax: +82-2-2650-5822, 'americandoc@hanmail.net'
© 2012 The Korean Society of Pathologists/The Korean Society for Cytopathology
This is an Open Access article distributed under the terms of the Creative Commons Attribution Non-Commercial License (http://creativecommons.org/licenses/by-nc/3.0/) which permits unrestricted non-commercial use, distribution, and reproduction in any medium, provided the original work is properly cited.
Abstract
- A 36-year-old woman presented with erythematous confluent macules on her whole body with fever and chills associated with jaundice after 8 months of dapsone therapy. Her symptoms had developed progressively, and a physical examination revealed bilateral cervical lymphadenopathy and splenomegaly. Excisional biopsy of a cervical lymph node showed effacement of the normal architecture with atypical lymphoid hyperplasia and proliferation of high endothelial venules compatible with angioimmunoblastic T-cell lymphoma. However, it was assumed that the cervical lymphadenopathy was a clinical manifestation of a systemic hypersensitivity reaction because her clinical course was reminiscent of dapsone-induced hypersensitivity syndrome. A liver biopsy revealed drug-induced hepatitis with no evidence of lymphomatous involvement. Intravenous glucocorticoid was immediately initiated and her symptoms and clinical disease dramatically improved. The authors present an unusual case of cervical lymphadenopathy mimicking angioimmunoblastic T-cell lymphoma as an adverse reaction to dapsone.
- A 36-year-old woman presented at our institution (Gachon University Gil Hospital) with erythematous confluent maculopatches on her face, trunk, and palms; jaundice; fatigue; pruritus; and aggravation of skin lesions over the previous week. She had been previously diagnosed as having erythema multiforme 2 weeks earlier at a private dermatology clinic and had also been administered dapsone with oral antihistamines (mequitazine and cetirizine) and topical corticosteroid for 8 months.
- On admission, her vital signs were a blood pressure of 110/70 mm Hg, heart rate of 78 beats/min, respiratory rate of 18 breaths/min, and body temperature of 38.8℃. She reported no night sweats, loss of weight, or arthralgia. A physical examination conducted at presentation revealed bilateral, multiple enlarged lymph nodes on both sides of the neck with splenomegaly. All of the nodes were non-tender, firm, and measured 0.5 cm to 1.0 cm in diameter. Laboratory tests results were as follows: Hb 11.2 g/dL, white blood cell 13,070/mm3 (segmented neutrophils 24%, lymphocytes 66.3%, and eosinophils 0.1%), platelets 245,000/mm3, total bilirubin 5.4 mg/dL, direct bilirubin 3.8 mg/dL, aspartate aminotransferase/alanine aminotransferase (AST/ALT) 233/366 U/L, lactate dehydrogenase 1,610 IU/L (normal range, 200 to 485 IU/L), and an international normalized ratio of 1.25. She was negative for hepatitis B surface antigen, anti-hepatitis C virus Ab, and anti-human immunodeficiency Ab, but positive for hepatitis B surface antibody; and positive for anti-nuclear Ab, but negative for rheumatoid factor, anti-neutrophil cytoplasmic Ab, anti-Ro (SS-A, B) Ab, and anti-smith Ab. Serology tests showed no evidence of active Epstein-Barr virus (EBV) infection and no bacterial growth was found during a blood culture study. There was no hypergammaglobulinemia.
- An excisional biopsy of a 1.0 cm cervical node showed diffuse polymorphic lymphoid hyperplasia with effacement of the normal architecture and abundant high endothelial venules; the cellular infiltrate was polymorphic, with abundant transformed lymphocytes and plasma cells (Fig. 1). Sinuses were frequently recognizable, but reactive germinal centers were not found.
- Immunohistochemically, the majority of infiltrating atypical lymphocytes were CD3+ T-cells (Fig. 2A, B), and some activated large cells were reactive for CD30 (Fig. 2C). Follicular dendritic cell meshworks expressing CD21 were expanded (Fig. 2D), and infiltrating atypical T-cells were negative for CD10, BCL-6, and EBV by in situ hybridization. For a definitive diagnosis, a molecular study on the rearrangement of the T-cell receptor (TCR)-gamma gene was performed and showed polyclonality (Fig. 3). An IgH gene rearrangement study also showed polyclonality.
- An abdomino-pelvic computed tomography (CT) scan revealed splenomegaly (14 cm), an enlarged portocaval lymph node (1.7 cm), and gallbladder wall edema (Fig. 4A, C). No evidence of lymphomatous involvement was found by chest CT or a bone marrow trephine biopsy.
- Because aggravation of the skin eruption persisted and the liver function test remained abnormal, the possibility of DHS (exfoliative dermatitis, acute hepatitis, and multiple lymphadenopathy) was raised. The findings of a transjugular liver biopsy were compatible with drug-induced hepatitis manifesting as granulomatous inflammation (Fig. 5). No evidence of lymphomatous hepatic involvement was found. In view of her skin lesions, medication history, and age, we concluded that the cervical lymphadenopathy was actually pseudolymphoma. Accordingly, low dose prednisolone (30 mg/day) per os was started after transjugular liver biopsy to relieve the dapsone-induced skin lesions and hepatitis. Gradually, the skin lesions improved and the cervical lymph node enlargement regressed. Her total bilirubin, AST, and ALT values also normalized after 3 weeks of prednisolone, which was then tapered over a month. Follow-up CT scans conducted 3 and 6 months after presentation showed that the size of the cervical lymph nodes and spleen had normalized, and produced no other findings suggestive of lymphoma progression (Fig. 4B, D).
CASE REPORT
- Pseudolymphoma is a rare but interesting phenomenon because of its diagnostic and therapeutic implications. It was first identified in the early 1940s following the introduction of hydantoin and its derivatives for the treatment of convulsive disorders.3 Several drugs other than hydantoins, such as tamoxifen, amlodipine, carbamazepine, and valsartan, have also been reported to cause pseudolymphoma.4-7
- Pathologically, lymph nodes of pseudolymphoma show obliteration of the normal architecture, along with hyperplasia of the reticulum cells and other elements, with frequent mitoses. They also show eosinophilic leukocyte infiltration, focal necroses, and phagocytosis, but no Reed-Sternberg cells.8
- Clinically, systemic reactions are usually combined with pseudolymphoma, fever, skin eruption, hepatitis, and less frequently with hepatosplenomegaly.8 The differential diagnosis of multisystem illness in our patient included: drug reaction with eosinophilia and systemic symptom (DRESS) syndrome and its variants, vasculitis (Churg-Strauss syndrome), hypereosinophilic syndrome, toxic epidermal necrolysis syndrome (TENS) and Stevens-Johnson syndrome. DRESS syndrome presents as a drug rash, eosinophilia, and systemic symptoms. Churg-Strauss syndrome is a medium and small vessel autoimmune vasculitis, which leads to necrosis, and mainly involves the blood vessels of the lungs, gastrointestinal system, and peripheral nerves, though it can also affect the heart, skin, and kidneys. Hypereosinophilic syndrome is characterized by a persistently elevated eosinophil count (≥1,500 eosinophils/mm3) in the blood for at least six months without any recognizable cause. TENS and Stevens-Johnson syndrome are characterized by diffuse erythematous or purpuric macules with involvement of more than 30% of the body surface area with epidermal necrosis with mucosal membrane involvement.
- DHS is a systemic hypersensitivity response to the drug. The incidence of DHS ranges from 0.5% to 3%, and the median latency before symptom onset can be as little as 2 to 6 hours in previously sensitized patients, to as late as 6 months.9 The mechanism of DHS has not been clearly defined.9 However, a few mechanisms have been proposed, for example, DHS might be a combination of type I, type IV, and perhaps type III Gel and Coombs hypersensitivity reactions,10 or alternately, it could be a modified form of graft-versus-host disease mediated by activated T-lymphocytes.10 It is worth noting that although dapsone hepatotoxicity is a dose-dependent effect, DHS is not.10 The classic triad of DHS consists of fever, eruption, and internal organ involvement, although hepatitis, exfoliative dermatitis, lymphadenopathy, and hemolytic anemia might be observed in varying combinations and sequences.11 In addition, cholangitis has also been described as a component of DHS.11 Cutaneous lesions can range from erythematous papules, as in our patient, to plaques, pustules, and eczematous lesions. Some patients may also develop severe dermatitis and complications, such as Stevens-Johnson syndrome or toxic epidermal necrolysis.12 However, the severity of cutaneous changes is not correlated with the severity or extent of internal organ involvement.12
- The histologic findings of the cervical lymph node were compatible with angioimmunoblastic T-cell lymphoma, and without clinical information, it is difficult to exclude this possibility. However, a diagnosis of dapsone-associated lymphadenopathy was made because of a definite medication history capable of causing a systemic hypersensitivity reaction, and because the lymphadenopathy occurred only after the systemic hypersensitivity reaction. Moreover, both TCR-γ and IgH gene rearrangement studies showed polyclonality and infiltrating atypical T-cells and no aberrant expression of BCL-6 or CD10. For polymerase chain reaction (PCR) amplification of the TCR-γ locus, DNA was prepared by standard proteinase K digestion and phenol/chloroform extraction. PCR followed by single-stranded conformational polymorphism analysis were performed.13
- Thus, in view of the clinical and pathologic characteristics, we concluded that the manifestations were compatible with DHS. Furthermore, we presumed that the hepatitis with hepatosplenomegaly was due to a reactive change induced by DHS rather than lymphomatous involvement, and the lymphadenopathy was actually a pseudolymphoma rather than true angioimmunoblastic T-cell lymphoma (AITL), which is commonly encountered in the seventh decade of life.14 In fact, the findings of a transjugular liver biopsy were compatible with drug-induced hepatitis.
- The pathologic findings of the liver biopsy were granulomatous inflammation, which is observed in a large number of drug-associated injury cases.15 In the case described here, had we adopted a combination chemotherapy, such as cyclophosphamide, adriamycin, vincristine and prednisolone (CHOP) for AITL, the unnecessary treatment may have caused further hepatic impairment.
- To our knowledge, this is the first report of dapsone-induced lymphadenopathy mimicking AITL. Our experience of this case cautions physicians that lymph node biopsy results suggestive of lymphoma in the situation of drug-induced systemic hypersensitivity reaction should be an interpretation of the biopsy before deciding on the optimal treatment.
DISCUSSION
- 1. Kosseifi SG, Guha B, Nassour DN, Chi DS, Krishnaswamy G. The Dapsone hypersensitivity syndrome revisited: a potentially fatal multisystem disorder with prominent hepatopulmonary manifestations. J Occup Med Toxicol 2006; 1: 9PMID: 16756657. ArticlePubMedPMC
- 2. Zhu KJ, He FT, Jin N, Lou JX, Cheng H. Complete atrioventricular block associated with dapsone therapy: a rare complication of dapsone-induced hypersensitivity syndrome. J Clin Pharm Ther 2009; 34: 489–492. PMID: 19583683. ArticlePubMed
- 3. Bocquet H, Bagot M, Roujeau JC. Drug-induced pseudolymphoma and drug hypersensitivity syndrome (Drug Rash with Eosinophilia and Systemic Symptoms: DRESS). Semin Cutan Med Surg 1996; 15: 250–257. PMID: 9069593. ArticlePubMed
- 4. Gatti FR, Pires MC. Pseudolymphoma as adverse reaction to tamoxifen. J Eur Acad Dermatol Venereol 2008; 22: 1004–1005. PMID: 18503528. ArticlePubMed
- 5. Kabashima R, Orimo H, Hino R, Nakashima D, Kabashima K, Tokura Y. CD30-positive T-cell pseudolymphoma induced by amlodipine. J Eur Acad Dermatol Venereol 2008; 22: 1522–1524. PMID: 18452522. ArticlePubMed
- 6. Sawada Y, Yoshiki R, Kawakami C, et al. Valsartan-induced drug eruption followed by CD30+ pseudolymphomatous eruption. Acta Derm Venereol 2010; 90: 521–522. PMID: 20814632. ArticlePubMed
- 7. Yeo W, Chow J, Wong N, Chan AT, Johnson PJ. Carbamazepine-induced lymphadenopathy mimicking Ki-1 (CD30+) T-cell lymphoma. Pathology 1997; 29: 64–66. PMID: 9094181. ArticlePubMed
- 8. Saltzstein SL, Ackerman LV. Lymphadenopathy induced by anticonvulsant drugs and mimicking clinically pathologically malignant lymphomas. Cancer 1959; 12: 164–182. PMID: 13618867. ArticlePubMed
- 9. Pavithran K, Bindu V. Dapsone syndrome: hepatitis-B infection a risk factor for its development? Int J Lepr Other Mycobact Dis 1999; 67: 171–172. PMID: 10472374. PubMed
- 10. Knowles SR, Shapiro LE, Shear NH. Reactive metabolites and adverse drug reactions: clinical considerations. Clin Rev Allergy Immunol 2003; 24: 229–238. PMID: 12721394. ArticlePubMed
- 11. Itha S, Kumar A, Dhingra S, Choudhuri G. Dapsone induced cholangitis as a part of dapsone syndrome: a case report. BMC Gastroenterol 2003; 3: 21PMID: 12911838. ArticlePubMedPMC
- 12. Camus P, Bonniaud P, Fanton A, Camus C, Baudaun N, Foucher P. Drug-induced and iatrogenic infiltrative lung disease. Clin Chest Med 2004; 25: 479–519. PMID: 15331188. ArticlePubMed
- 13. Ko YH, Ree HJ, Kim WS, Choi WH, Moon WS, Kim SW. Clinicopathologic and genotypic study of extranodal nasal-type natural killer/T-cell lymphoma and natural killer precursor lymphoma among Koreans. Cancer 2000; 89: 2106–2116. PMID: 11066052. ArticlePubMed
- 14. Bal M, Gujral S, Gandhi J, Shet T, Epari S, Subramanian PG. Angioimmunoblastic T-cell lymphoma: a critical analysis of clinical, morphologic and immunophenotypic features. Indian J Pathol Microbiol 2010; 53: 640–645. PMID: 21045384. ArticlePubMed
- 15. Burt AD, Portmann BC, Ferrell LD. MacSween's pathology of the liver. 2007; 5th ed. Edinburg: Churchill Livingstone, 665.
References
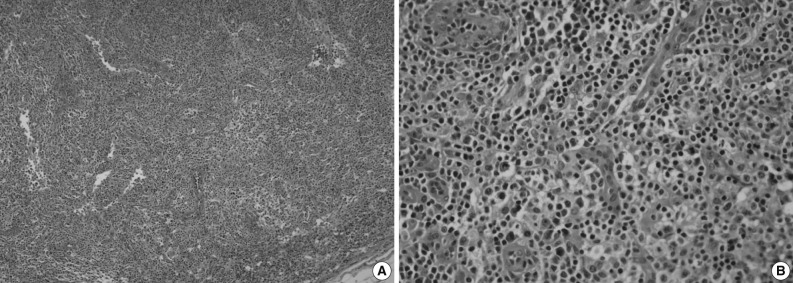
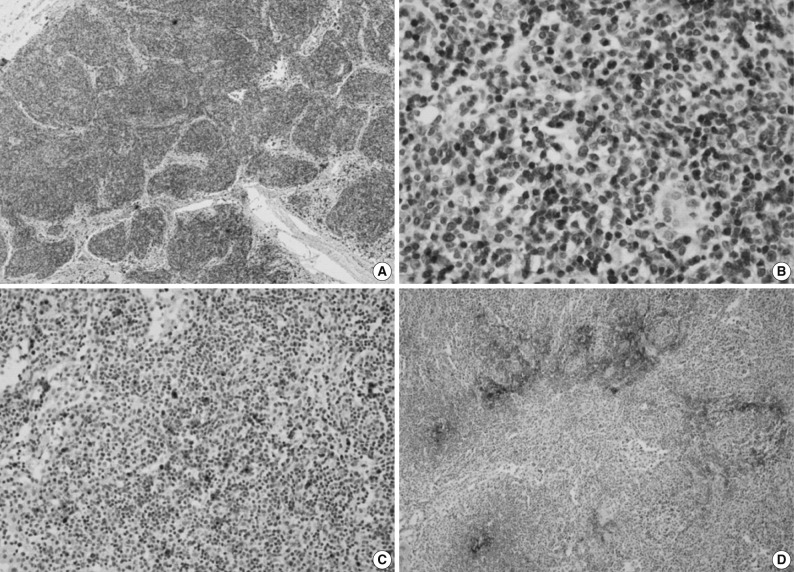
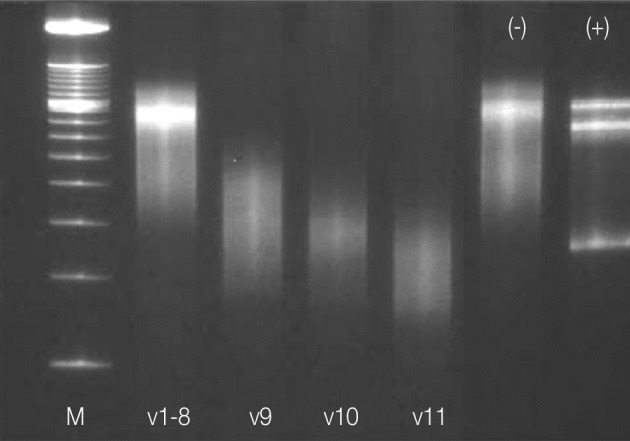
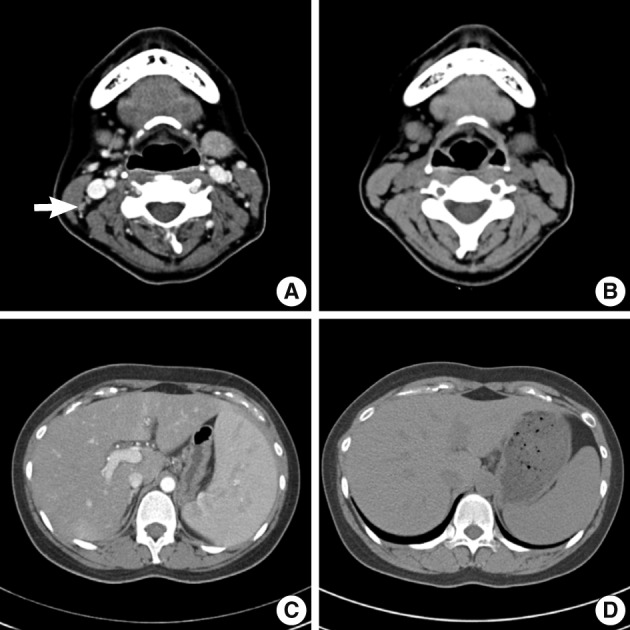
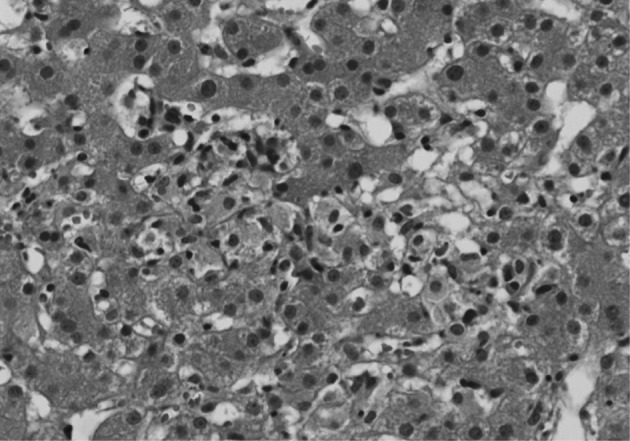
Figure & Data
References
Citations
- Morphologic Spectrum of Lymphadenopathy in Drug Reaction With Eosinophilia and Systemic Symptoms Syndrome
Hui-Chun Chen, Ren Ching Wang, Huey-Pin Tsai, L. Jeffrey Medeiros, Kung-Chao Chang
Archives of Pathology & Laboratory Medicine.2022; 146(9): 1084. CrossRef - Antibacterial antibiotic-induced drug reaction with eosinophilia and systemic symptoms (DRESS) syndrome: a literature review
Shiva Sharifzadeh, Amir Hooshang Mohammadpour, Ashraf Tavanaee, Sepideh Elyasi
European Journal of Clinical Pharmacology.2021; 77(3): 275. CrossRef - Drug-Induced Hypersensitivity Syndrome: A Clinical, Radiologic, and Histologic Mimic of Lymphoma
Faaria Gowani, Bradley Gehrs, Teresa Scordino
Case Reports in Hematology.2018; 2018: 1. CrossRef - In vitro testing for diagnosis of idiosyncratic adverse drug reactions: Implications for pathophysiology
Abdelbaset A. Elzagallaai, Michael J. Rieder
British Journal of Clinical Pharmacology.2015; 80(4): 889. CrossRef - Dapsone-induced drug reaction with eosinophilia and systemic symptoms syndrome, misdiagnosed as lymphoma
Bomi Shin, So Young Park, Sun-Young Yoon, Eun-Hye Shin, Young-Joo Yang, Hyung-Jin Cho, Il-Young Jang, Dong-Uk Kang, Tae-Bum Kim, You Sook Cho, Hee-Bom Moon, Hyouk-Soo Kwon
Allergy, Asthma & Respiratory Disease.2013; 1(4): 400. CrossRef - T-cell lymphoma presenting as drug rash with eosinophilia and systemic symptoms syndrome
Mi-Ae Kim, Hye-Soo Yoo, Sun Hyuk Hwang, Yoo Seob Shin, Dong-Ho Nahm, Hae-Sim Park
Allergy Asthma & Respiratory Disease.2013; 1(3): 280. CrossRef
 PubReader
 Cite this Article


