Immunohistochemistry for Pathologists: Protocols, Pitfalls, and Tips
Article information
Abstract
Immunohistochemistry (IHC) is an important auxiliary method for pathologists in routine diagnostic work as well as in basic and clinical research including exploration of biomarkers, as IHC allows confirmation of target molecule expressions in the context of microenvironment. Although there has been a considerable progress in automation and standardization of IHC, there are still many things to be considered in proper optimization and appropriate interpretation. In this review, we aim to provide possible pitfalls and useful tips for practicing pathologists and residents in pathology training. First, general procedure of IHC is summarized, followed by pitfalls and tips in each step and a summary of troubleshooting. Second, ways to an accurate interpretation of IHC are discussed, with introduction to general quantification and analysis methods. This review is not intended to provide complete information on IHC, but to be used as a basic reference for practice and publication.
Immunohistochemistry (IHC) is an important auxiliary method for pathologists as it specifically visualizes distribution and amount of a certain molecule in the tissue using specific antigen-antibody reaction. The applications of IHC have recently been expanded explosively as more and more molecules involved in pathogenesis, diagnosis, and treatment of diseases are discovered. The unique feature that makes IHC stand out among many other laboratory tests is that it is performed without destruction of histologic architecture, and thus the assessment of an expression pattern of the molecule is possible in the context of microenvironment [1]. The co-analysis of both the target molecule and its subcellular, cellular, and intercellular relation is probably done best by pathologists, and the importance of this co-analysis is increasingly recognized in biomedical research field such as new drug development and prognostic/predicative biomarker investigation. Therefore, pathologists must know thoroughly about the principle and practice of IHC. Here, we aim to provide basic information on procedures and interpretation of IHC with pitfalls and tips for general pathologists.
PROCEDURES OF IMMUNOHISTOCHEMISTRY
There are many critical steps in performing IHC. These include proper handling of the specimen, appropriate fixation, paraffin block preparation, antigen retrieval, selection and preparation of antibody and reagents, incubation, washing, and counterstaining [2]. The advent of automated IHC machines has improved reliability and reproducibility of IHC, particularly in clinical setting [3]. On the other hand, manual staining method still offers more flexibility, allowing for optimization of a specific antigen-antibody reaction, and hence better results, particularly in research setting. Both methods have pros and cons, but basic principles and procedures remain the same. Overall procedure of IHC is summarized in Table 1. Basic principles of each step will follow with practical pitfalls and tips.

Basic protocols of immunohistochemistry
Tissue handling and fixation
Ischemia of the resected specimen before fixation results in degradation of protein, RNA, and DNA as well as activation of tissue enzymes and autolysis [4]. Therefore, variation in ischemic time can be a crucial factor affecting IHC results. Alteration in the results of estrogen receptor, progesterone receptor, human epidermal growth factor 2, and Ki-67 IHC due to variable ischemic times has been reported [5,6]. Fixation is another important cause of variation in the reproducibility of IHC [7]. Surgical specimens are fixed in 10% neutral buffered formalin (NBF). This process prevents autolysis and preserves tissue and cellular morphology. For most tissues, fixation for 24 hours in room temperature is recommended. The appropriate tissue to fixative ratio is 1:1 to 1:20. Duration of fixation, fixative formula, and tissue to fixative ratio can affect the extent and intensity of IHC [8,9]. Fixation is also required in frozen sections in certain situations such as evaluating new antibodies. In those cases, acetone- or NBF-fixed frozen sections can be used.
Pitfalls and tips
Some antigens including Ki-67 and phosphoproteins are more vulnerable to ischemia. Overfixation can cause irreversible damage to some epitopes. To avoid ischemic or cold effect resulting in degeneration of protein or tissue enzymes, rapid fixation is important. When using non-additive fixatives such as acetone, the target antigen will normally be fully available, but with compromised morphology. Soluble antigen may be diffused out during the process of IHC if the frozen section is not fixed.
Sectioning and storage
The recommended thickness of tissue section for IHC is mostly 4 μm, but it is optional depending on the purpose. Storage of tissue sections may have influence on the results of IHC [10]; storing tissue sections for more than 2 months results in loss of p53 [11]. The mechanism of this epitope degradation is unclear, but water component in and around the tissue sections may cause the antigenic loss [12]. Slide storage conditions that are protected from oxidization by vacuum storage or paraffin coating are important as well as complete removal of water in the slide.
Pitfalls and tips
Thick tissue sections can produce higher background signals as can frozen sections; frozen sections tend to preserve more adhesive molecules, Fc receptors, peroxidase, etc. Soluble antigen may be diffused out during the process of IHC if the frozen section is not fixed. IHC should be done with freshly cut sections.
Antigen (or epitope) retrieval
Antibody binding epitopes can be masked in formaldehyde-based fixation due to cross-linkings of amino groups on adjacent molecules, in addition to the formation of methylene bridges [13].
For this reason, antigen retrieval, an additional step to unmask the epitope, is sometimes required. Optimized antigen retrieval can restore antigenicity to that of frozen sections; thus, antigen retrieval is crucial for IHC standardization for which issues of variations in fixation and handling of specimens must be overcome [14]. In general, antigen retrieval process is not necessary for frozen sections. However, sometimes acetone- and NBF-fixed frozen sections are required to prevent wash out of target antigen, particularly for soluble antigens. In that case, antigen retrieval may serve for better IHC signals.
The heat induced epitope retrieval (HIER) is the most widely used method for antigen retrieval. Various methods can be used for application of heat: microwave ovens, heating plate, pressure cookers, autoclaves, and water baths in varying conditions including pH 6–10. Generally, using autoclave and microwave oven, the temperature is set at 120°C at full pressure and 750–800 W, respectively and typically for 10 minutes. Using heating plate, incubate at 100°C for 30 mitutes. The best retrieval condition for each Ag-Ab pair needs to be determined empirically through comparison of staining results by various retrieval methods. In addition, enzymatic retrieval is used for limited antigens such as some cytokeratins and immunoglobulins. In such cases, tissue sections are incubated in either trypsin or proteinase for 10–20 minutes at 37°C. Then, terminate the reaction by adding phosphate buffered saline (PBS). However, this method is much more difficult to control.
Pitfalls and tips
Excessive tissue microwaving can destroy antigenicity and morphology. It may result in HIER lipofuscin artifacts. When using HIER, “microwave burn” pattern in loose connective tissue and fat can be identified. The appropriate antigen retrieval is different from antigen to antigen, and antibody to antibody. It should be determined individually for each antigen and antibody. Also, try enzymatic retrieval or no retrieval in addition to HIER at the initial step.
Protein blocking
Protein blocking step is required to reduce unwanted background staining. A main cause for the background signal is the nonspecific binding of Fc portion of primary or secondary antibodies. An ideal agent for the protein blocking is 5%–10% normal serum from the same species of secondary antibody. Other agents include protein buffers such as 0.1%–0.5% bovine serum albumin, gelatin, or nonfat dry milk [15]. Recently commercial mixes of synthetic peptides are also being widely used. Incubation time for the blocking step can vary from 30 minutes to overnight. Incubation temperatures also vary from 4°C to room temperature.
Pitfalls and tips
Sufficient washing after the blocking step is critical to remove excess protein that may prevent detection of the target antigen. Choose blocking buffer that yields the highest signal to noise ratio. Nonfat dry milk contains biotin and is inappropriate for use with an avidin-biotin complex system. When using frozen sections, smears and lightly fixed tissues, background staining due to Fc receptor is more prevalent than formalin-fixed, paraffin-embedded sections. Furthermore, it is important to control Fc receptor rich specimens such as lymphoid sections, tonsil sections, and bone marrow preparations. It can be avoided by using either Fc receptor blocking or F(ab’)2 fragments of primary staining antibody instead of whole IgG molecules.
Endogenous enzyme blocking
When using peroxidase antiperoxidase system in detection step, blocking of endogenous peroxidase activity is indispensable. Diluted hydrogen peroxide as 3% is widely used for blocking endogenous peroxidase activity [16]. Upon completion of the IHC stain, eosinophils and erythrocytes are used as an index to see whether the blocking step has been adequate or not. Similarly, endogenous alkaline phosphatase (AP), which is prevalent in frozen tissue, should be blocked with levamisol at a concentration of 10 mM [17]. The endogenous biotin in tissues is another issue. Although the level of endogenous biotin has been shown to be much lower in formalin fixation and paraffin embedding, residual activity can still be detected, especially in biotin-rich tissues such as liver and kidney. Endogenous biotin can be blocked by incubating tissue section in avidin solution beforehand (incubate sections in avidin solution for 15 minutes followed by brief rinse in PBS, and then incubate sections in biotin solution for 15 minutes, all at room temperature).
Pitfalls and tips
Tissues with high blood content (e.g., site of heavy hemorrhage), or with intense granulocytic inflammatory infiltrate, need a strong suppression of endogenous peroxidase activity. Some antigen (such as CD4) can be destroyed by 3% H2O2. In this case, an H2O2 concentration as low as 0.5% is recommended [18].
Antibody selection and validation
Before performing IHC, a selection of suitable antibody is critical, for which understanding of the target through thorough literature review is the first step. If there are reports of the target molecules using IHC, then the antibody used in the previous reports should be evaluated first. Antibodies used in researches are generally divided into three types with respect to the validity and reliability: well-known antibody with high quality literature evidence, well-known antibody used in alternative species or unverified tissues, and unknown antibody with inconsistent or no literature evidence [2]. Researchers should perform an adequate level of validation depending on the kind of antibody used [19]. Detailed guidance for validating antibody is well summarized in the review article [2].
Antibodies are generally divided into two categories. Polyclonal antibodies are obtained from experimental animals through repetitive stimulation of antigen. These antibodies bind to multiple different epitopes in a single antigen. On the other hand, monoclonal antibodies react to a single epitope in an antigen. They are obtained from a single clone of hybridoma, which produces antibodies. Both polyclonal and monoclonal antibodies have advantages and disadvantages, respectively (Table 2). Recently, monoclonal antibodies from rabbit or chicken have been introduced. These antibodies may give a better IHC results for antigens that are difficult to stain.
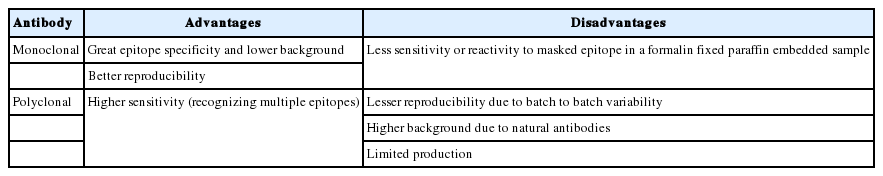
Comparison between monoclonal and polyclonal antibodies
When an unknown antibody is validated, it is important to select proper positive and negative control tissues. Interpretation of IHC stain pattern in control tissues should be done carefully. Appropriate location, intensity, and signal/noise ratio are determined in this step. Validation of the antibody by non-IHC methods such as western blotting or flow cytometry is also recommended. Afterward, optimization is necessary to tune antibody dilution, incubation times, and blocking for controlled laboratory conditions. Appropriate validation and optimization of IHC staining method can provide equivalent results between laboratories.
Pitfalls and tips
The biologic characteristics and amount of the antigen in the tissue, titration of the antibody, and differences between control and testing samples should be carefully considered. Use the same tissue that was used for optimization or validation for testing IHC. Perform IHC with negative control Ab to disclose any background staining. Competition assay with the immunizing peptide on the optimizing sample is essential if the validation level of the antibody is low (see competition protocol in the study of Prioleau and Schnitt [11]) [20].
Detection system
Immunostaining is the process of detecting specific antigenantibody interaction, and indirect method using secondary antibodies tagged with various labels such as enzymes is commonly used [5]. Commonly used detection systems are as follows: avidinbiotin complex method, labeled streptavidin biotin method, phosphatase anti-phosphatase method, polymer-based detection system (Fig. 1), and tyramine amplification system. In comparison to the standard IHC methods, polymeric and tyramine-based amplification methods have typically increased sensitivity by at least 50-fold or greater. The outcome of an IHC depends on the selection of the optimal methods for signal amplification for the molecule of interest and surrounding tissues [21].
Illustration of polymeric amplification system. DAB, diaminobenzidine; HRP, horseradish peroxidase.
Another important issue is the use of manual IHC versus automated IHC machines. Automated IHC machine has greatly improved reproducibility and reliability of IHC. However, the automated system does not allow subtle optimization or flexibility in the usage of reagent or retrieval methods. There are advantages and disadvantages.
Pitfalls and tips
When more sensitive methods are used, background signal tends to increase along with the target signal. Use automated IHC machine if a large number of samples are tested, or if the samples are tested over a longer time. AP-based detection system is preferred for tissues rich in endogenous peroxidase, such as bone marrow or lymphoid tissue. Likewise, peroxidase based-detection system may be used for tissues containing many endogenous APs but the enzyme can be easily destroyed by high-temperature antigen retrieval. Biotin-free synthetic polymer system is recommended for tissues with high endogenous biotin such as liver and kidney.
Several different chromogens are available according to the type of tissue or counterstain. In general, diaminobenzidine (brown) or 3-amino-9-ethyl carbazole-red are routinely used for peroxidase. The choice depends on the type of tissue or counterstain.
Counter staining
Counter staining provides contrast to the chromogens for better discrimination of the target signal. In addition, it has a more important role, particularly for pathologists, as it allows researchers to identify the cell type and exact localization of the immunopositives. Hematoxylin is the most commonly used counterstain, although various colors are now being used as techniques of multiplex IHC progress [22]. In the process of multiplex IHC, counterstain should be selected carefully. The most commonly used counterstains are shown in Table 3.

Examples of counterstainings that are commonly used
Troubleshooting
There are many possible causes for poor staining results, which can be any of the following: weak or absent staining, unwanted background staining, or artifactual staining. Table 4 shows possible situations and solutions that are useful in trouble-shooting [23].
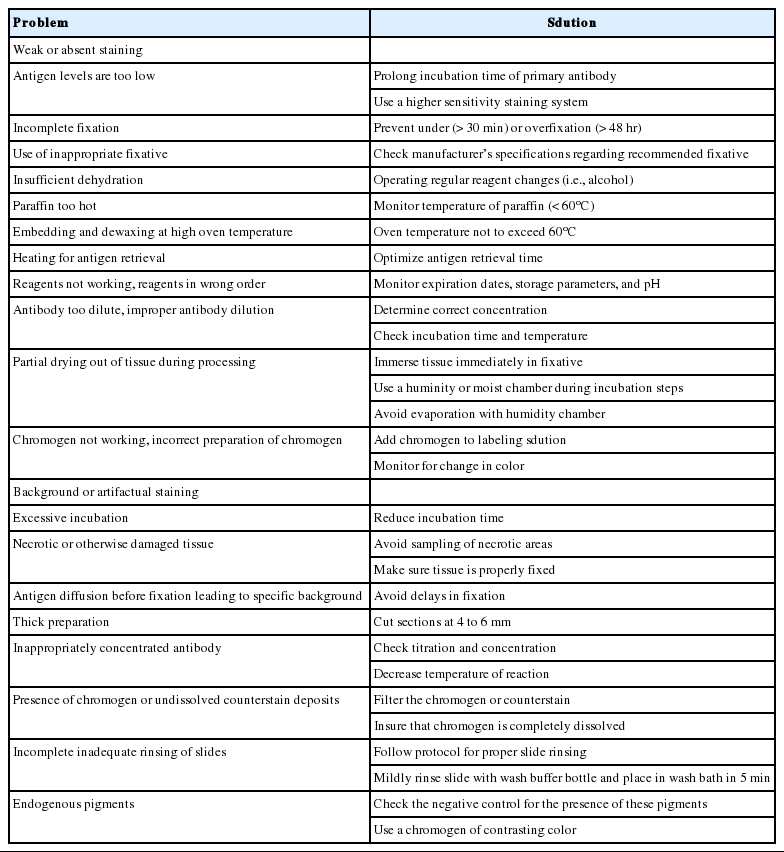
Consideration of variable troubleshootings and solutions
QUANTIFICATION OF THE DATA
To analyze the IHC data, including diagnostic value of certain molecular expression and prognostic relationship of the biomarkers, results of the IHC should be expressed in numerical values for statistical analysis. In this section, several quantification methods that are widely used are reviewed.
Assessment of the proportion of immunopositive cells
In evaluating IHC results, researchers commonly assess the relative percentage of immunopositive cells in relation to the total number of target cells. Each value is usually recorded as a numerical score in every 10% (0, 0%–9%; 1, 10%–19%; 2, 20%–29%; 3, 30%–39%; 4, 40%–49%; 5, 50%–59%; 6, 60%–69%; 7, 70%–79%; 8, 80%–89%; and 9, 90%–100%). This method has a limitation that it does not show the intensity of the IHC staining, resulting in the lack of information regarding the subtle difference in protein expression level. However, it can preclude the interpretational error resulting from inappropriate variation in staining intensity between cases due to differences in tissue status in a large-scale study and among applied batches especially in manual staining.
Combinative semiquantitative scoring
Combinative semiquantitative scoring is the most commonly used method in the current prognostic biomarker researches, yielding immunoscores that incorporate both quantitative and qualitative assessments. In addition to the quantitative data from the assessment of relative percentage of immunopositive cells as previously described, intensity of the staining is also evaluated. The intensity is commonly scored from 0 to 3 (0, negative; 1+, weak positive; 2+, moderate positive; and 3+, strong positive). The final immunoscore is calculated by adding or multiplying each score. The Allred score used in breast cancer is one of the best-known combinative scoring systems [24].
Although researchers can evaluate the IHC results both quantitatively and qualitatively with this method, too many variations can be created according to the combinations, resulting in different interpretations between researchers. Four or five score levels in average are recommended for the best sensitivity and reproducibility of the scoring system [25,26].
Quantification using spectral image analysis
As multiplex IHC develops, analysis for multicolor stained specimen is essential. Usual semiquantitative scoring is not appropriate in the analysis of multiplex IHC due to a massive amount of information in a single slide. Thus, the use of spectral image analysis is increasing for the interpretation of multiplex IHC. In spectral unmixing, the optical signal from each chromogen can be isolated and assessed separately and quantitatively [18].
ANALYSIS OF THE DATA
After quantitative analysis of the IHC results, the continuous variables are usually changed into categorical forms, as it is much easier to analyze and make decisions [20].
The categorization of variables also enables clinicians to stratify patients according to the IHC results of the testing molecules. Cut-off values for immunopositivity are commonly selected by the median and the quartiles of measurements. However, sometimes simply more than 5% or 10% criteria are used. There is no standardized method for setting the cut-off value for the categorization. This lack of standardization sometimes causes inconsistent results between similar studies. Pathologists should be cautious when comparing IHC data between studies. To resolve these problems, there have been many efforts to establish reasonable ways to determine cut-off points. In this section, we introduce two statistical methods that are being frequently used.
Minimum p-value approaches (maximally selected chi-square statistics)
By this method, investigators can search cut-off points in a systematic manner. It means that all measured values are analyzed as provisional cut-offs at first. Afterward, the value that has a maximum chi-squared statistic, minimum p-value, or maximum relative risk is selected. However, this method has a demerit of multiple testing. The p-value obtained from this method should be adjusted to offset the effect of multiple testing. In addition, specific statistics software such as SAS (SAS Institute Inc., Cary, NC, USA) or R software is required for this method.
Application of receiver operating characteristic curves
Receiver operating characteristic (ROC) curve analysis is another useful method for evaluating the prognostic relevance of biomarkers [24]. ROC curves have been widely used in clinical oncology for evaluation and comparison of the sensitivity and specificity of the diagnostic tests regarding the binary outcomes [27,28]. Recently, it has been increasingly used in the field of pathology research to determine cut-off scores in many cancers [29,30].
The ROC curve was initially developed to display signal-to-noise ratios. Basically, it is a plot of the ratio between the true positivity (sensitivity) and the false-positivity (1–sensitivity) (Fig. 2). In the ideal test, the ROC curve meets the upper left-hand corner. The diagonal reference line represents whether a test is positive or negative by chance. Performance of the test is quantified as a value of the area under the curve (AUROC). The better performance the test has, the closer to 1 the value of the AUROC is. Researchers can deduce specific cut-offs using various statistical methods. There are some pitfalls. Firstly, ROC curve analysis has to be applied in a test that has a gold standard. If the gold standard is uncertain, the entire interpretation of the results can become dubious.
Receiver operating characteristic curve. Test A that is closer to the upper left-hand corner is better than test B and C. Performance of the test A is also better than that of the other two tests considering the area under the curve. Test D, lined in the opposite side of the reference line, represents negative correlation with the predetermined gold standard. TPR, true positive rate; FPR, false positive rate.
Secondly, the cut-offs drawn from the ROC curves do not consider time or censoring of the data. Simply dichotomizing as “alive/censored” or “death” regardless of the follow-up time can be suboptimal in the prognostic research. To overcome this short-coming, additional tests such as Kaplan-Meier survival analysis can be applied.
CONCLUSION
IHC has become an indispensible tool for pathologists in both everyday practice and basic research for elucidating pathophysiology of the diseases. In conjunction with this, IHC is also an indispensable tool for validation in biomarker discovery that will eventually lead to a personalized medicine [31]. Even though IHC procedure has recently been automated and standardized, there are many things to be considered to optimize IHC properly and interpret appropriately. Optimization of IHC is particularly important for newly discovered molecules or new antibodies. Specificity and sensitivity of the IHC need to be validated. It is strongly recommended to review a full literature of the target molecule before starting IHC experiment [2]. Interpretation of IHC also needs to be carefully planned. Consideration for stabilizing interobserver consistency and objectifying interpretation of IHC results is crucial. In this review, we attempted to provide basic principles and practical tips for practicing pathologists and residents in pathology training.
Notes
Conflicts of Interest
No potential conflict of interest relevant to this article was reported.