E-submission
Articles
- Page Path
- HOME > J Pathol Transl Med > Volume 58(3); 2024 > Article
-
Original Article
Revisiting the utility of identifying nuclear grooves as unique nuclear changes by an object detector model -
Pedro R. F. Rende1
 , Joel Machado Pires2, Kátia Sakimi Nakadaira3, Sara Lopes4, João Vale5, Fabio Hecht6, Fabyan E. L. Beltrão1, Gabriel J. R. Machado1, Edna T. Kimura3, Catarina Eloy5,7, Helton E. Ramos,1,8
 -
Journal of Pathology and Translational Medicine 2024;58(3):117-126.
DOI: https://doi.org/10.4132/jptm.2024.03.07
Published online: April 30, 2024
1Bioregulation Department, Health and Science Institute, Federal University of Bahia, Salvador, Brazil
2Institute of Computing, Federal University of Bahia, Salvador, Brazil
3Institute of Biomedical Sciences, University of São Paulo, São Paulo, Brazil
4Endocrinology Department, Hospital de Braga, Braga, Portugal
5Laboratory of Pathology of the Institute of Pathology and Molecular Immunology, University of Porto, Porto, Portugal
6Department of Biomedical Genetics, University of Rochester, Rochester, New York, USA
7Faculty of Medicine, University of Porto, Porto, Portugal
8Postgraduate Program in Medicine and Health, Bahia Faculty of Medicine, Federal University of Bahia, Salvador, Brazil
- Corresponding Author: Helton E. Ramos, MD, PhD, Bioregulation Department, Health and Science Institute, Federal University of Bahia, Federal University of Bahia, Avenida Reitor Miguel Calmon, S/N. Vale do Canela, Room 325, Salvador-BA, 40110-102, Brazil Tel: +55-071-3283-8908, Fax: +55-071-3283-8908, E-mail: 'ramoshelton@gmail.com'
© 2024 The Korean Society of Pathologists/The Korean Society for Cytopathology
This is an Open Access article distributed under the terms of the Creative Commons Attribution Non-Commercial License (http://creativecommons.org/licenses/by-nc/4.0) which permits unrestricted non-commercial use, distribution, and reproduction in any medium, provided the original work is properly cited.
- 425 Views
- 40 Download
Abstract
-
Background
- Among other structures, nuclear grooves are vastly found in papillary thyroid carcinoma (PTC). Considering that the application of artificial intelligence in thyroid cytology has potential for diagnostic routine, our goal was to develop a new supervised convolutional neural network capable of identifying nuclear grooves in Diff-Quik stained whole-slide images (WSI) obtained from thyroid fineneedle aspiration.
-
Methods
- We selected 22 Diff-Quik stained cytological slides with cytological diagnosis of PTC and concordant histological diagnosis. Each of the slides was scanned, forming a WSI. Images that contained the region of interest were obtained, followed by pre-formatting, annotation of the nuclear grooves and data augmentation techniques. The final dataset was divided into training and validation groups in a 7:3 ratio.
-
Results
- This is the first artificial intelligence model based on object detection applied to nuclear structures in thyroid cytopathology. A total of 7,255 images were obtained from 22 WSI, totaling 7,242 annotated nuclear grooves. The best model was obtained after it was submitted 15 times with the train dataset (14th epoch), with 67% true positives, 49.8% for sensitivity and 43.1% for predictive positive value.
-
Conclusions
- The model was able to develop a structure predictor rule, indicating that the application of an artificial intelligence model based on object detection in the identification of nuclear grooves is feasible. Associated with a reduction in interobserver variability and in time per slide, this demonstrates that nuclear evaluation constitutes one of the possibilities for refining the diagnosis through computational models.
- Study population
- Retrospectively, we selected 27 cases of thyroid nodules archived at the Pathology Laboratory of the Institute of Molecular Pathology and Immunology of the University of Porto (IPATIMUP) from 2015 to 2021. Only cases with a cytological diagnosis of PTC and histological confirmation were included. Cases with suspected PTC and those with a cytological diagnosis of PTC associated with a discordant histological diagnosis were excluded. Inadequate slides, such as those heavily darkened or blurred, preventing the identification of the studied structures, were also excluded. After the selection process, 21 cases were included in the study.
- Image acquisition
- For the selection of cytology slides, the initial preference was given to the first slide within the archival records. In a singular case featuring bilateral PTC, two slides were chosen, each obtained from the respective thyroid lobe, resulting in a total of 22 cytology slides. These archival slides originated from ultrasound-guided FNA, wherein aspirated material was meticulously distributed onto glass slides, followed by uniform spreading using an additional glass slide. The subsequent steps included air-drying of the slides and staining via the Diff-Quik method.
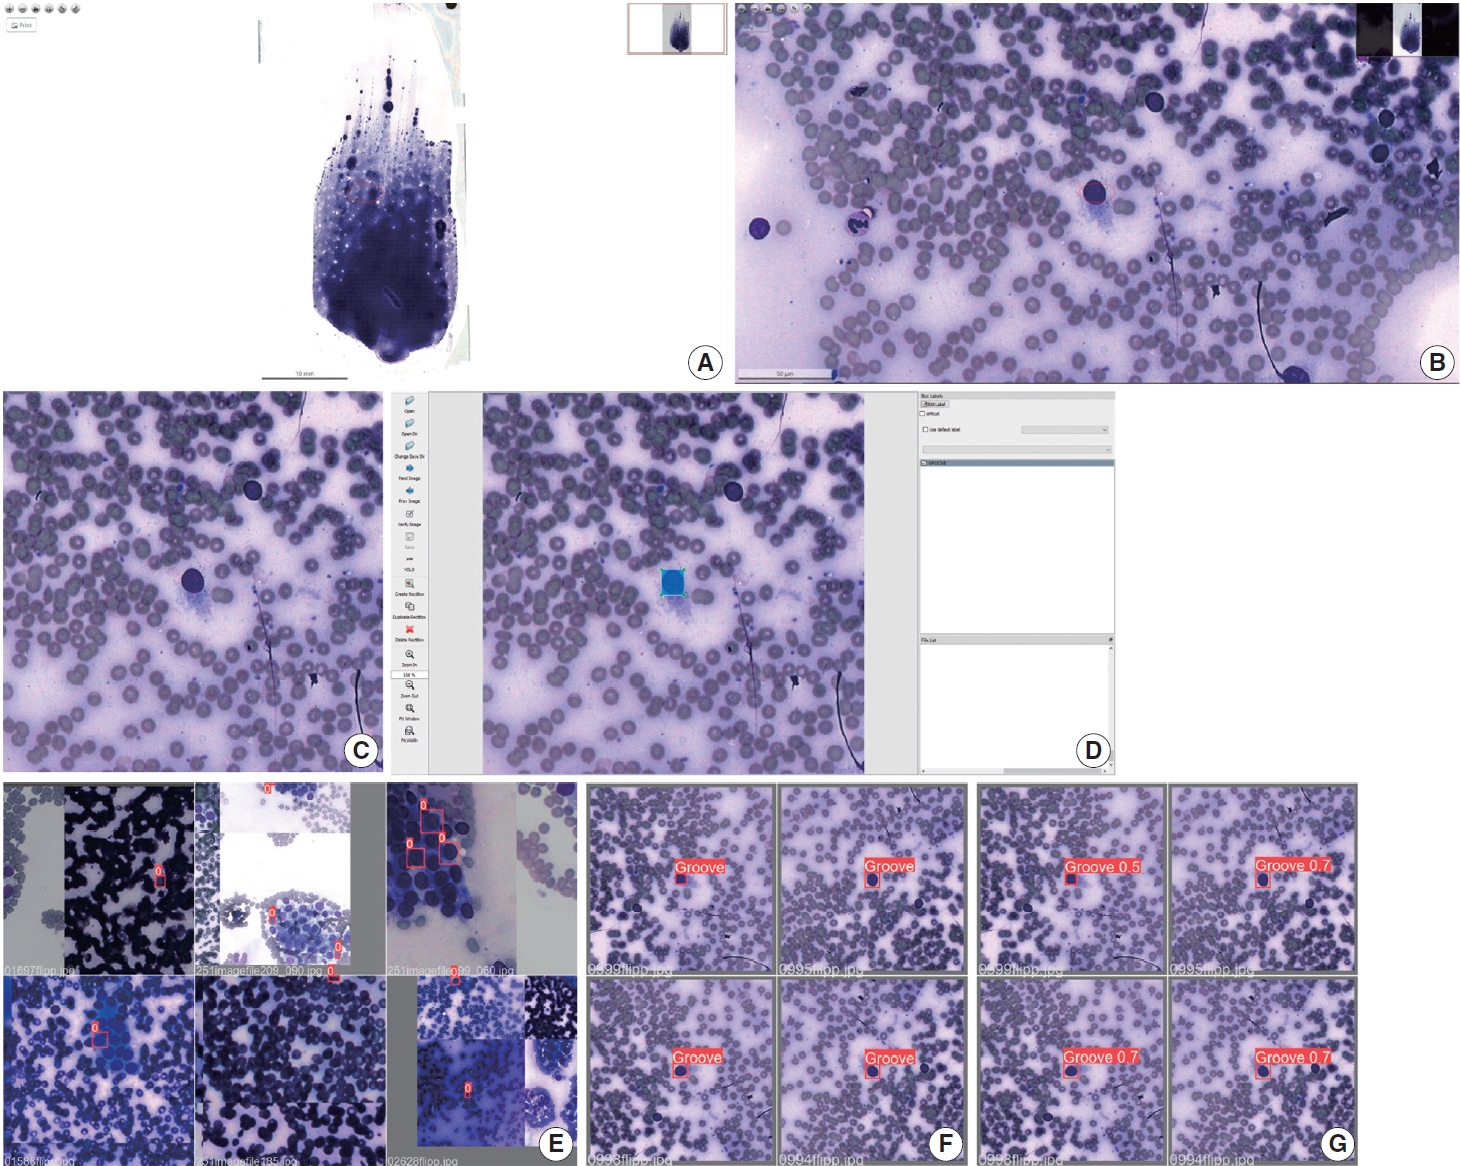
- Utilizing the Pannoramic 1000 (P1000) Scanner from 3D-HISTECH Ltd. (Budapest, Hungary), each selected slide was subjected to scanning, generating whole-slide images (WSIs) in MRXS file format. Subsequently, manual cropping of the WSIs was performed through the Thyroid Prediction (ThyPred) program, employing standardized augmentation at 4.92 pixels/μm and resulting in a resolution of 1,920×1,007 pixels (390.24× 204.67 μm size). These cropped images were then exported in JPEG format, amounting to a total of 7,255 images. To further optimize the model fitting process, a Python script was developed to convert the obtained images into squared dimensions with a resolution of 640×640 pixels.
- Annotation of the region of interest
- The image annotation process involved identifying the region of interest containing the nuclear groove within the follicular cell. This was accomplished by creating a precise bounding box using a standard mouse input method through LabelImg. The annotations were meticulously carried out by an experienced pathologist with over 20 years of expertise in the field. A nuclear groove was defined as an elongated structure that was not always linear, with no defined orientation, crossed the largest part of the cell and had a different appearance in terms of the color when compared to the rest of the nucleus. The annotations were grouped in a single class defined as “GROOVE”. From this process, 7.242 nuclear grooves were annotated and then exported as simple text files, with TXT extension, in YOLO format. A script was written to remove invalid annotation, such as repeated or no content bound boxes and no label or wrong written labels.
- Data augmentation techniques
- The image augmentation techniques create new image versions of a sample. In this process, the techniques of zooming, rotations and random mirroring were used, which proved to be adequate, since the model is required to identify the grooves regardless orientation or position. Therefore, the data augmentation techniques were used to artificially increase the amount of data of the database and, consequently, improve the performance of the neural network. Also, a larger database helps avoid overfitting and improve the model generalization capacity. Since deep learning techniques were used, no other methods of pre-processing the images were performed to avoid bias.
- Training and validation samples
- After increasing the database with the data augmentation techniques, the images were divided in two groups in a 7:3 proportion, the training group (containing 70% of the images) and the validation group (comprising the remaining 30% of the images). Images of grooves previously encountered during training were not present in the validation data. The training group was utilized for fine-tuning the pretrained model, whereas the validation group was employed to assess its performance and select the model that achieved the best results. The methodology overview is illustrated in Fig. 1.
- System architecture
- We opted for the use of transfer learning to develop the model, which is fine-tuned with the images collected, resulting in the groove detector model. Transfer learning is recognized as a machine learning approach wherein a pretrained model, initially trained on a dataset unrelated to the current objective, is repurposed as the foundation for a second model. This process leads to the development of a more efficient model.
- The pretrained model chosen was YOLOv5s, a state-of-the-art real-time object detection, that works as a single-stage object detector, and has achieved optimal performances in its object detection datasets, the Pascal VOC (Visual Object Classes) and MS COCO. When in model training, YOLOv5 applies the mosaic data augmentation technique, which combines four training images, mixing four distinct contexts, increasing the accuracy of the network. The main idea is to use a feature extractor which encodes the images in tensors that is used to locate the object and then classified.
- The YOLOv5 network consists of three main parts: the backbone, neck, and head. The backbone extracts image characteristics using convolutional and Spatial Pyramid Pooling. The neck combines features from different network levels using Path Aggregation Network to enable accurate object detection across various sizes and scales. The head comprises three convolutional layers to predict bounding boxes and object classes.
- Metrics evaluation
- As an evaluation of the model utilized, the loss functions and metrics of YOLOv5 were analyzed. The following loss functions were utilized: object loss and box loss. One of the loss functions of these models is the object loss, which refers to the error in detecting if an object exists in the region suggested. On the other hand, the box loss is characterized by the error between the location and size of the predicted bounding box and the true bounding box. Considering that this study evaluated only one class (“GROOVE”), the classification loss, that assesses if the classification of each predicted bounding box was correct, was not applied.
- The Intersection over Union (IoU) is obtained by the division of the area of overlap between the two bounding boxes (predicted and true) by the area of their union. A true positive was considered when the IoU was superior or equal to the threshold, meaning that the model could identify an object that is present on the ground truth. False positives, on the other hand, were counted when the IoU was inferior to the threshold, indicating that the prediction has a small overlap with the true ground or has no overlap at all. False negatives occur when the true positive box is not correctly predicted. Also, considering that in object detection the background is not evaluated, true negatives were not obtained.
- Precision, also called positive predicted value, is calculated by the ratio between true positives and total of positives (true positives and false positives), evaluating how correct the predicted bounding box is (i.e., the proportion of positive identifications among positive predictions).
- Recall, also called sensitivity, is obtained from the division between the true positives and the sum of the true positives and the false negatives. It is a metric that evaluates the probability of the feature being positive when the result is positive, indicating how much the true bounding boxes were correctly predicted.
- Average precision is calculated by the weighted mean of precisions of a class at each threshold and represents the area below the precision-recall curve. Mean average precision (mAP) refers to the mean average precision of all classes in a given threshold. When it is calculated in the IoU at the threshold of 0.5, it receives the nomenclature of “mAP_0.5”, meaning that there is 50% of overlap. The mean of the thresholds ranging from 0.5 to 0.95 is called “mAP_0.5:0.95”.
- Given that the deep learning model relies on adjusting weights based on input images, we define the aggregate number of iterations performed by the training group within a training cycle, denoted as an epoch. In this work, we used 50 epochs (0 to 49), which means that the images of the training group were submitted 50 times to adjust the model weights. The model fitness is defined by the epoch that has the best value of mAP_0.5:0.95.
MATERIALS AND METHODS
- A total of 7.255 images were obtained from 22 WSI’s, in which 7.242 nuclear grooves were annotated. To increase the database provided to the model, these images were submitted to data augmentation techniques. This database was randomly divided into training and validation groups, in a ratio of 7:3. As aforementioned, in the process of training and validation of the model, 50 epochs were used (from 0 to 49).
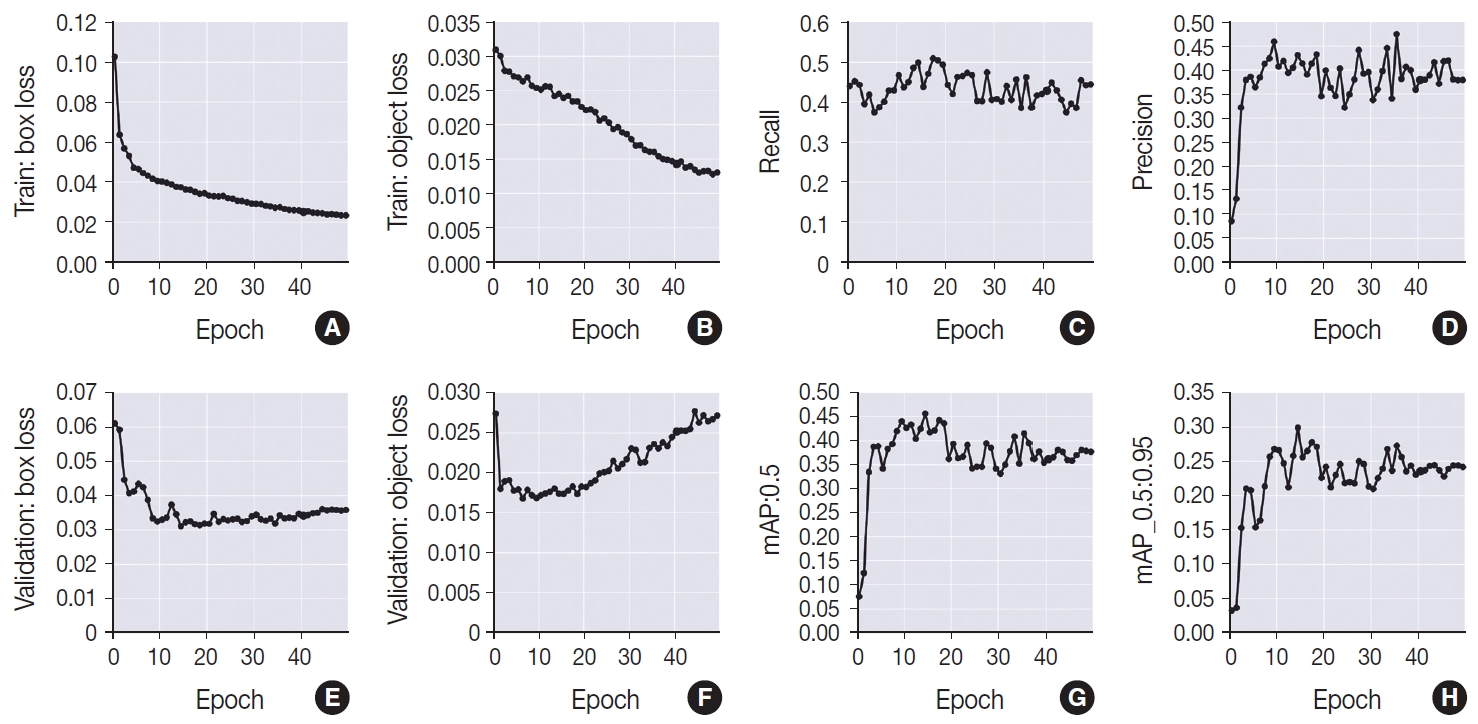
- In terms of the training group, the model demonstrated improvement in both box loss and object loss throughout the entire training period. This is evident from the observed decrease in box loss, starting at 10.2% in the initial stages of training and reaching 2.3% by the 49th epoch. Similarly, the object loss exhibited a decline from 3% at the beginning to 1.3% at the conclusion of the training.
- However, the same level of improvement was not observed in the validation group, which showed an enhancement in results until peaking at the 14th epoch. During this phase, a reduction in the values of the loss functions was noted, with an object loss of 2.7% and a box loss of 6.1% at epoch 0. By the 14th epoch, the values had improved to 3.1% for box loss and 1.7% for object loss. After the 14th epoch, a gradual increase in the values of the loss functions was observed, particularly in object loss, which reached 2.7% by the 49th epoch. In contrast, box loss demonstrated a more modest increase, fluctuating between 3.2% and 3.6% until settling at a final value of 3.5% (epoch 49).
- In accordance with what was observed in the validation group, the recall (sensitivity) values exhibited a decrease at the beginning of the training, ranging from 44% in epoch 0, with a valley at 37.4% in the 5th epoch and subsequent increase between epochs 13 to 21, when it presented its best results, ranging from 48.5% to 50.8%, except for the 15 and 16 epochs that obtained, respectively, 43.8% and 47%. After this period, there was a decrease in this metric, which began to exhibit, still, some degree of fluctuation between 38.5% and 47.3%. Precision (positive predictive value), on the other hand, was 8.5% at epoch 0, with a slight increase up to the interval comprised by the epochs 7 and 18, which ranged from 40.6% (epoch 10) to 45.9% (epoch 9), except for epochs 12 (39.4%) and 16 (39%). After this period, there was a reduction in the values, which ranged from 33.7% (epoch 30) to 40.6% (epoch 37), except for some epochs that presented values that exceeded this limit, namely: 27 (44.1%), 33 (44.5%), 35 (47.4%), 43 (41.6%), 45 (41.7%), and 46 (41.9%).
- The mean average precision at the 0.5 threshold (mAP_0.5) increased from 7.5% at epoch 0 to 39.3% at epoch 7. Between epochs 8 and 18, the highest values of this metric were achieved, ranging from 40.4% to 45.6% (best result in training, corresponded to the epoch 14). After this period, however, a reduction in the values was observed, which ranged from 33.1% to 39.4%, except for epochs 33 (40.8%) and 35 (41.5%). A similar phenomenon was detected in the mean average precision referent to thresholds from 0.5 to 0.95 (mAP_0.5:0.95), with an increase until the 7th epoch, when it went from 3.2% to 21.3%. The epochs between 8 to 18 exhibited the best results of this metric, with the highest value, of 29.8%, found in epoch 14. After this moment, until the end of the training, a reduction in the metric was noted, which began to vary between 20.9% (epoch 30) to 25.6% (epoch 36), with some isolated high values, namely: epoch 33 (26.7%) and 35 (27.6%).
- Therefore, it can be concluded that the best model was found at the 14th epoch, obtaining 67% of true positives in the detection of nuclear grooves. It also showed 45.5% for mAP_0.5, 49.8% for recall (sensitivity), 43.1% for precision (positive predictive value) and an F1 score of 0.46. The metric curves obtained during the training and validation of the model are plotted in the graphs shown in Fig. 2.
RESULTS
- Nowadays, the test of choice for the investigation of malignancy of thyroid nodules is FNA associated with ultrasonography and subsequent pathological evaluation, since it is a minimally invasive method with high accuracy [2,6-11,34]. Considering that cytology analysis relies on the direct application of microscopic evaluation criteria by the cytopathologist, it is typically susceptible to interobserver variability [4,6,7,9,29,35]. In addition, it is a time-consuming and laborious process [6]. As a result, digital pathology has gained prominence, which opens the possibility for the application of computational algorithms to contribute to the cytopathological diagnosis [8,35,36].
- The identification of nuclear grooves is an important cytological marker for several thyroid lesions [16,17,19,22,23]. Although not very specific, it has a relatively high sensibility for the diagnosis of PTC, since most cytology slides obtained from PTC have large quantities of nuclear grooves [17-19,21-23,26]. This helps to distinguish this condition from other diseases [17,22,26]. Additionally, it should be noted that not only this structure, but also other nuclear modifications have gained increased prominence in cytological diagnoses of thyroid diseases [11,12,15]. In this context, it is important to highlight that the development of similar models applied to other structures, such as nuclear pseudoinclusions, could assist in distinguishing between PTC and on-invasive follicular thyroid neoplasm with papillary-like nuclear features [37].
- Computational models can contribute to standardizing cytopathological evaluations, thereby reducing both interobserver and intraobserver variability. This standardization can help minimize discrepancies in care between larger and peripheral institutes. In a study by Kuzan et al. (2021) [37], a high interobserver disagreement was demonstrated in the diagnosis of non-benign thyroid biopsies (Bethesda categories III, IV, V, and VI), revealing a percentage agreement of 50%–56.8% among evaluators, along with a general agreement of 33.6%. Additionally, the same study reported an intraobserver agreement of 62.5%–58.8% [38]. In another study conducted by Cibas et al. (2013) [38], an interobserver agreement of 64% was observed between local pathologists and central experts. The intraobserver agreement, with more than 30 days apart, ranged from 60%–83%, considering a classification system with six categories. The study also compared the accuracy of cytopathological diagnoses between the two groups mentioned above, resulting in a specificity of 40.4%–55.6%, sensitivity of 90.3%–92.0%, negative predictive value of 90.9%–89.9%, and positive predictive value of 46.8%–53.7% [38]. Moreover, when it comes to specific nuclear structures, Thomson et al. (2018) [39], while evaluating membrane irregularities (such as irregular contours, nuclear grooves, and nuclear pseudoinclusions), established a substantial agreement (k of 0.61–0.67, with standard variation of 0.15–0.26). However, a study developed by Liu et al. (2018) [40], evidenced a fair agreement for the characteristics (k of 0.228) and in the identification of nuclear grooves (k of 0.227). Thus, there exists not only a high interobserver variability in the evaluation of nuclear grooves and other nuclear structures but also variability between different institutions.
- In addition, cytopathological evaluation through light microscopy is time-consuming and laborious. Despite its confirmation as an important diagnostic tool, the use of digital pathology, in general, demands a longer period to perform the diagnosis when compared to microscopy, which has constituted an important barrier in its routine use [35,42,43]. This is confirmed with the work of House et al. (2013) [41], that studied the time of diagnosis in digital and optical cytology and concluded that cytopathologists without experience in digital cytopathology spent 4.2 minutes in digital slides against 2.9 minutes in glass slides, while those who had experience in the area presented a diagnosis time of 3.1 minutes in the digital slides against 2.0 minutes in the conventional microscopy. In this sense, it is important to note that the YOLO family of object detectors, especially the YOLOv5 variants, stands out as some of the most efficient models in their class, being able to perform thousands of inferences per second, even when applied to machines with limited processing power. Therefore, it can be inferred that the application of AI-based models can contribute to a significant reduction in the diagnostic time of digital pathology [44].
- Classification models that are based on the evaluation of multiple nuclear characteristics (mimicking the diagnostic experience of pathologists) obtained a high sensibility and predictive positive value for the diagnosis of malignancies. Regarding the diagnosis of PTC, Sanyal et al. (2018) [44] developed a CNN powered by a manually selected database that contained 186 microphotographs of PTC and 184 of other thyroid lesions processed in Romanowsky and Papanicolaou staining at 10× and 40× magnification. A sensitivity and positive predictive value of 90.5% and 63.3%, respectively, were obtained when the diagnosis of PTC was considered in 10× or 40× magnification; however, considering that the diagnosis needed to be made in both augments, 33.3% for sensitivity and 87.5% for positive predictive value were achieved. In the evaluation of selected images by pathologists, one criterion considered was the presence of nuclear grooves. However, there is no detailed data on the identification of specific nuclear structures; only a collective overview within the context of PTC was provided [32].
- In 2019, Guan et al. [45], using 279 cytological images obtained from liquid preparations processed with hematoxylin and eosin photographed at 40× magnification, applied two different architectures (VGG-16 and Inception-v3) evaluating a variety of nuclear characteristics (contours, perimeter and area of average pixel intensity), obtaining a sensitivity of 98.5%–100% and a positive predictive value of 89.5%–95.8% also in the diagnosis of PTC.
- Recently, Duan et al. (2022) [46] developed a two-stage CNN, with an object detection module (based on YOLOv4, with malignant thyroid regions manually annotated by pathologists) and a classification module (based on EfficientNet), which used 360 WSI with liquid-based cytological preparation, that were divided into “positive” (including 222 images classified as Bethesda 1) and “negative” (including 10 images with Bethesda 2, 2 images with Bethesda 3, 36 images with Bethesda 36 and 90 images with Bethesda 6), totaling 29.780 images for the object detection module and 63.356 images for the classification module; with this model, 97.9% for F1 score, 98.08% for recall and 97.83% for precision were obtained for the proposed classification [46].
- Also, using 367 Papanicolaou stained images photographed at 40× magnification, with an ensemble deep learning methods and stain normalization, Nguyen et al. (2022) [47] improved the automatic classification of PTC cell clusters from FNA, obtaining a mean sensitivity of 0.97 using DenseNet161 [47].
- To the best of our knowledge, this is the only work whose objective was to evaluate exclusively the presence of the nuclear groove in images obtained from a Diff-Quik stained digitized slide, using an object detection model (CNN based on YOLOv5 architecture).
- In this investigation, we illustrated the potential for detecting nuclear alterations, such as grooves in digitalized slides stained with Diff-Quik, utilizing computer vision and deep learning. While our findings suggest partial feasibility of this approach, it is imperative to acknowledge significant limitations that may impact the robustness of the results obtained. However, these limitations do not preclude the potential for identifying nuclear structures through an AI-based approach.
- This assertion is substantiated by the model’s development of a rule governing true bounding boxes, signifying its capacity to extract defining characteristics of a nuclear groove, resulting in a commendable true positive rate of 67%. Despite the identified limitations, the model demonstrated a partial ability to locate and scale the object under study, evidenced by a mAP of 45.5%, sensitivity of 49.8%, and positive predictive value of 43.1%.
- While these results indicate promise, it is essential to interpret them with caution considering the acknowledged constraints. The study suggests that, despite limitations, utilizing an AI approach for identifying nuclear structures remains a viable avenue, paving the way for further refinement and exploration in future research endeavors.
- Also, in our results, it is crucial to emphasize the observed improvement in metrics within the training group over the 50 epochs. This trend, characterized by a gradual decrease in the values of the loss functions, is not uncommon and aligns with expectations for models of this nature. This phenomenon arises because, with each epoch, the model undergoes a new cycle using the same images from the training group. The iterative adjustment of weights based on these training images naturally leads to a reduction in errors.
- However, it is noteworthy that the concurrent increase in the loss functions associated with the validation group, particularly after the 14th epoch, signals the onset of overfitting. This phenomenon indicates that the model has become excessively attuned to the specific data within the training group, compromising its ability to generalize to untrained data in the validation group. Another indicative factor for the onset of overfitting is the presence of fluctuating recall and accuracy values.
- Although the aforementioned studies varied in terms of the model’s application, employing a classification system, our results hint at the limitations inherent in our own study. The relatively small database utilized may have influenced the obtained results, potentially diminishing the model’s generalization capacity. Moreover, the fact that annotation was conducted by a single pathologist could be considered a limitation. The annotation task demands extensive review and meticulous attention to detail. Additionally, the utilization of only MGG-stained cytology may have affected the outcomes. While nuclear grooves are typically visualized in most PTC cytology MGG-stained slides, this staining method primarily highlights cytoplasmic detail, potentially compromising the visualization of nuclear structures [24-26]. Furthermore, considering that the evaluation of nuclear structures constitutes an important cause of diagnostic disagreement between optical and digital observation of cytology, the annotations may not have been the most representative [48].
- It is possible to observe that the potential of the application of AI is enormous. This phenomenon becomes specially promising in thyroidology. However, there are several challenges for the implementation, in practice, of computational-based models [35]. In this regard, some obstacles that are still encountered include the development of the model, the quality and representativeness of the data, the interpretability, the validation of the algorithm and the clinical adoption [28].
- The application of CNNs and deep learning is feasible. In this regard, considering that the methodology used can be applied in the identification of the most diverse nuclear and cellular characteristics, new perspectives might be used to increase the accuracy of the exam. Also, the association with other nuclear structures seems to improve the possible applicability. In addition, the results show the importance of the quality of the database used for the fine tuning of the model. Therefore, notable improvements might occur with the resolution of the points mentioned above.
DISCUSSION
-
Ethics Statement
All procedures performed in the current study were approved by the Ethics Committee in Research of the Federal University of Bahia (CAAE 49095021.2.0000.5662) in accordance with the 1964 Helsinki declaration and its later amendments. Formal written informed consent was not required, waiver which was approved by the aforementioned ethics committee.
-
Availability of Data and Material
The datasets generated or analyzed during the study are not publicly available due to the proprietary nature of the data and privacy considerations inherent in cytological research, but are available from the corresponding author on reasonable request.
-
Code Availability
Not applicable.
-
Author Contributions
Conceptualization: PRFR, HER. Data curation: PRFR, JMP, KSN, JV. Formal analysis: PRFR, JMP, HER. Investigation: PRFR, JMP, KSN, HER. Methodology: PRFR, JMP, JV, HER. Resources: PRFR, JMP, KSN, SL, JV, CE, HER. Software: JMP, JV. Supervision: HER. Visualization: PRFR, JMP, KSN, CE, HER. Writing—original draft: PRFR, JMP, KSN, CE, HER. Writing—review & editing: PRFR, JMP, KSN, SL, JV, FH, FELB, GJRM, ETK, CE, HER. Approval of final manuscript: all authors.
-
Conflicts of Interest
The authors declare that they have no potential conflicts of interest.
-
Funding Statement
No funding to declare.
Notes


- 1. Bray F, Ferlay J, Soerjomataram I, Siegel RL, Torre LA, Jemal A. Global cancer statistics 2018: GLOBOCAN estimates of incidence and mortality worldwide for 36 cancers in 185 countries. CA Cancer J Clin 2018; 68: 394–424. ArticlePubMedPDF
- 2. Davies L, Welch HG. Increasing incidence of thyroid cancer in the United States, 1973-2002. JAMA 2006; 295: 2164–7. ArticlePubMed
- 3. Pellegriti G, Frasca F, Regalbuto C, Squatrito S, Vigneri R. Worldwide increasing incidence of thyroid cancer: update on epidemiology and risk factors. J Cancer Epidemiol 2013; 2013: 965212.ArticlePubMedPMCPDF
- 4. Mora-Guzman I, Munoz de Nova JL, Marin-Campos C, et al. Efficiency of the Bethesda System for Thyroid Cytopathology. Cir Esp (Engl Ed) 2018; 96: 363–8. ArticlePubMed
- 5. Vaccarella S, Franceschi S, Bray F, Wild CP, Plummer M, Dal Maso L. Worldwide thyroid-cancer epidemic? The increasing impact of overdiagnosis. N Engl J Med 2016; 375: 614–7. ArticlePubMed
- 6. Daskalakis A, Kostopoulos S, Spyridonos P, et al. Design of a multiclassifier system for discriminating benign from malignant thyroid nodules using routinely H&E-stained cytological images. Comput Biol Med 2008; 38: 196–203. ArticlePubMed
- 7. Chain K, Legesse T, Heath JE, Staats PN. Digital image-assisted quantitative nuclear analysis improves diagnostic accuracy of thyroid fine-needle aspiration cytology. Cancer Cytopathol 2019; 127: 501–13. ArticlePubMedPDF
- 8. Gerhard R, Teixeira S, Gaspar da Rocha A, Schmitt F. Thyroid fineneedle aspiration cytology: is there a place to virtual cytology? Diagn Cytopathol 2013; 41: 793–8. ArticlePubMed
- 9. Fragopoulos C, Pouliakis A, Meristoudis C, et al. Radial basis function artificial neural network for the investigation of thyroid cytological lesions. J Thyroid Res 2020; 2020: 5464787.ArticlePubMedPMCPDF
- 10. Schmitt WR. Punção aspirativa por agulha fina e a sua importância diagnóstica nas lesões de tireoide [Fine needle aspiration and its diagnostic importance in thyroid lesions]. Porto: Universidade do Porto, 2011.
- 11. Shurbaji MS, Gupta PK, Frost JK. Nuclear grooves: a useful criterion in the cytopathologic diagnosis of papillary thyroid carcinoma. Diagn Cytopathol 1988; 4: 91–4. ArticlePubMed
- 12. Ali SZ, Cibas ES. The Bethesda System for Reporting Thyroid Cytopathology. Cham: Springer, 2018.
- 13. Cibas ES, Ali SZ. The 2017 Bethesda System for Reporting Thyroid Cytopathology. Thyroid 2017; 27: 1341–6. ArticlePubMed
- 14. Ali SZ, VanderLaan PA. The Bethesda System for Reporting Thyroid Cytopathology. Cham: Springer, 2023.
- 15. LiVolsi VA. Papillary thyroid carcinoma: an update. Mod Pathol 2011; 24 Suppl 2: S1–9. ArticlePubMedPDF
- 16. Baloch ZW, LiVolsi VA, Asa SL, et al. Diagnostic terminology and morphologic criteria for cytologic diagnosis of thyroid lesions: a synopsis of the National Cancer Institute Thyroid Fine-Needle Aspiration State of the Science Conference. Diagn Cytopathol 2008; 36: 425–37. ArticlePubMed
- 17. Batistatou A, Scopa CD. Pathogenesis and diagnostic significance of nuclear grooves in thyroid and other sites. Int J Surg Pathol 2009; 17: 107–10. ArticlePubMedPDF
- 18. Francis IM, Das DK, Sheikh ZA, Sharma PN, Gupta SK. Role of nuclear grooves in the diagnosis of papillary thyroid carcinoma: a quantitative assessment on fine needle aspiration smears. Acta Cytol 1995; 39: 409–15. PubMed
- 19. Gould E, Watzak L, Chamizo W, Albores-Saavedra J. Nuclear grooves in cytologic preparations: a study of the utility of this feature in the diagnosis of papillary carcinoma. Acta Cytol 1989; 33: 16–20. PubMed
- 20. Das DK. Intranuclear cytoplasmic inclusions in fine-needle aspiration smears of papillary thyroid carcinoma: a study of its morphological forms, association with nuclear grooves, and mode of formation. Diagn Cytopathol 2005; 32: 264–8. ArticlePubMed
- 21. Yang YJ, Demirci SS. Evaluating the diagnostic significance of nuclear grooves in thyroid fine needle aspirates with a semiquantitative approach. Acta Cytol 2003; 47: 563–70. PubMed
- 22. Rupp M, Ehya H. Nuclear grooves in the aspiration cytology of papillary carcinoma of the thyroid. Acta Cytol 1989; 33: 21–6. PubMed
- 23. Scopa CD, Melachrinou M, Saradopoulou C, Merino MJ. The significance of the grooved nucleus in thyroid lesions. Mod Pathol 1993; 6: 691–4. PubMed
- 24. Silverman JF, Frable WJ. The use of the diff-quik stain in the immediate interpretation of fine-needle aspiration biopsies. Diagn Cytopathol 1990; 6: 366–9. ArticlePubMed
- 25. Dey P. Basic and advanced laboratory techniques in histopathology and cytology. Singapore: Springer Singapore, 2018.
- 26. Bhambhani S, Kashyap V, Das DK. Nuclear grooves. Valuable diagnostic feature in May-Grunwald-Giemsa-stained fine needle aspirates of papillary carcinoma of the thyroid. Acta Cytol 1990; 34: 809–12. PubMed
- 27. Niazi MKK, Parwani AV, Gurcan MN. Digital pathology and artificial intelligence. Lancet Oncol 2019; 20: e253–61. ArticlePubMedPMC
- 28. Bera K, Schalper KA, Rimm DL, Velcheti V, Madabhushi A. Artificial intelligence in digital pathology: new tools for diagnosis and precision oncology. Nat Rev Clin Oncol 2019; 16: 703–15. ArticlePubMedPMCPDF
- 29. Pouliakis A, Karakitsou E, Margari N, et al. Artificial neural networks as decision support tools in cytopathology: past, present, and future. Biomed Eng Comput Biol 2016; 7: 1–18. ArticlePDF
- 30. Gupta N, Sarkar C, Singh R, Karak AK. Evaluation of diagnostic efficiency of computerized image analysis based quantitative nuclear parameters in papillary and follicular thyroid tumors using paraffin-embedded tissue sections. Pathol Oncol Res 2001; 7: 46–55. ArticlePubMedPDF
- 31. Valentim FO, Coelho BP, Miot HA, et al. Follicular thyroid lesions: is there a discriminatory potential in the computerized nuclear analysis? Endocr Connect 2018; 7: 907–13. ArticlePubMedPMC
- 32. Yashaswini R, Suresh TN, Sagayaraj A. Cytological evaluation of thyroid lesions by nuclear morphology and nuclear morphometry. J Cytol 2017; 34: 197–202. ArticlePubMedPMC
- 33. Karakitsos P, Cochand-Priollet B, Guillausseau PJ, Pouliakis A. Potential of the back propagation neural network in the morphologic examination of thyroid lesions. Anal Quant Cytol Histol 1996; 18: 494–500. PubMed
- 34. Ramos HE, Vale J, Lopes S, et al. Nuclear score evaluation in follicular-patterned thyroid lesions using optical and digital environments. Endocrine 2022; 77: 486–92. ArticlePubMedPDF
- 35. Kezlarian B, Lin O. Artificial intelligence in thyroid fine needle aspiration biopsies. Acta Cytol 2021; 65: 324–9. ArticlePubMedPDF
- 36. Legesse T, Parker L, Heath J, Staats PN. Distinguishing non-invasive follicular thyroid neoplasm with papillary-like nuclear features (NIFTP) from classic and invasive follicular-variant papillary thyroid carcinomas based on cytologic features. J Am Soc Cytopathol 2019; 8: 11–7. ArticlePubMed
- 37. Kuzan TY, Guzelbey B, Turan Guzel N, Kuzan BN, Cakir MS, Canbey C. Analysis of intra-observer and inter-observer variability of pathologists for non-benign thyroid fine needle aspiration cytology according to Bethesda system categories. Diagn Cytopathol 2021; 49: 850–5. ArticlePubMedPDF
- 38. Cibas ES, Baloch ZW, Fellegara G, et al. A prospective assessment defining the limitations of thyroid nodule pathologic evaluation. Ann Intern Med 2013; 159: 325–32. ArticlePubMed
- 39. Thompson LD, Poller DN, Kakudo K, Burchette R, Nikiforov YE, Seethala RR. An international interobserver variability reporting of the nuclear scoring criteria to diagnose noninvasive follicular thyroid neoplasm with papillary-like nuclear features: a validation study. Endocr Pathol 2018; 29: 242–9. ArticlePubMedPDF
- 40. Liu Z, Bychkov A, Jung CK, et al. Interobserver and intraobserver variation in the morphological evaluation of noninvasive follicular thyroid neoplasm with papillary-like nuclear features in Asian practice. Pathol Int 2019; 69: 202–10. ArticlePubMedPDF
- 41. House JC, Henderson-Jackson EB, Johnson JO, et al. Diagnostic digital cytopathology: are we ready yet? J Pathol Inform 2013; 4: 28.ArticlePubMedPMC
- 42. Vodovnik A. Diagnostic time in digital pathology: a comparative study on 400 cases. J Pathol Inform 2016; 7: 4.ArticlePubMedPMC
- 43. Jiang P, Ergu D, Liu F, Cai Y, Ma B. A review of Yolo algorithm developments. Procedia Comput Sci 2022; 199: 1066–73. Article
- 44. Sanyal P, Mukherjee T, Barui S, Das A, Gangopadhyay P. Artificial intelligence in cytopathology: a neural network to identify papillary carcinoma on thyroid fine-needle aspiration cytology smears. J Pathol Inform 2018; 9: 43.ArticlePubMedPMC
- 45. Guan Q, Wang Y, Ping B, et al. Deep convolutional neural network VGG-16 model for differential diagnosing of papillary thyroid carcinomas in cytological images: a pilot study. J Cancer 2019; 10: 4876–82. ArticlePubMedPMC
- 46. Duan W, Gao L, Liu J, et al. Computer-assisted fine-needle aspiration cytology of thyroid using two-stage refined convolutional neural network. Electronics 2022; 11: 4089.Article
- 47. Nguyen DUC, Lee YM, Park J. An Ensemble deep learning for automatic prediction of papillary thyroid carcinoma using fine needle aspiration cytology. Expert Syst Appl 2021; 188: 115927.Article
- 48. Aloqaily A, Polonia A, Campelos S, et al. Digital versus optical diagnosis of follicular patterned thyroid lesions. Head Neck Pathol 2021; 15: 537–43. ArticlePubMedPDF
References
Figure & Data
References
Citations
 PubReader
 ePub Link
-
 Cite this Article
- Cite this Article
-
- Close
- Download Citation
- Close
- Figure
-