E-submission
Articles
- Page Path
- HOME > J Pathol Transl Med > Volume 58(2); 2024 > Article
-
Original Article
Clinicopathological implications of immunohistochemical expression of TBX21, CXCR3, GATA3, CCR4, and TCF1 in nodal follicular helper T-cell lymphoma and peripheral T-cell lymphoma, not otherwise specified -
Bogyeong Han1
 , Sojung Lim1, Jeemin Yim2, Young Keun Song1, Jiwon Koh1, Sehui Kim3, Cheol Lee1, Young A Kim2, Yoon Kyung Jeon1,4
 -
Journal of Pathology and Translational Medicine 2024;58(2):59-71.
DOI: https://doi.org/10.4132/jptm.2024.01.04
Published online: January 22, 2024
1Department of Pathology, Seoul National University Hospital, Seoul National University College of Medicine, Seoul, Korea
2Department of Pathology, Seoul Metropolitan Government Seoul National University Boramae Medical Center, Seoul, Korea
3Department of Pathology, Korea University Guro Hospital, Seoul, Korea
4Seoul National University Cancer Research Institute, Seoul, Korea
-
Corresponding Author: Yoon Kyung Jeon, MD, PhD, Department of Pathology, Seoul National University Hospital, Seoul National University College of Medicine, 103 Daehak-ro, Jongno-gu, Seoul 03080, Korea Tel: +82-2-740-8323, Fax: +82-2-743-5530, E-mail: 'ykjeon@snu.ac.kr'
Corresponding Author: Young A Kim, MD, PhD, Department of Pathology, Seoul Metropolitan Government Boramae Hospital, Seoul National University College of Medicine, 20, Boramae-ro 5-gil, Dongjak-gu, Seoul 07061, Korea Tel: +82-2-870-2643, Fax: +82-2-831-0261, E-mail: 'fyakim@snu.ac.kr'
© 2024 The Korean Society of Pathologists/The Korean Society for Cytopathology
This is an Open Access article distributed under the terms of the Creative Commons Attribution Non-Commercial License (https://creativecommons.org/licenses/by-nc/4.0) which permits unrestricted non-commercial use, distribution, and reproduction in any medium, provided the original work is properly cited.
- 1,544 Views
- 219 Download
Abstract
-
Background
- The classification of nodal peripheral T-cell lymphoma (PTCL) has evolved according to histology, cell-of-origin, and genetic alterations. However, the comprehensive expression pattern of follicular helper T-cell (Tfh) markers, T-cell factor-1 (TCF1), and Th1-and Th2-like molecules in nodal PTCL is unclear.
-
Methods
- Eighty-two cases of nodal PTCL were classified into 53 angioimmunoblastic T-cell lymphomas (AITLs)/nodal T-follicular helper cell lymphoma (nTFHL)-AI, 18 PTCLs-Tfh/nTFHL–not otherwise specified (NOS), and 11 PTCLs-NOS according to the revised 4th/5th World Health Organization classifications. Immunohistochemistry for TCF1, TBX21, CXCR3, GATA3, and CCR4 was performed.
-
Results
- TCF1 was highly expressed in up to 68% of patients with nTFHL but also in 44% of patients with PTCL-NOS (p > .05). CXCR3 expression was higher in AITLs than in non-AITLs (p = .035), whereas GATA3 expression was higher in non-AITL than in AITL (p = .007) and in PTCL-Tfh compared to AITL (p = .010). Of the cases, 70% of AITL, 44% of PTCLTfh/nTFHL-NOS, and 36% of PTCL-NOS were subclassified as the TBX21 subtype; and 15% of AITL, 38% of PTCL-Tfh/nTFHL-NOS, and 36% of PTCL-NOS were subclassified as the GATA3 subtype. The others were an unclassified subtype. CCR4 expression was associated with poor progression-free survival (PFS) in patients with PTCL-Tfh (p < .001) and nTFHL (p = .023). The GATA3 subtype showed poor overall survival in PTCL-NOS compared to TBX21 (p = .046) and tended to be associated with poor PFS in patients with non-AITL (p = .054).
-
Conclusions
- The TBX21 subtype was more prevalent than the GATA3 subtype in AITL. The GATA3 subtype was associated with poor prognosis in patients with non-AITL and PTCL-NOS.
- Patients
- A total of 82 nodal PTCL patients diagnosed from 2001 to 2021 at the Seoul National University Hospital (SNUH) were enrolled. The patients’ diagnoses were reviewed and classified based on the revised 4th and 5th WHO classification guidelines (WHO4R and WHO5, respectively). Some of the patients were included in our previous studies [25,26]. All cases were classified as having AITL (i.e., nTFHL-AI by WHO5), PTCL-Tfh (i.e., nTFHL-NOS by WHO5), or PTCL-NOS (i.e., PTCL-NOS by WHO5). For comparison, AITL and PTCL-Tfh were grouped into nTFHL, whereas PTCL-Tfh and PTCL-NOS were classified as non-AITL.
- Immunohistochemistry
- Immunohistochemical (IHC) studies were performed using FFPE with the following antibodies: CD10 (clone 56C6, Novocastra, Newcastle, UK), BCL6 (clone LN22, Novocastra), PD-1 (clone MRQ-22, Cell Marque, Rocklin, CA, USA), CXCR5 (clone 51505, R&D Systems, Minneapolis, MN, USA), ICOS (clone EPR20560, Abcam, Cambridge, UK), TCF1 (C63D9, Cell Signaling Technology, Danvers, MA, USA), T-bet/TBX21 (4B10, Santa Cruz Biotechnology Inc., Santa Cruz, CA, USA), CXCR3 (clone CD183, BD PharMingen, Heidelberg, Germany), GATA3 (Clone L50–823, Biocare Medical, Concord, CA, USA), CCR4 (polyclonal, catalog #: HPA031613, Sigma-Aldrich, St. Louis, MO, USA). Immunostaining was performed using a Ventana Benchmark XT (Ventana Medical Systems, Tucson, AZ, USA) or a Bond-Max Autostainer (Leica Microsystems, Melbourne, Australia). The expression of Tfh markers (CD10, BCL6, PD-1, CXCR5, and ICOS) in CD3+ cells were considered positive if they were above 10% [25]. According to the IHC subclassification algorithm in PTCL-NOS [20], TBX21 and CXCR3 were considered positive above a 20% threshold, and GATA3 and CCR4 were considered positive beyond a 50% cutoff of CD3+ cells. The proportion of positive cells for TCF1 in the total CD3+ cells were graded as 0 (0%–10%), 1+ (10%–30%), 2+ (30%–50%), and 3+ (> 50%).
- Statistical analysis
- Statistical analyses were performed using SPSS ver. 27 (IBM Corp., Armonk, NY, USA). Correlations of categorical variables were assessed using Pearson’s χ2 test and Fisher’s exact test. Correlation among the markers for classification was calculated using Spearman’s correlation. Survival analysis was conducted using the Kaplan-Meier method with the log-rank test. Two-sided p-values of less than .05 were considered statistically significant.
MATERIALS AND METHODS
- Clinical characteristics of patients with nodal PTCL
- The distribution of the 82 patients with nodal PTCL and their clinical characteristics are summarized in Table 1. Fifty-three patients were diagnosed with AITL (i.e., nTFHL-AI by WHO5), 18 with PTCL-Tfh (i.e., nTFHL-NOS by WHO5), and 11 with PTCL-NOS. Seventy-one patients were classified as having nTFHL, including AITL and PTCL-Tfh, while 29 patients, including PTCL-Tfh and PTCL-NOS, were grouped as non-AITL. The majority of these patients presented with an advanced Ann Arbor stage (3–4; 87.8%), elevated serum lactate dehydrogenase levels (76.3%), older age (> 60 years; 61.0%), high international prognostic index (IPI) score (3–5; 61.0%), and bone marrow involvement (57.0%). PTCL-NOS had male predominance (90.9%) compared to other PTCL entities (p < .05, all). Patients with AITL and nTFHL exhibited significantly higher Ann Arbor stages compared to patients with PTCL-NOS (p = .009 and p = .008, respectively). Patients with PTCL-Tfh demonstrated higher IPI score and Eastern Cooperative Oncology Group Performance Status (ECOG PS) compared to patients with PTCL-NOS (p = .026 and p = .055, respectively). B symptoms were most common in patients with AITL (vs. non-AITL, p = .016; vs. PTCL-Tfh, p = .002, respectively), but less common in patients with PTCL-Tfh than PTCL-NOS (p = .013).
- Analysis of Tfh markers and TCF1 expression in nodal PTCL
- Representative TCF1 IHC images are shown in Supplementary Fig. S1. The IHC results of five conventional Tfh markers (CD10, BCL6, PD-1, CXCR5, and ICOS) and TCF-1 are summarized in Table 2 and Supplementary Fig. S2. The expression of the five conventional Tfh markers was positively correlated with variable statistical significances (Supplementary Fig. S2). As a diagnostic marker for nTFHL, CXCR5, and PD-1 showed the highest sensitivity, whereas CD10 and BCL6 exhibited high specificity but less sensitivity. AITL expressed more Tfh markers than PTCL-Tfh (average, 3.6 and 3.1), which is consistent with a previous report [25]. TCF1 expression was positively correlated with CXCR5 (Pearson’s r = 0.317, p = .026) and ICOS expression (Pearson’s r = 0.386, p = .006). However, there was no correlation between TCF1 and CD10, BCL6, or PD-1 expression (Supplementary Fig. S2). TCF1 was frequently expressed in up to 67.8% of nTFHL cases (63.6% of AITL and 80% of PTCLTfh) but was also expressed in 44.4% of the PTCL-NOS cases (Table 2). No difference in TCF1 expression levels was seen between the AITL, PTCL-Tfh, and PTCL-NOS cases (Supplementary Fig. S1). Together, these findings suggest that TCF1 expression is highly expressed in nTFHL, but specificity is low.
- Expression pattern of Th1-like (TBX21 and CXCR3) and Th2-like (GATA3 and CCR4) markers in nodal PTCL
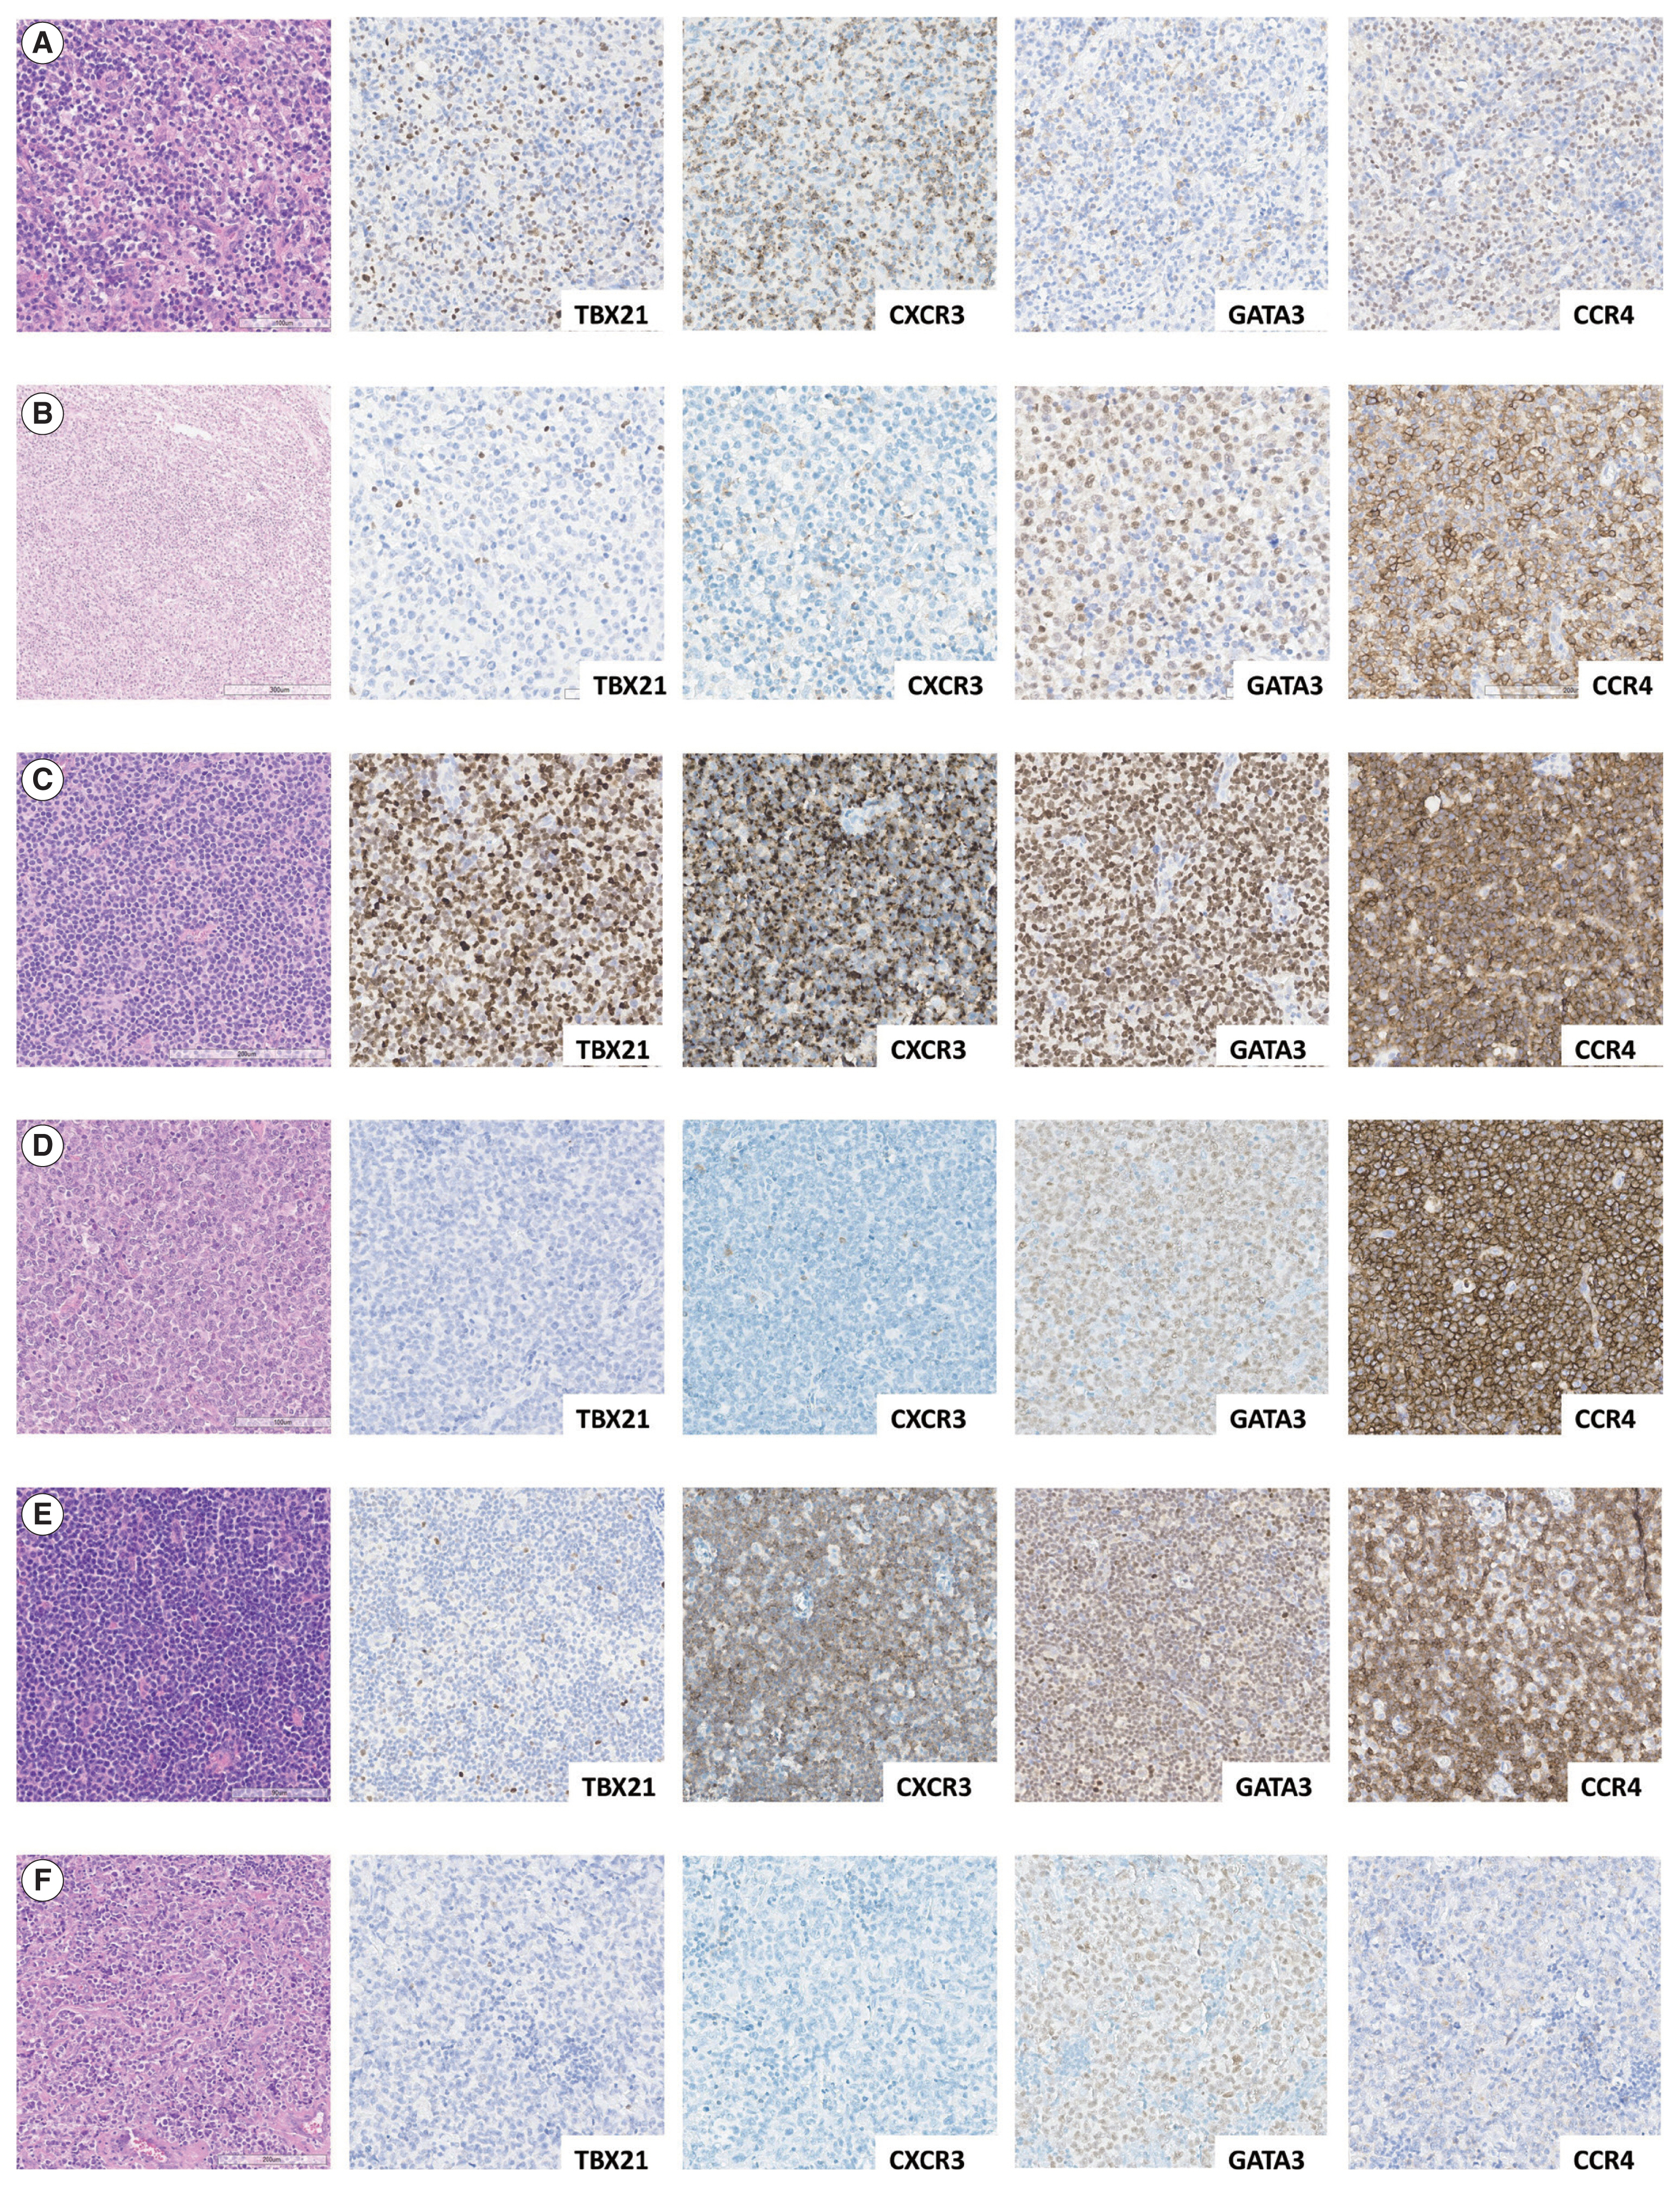
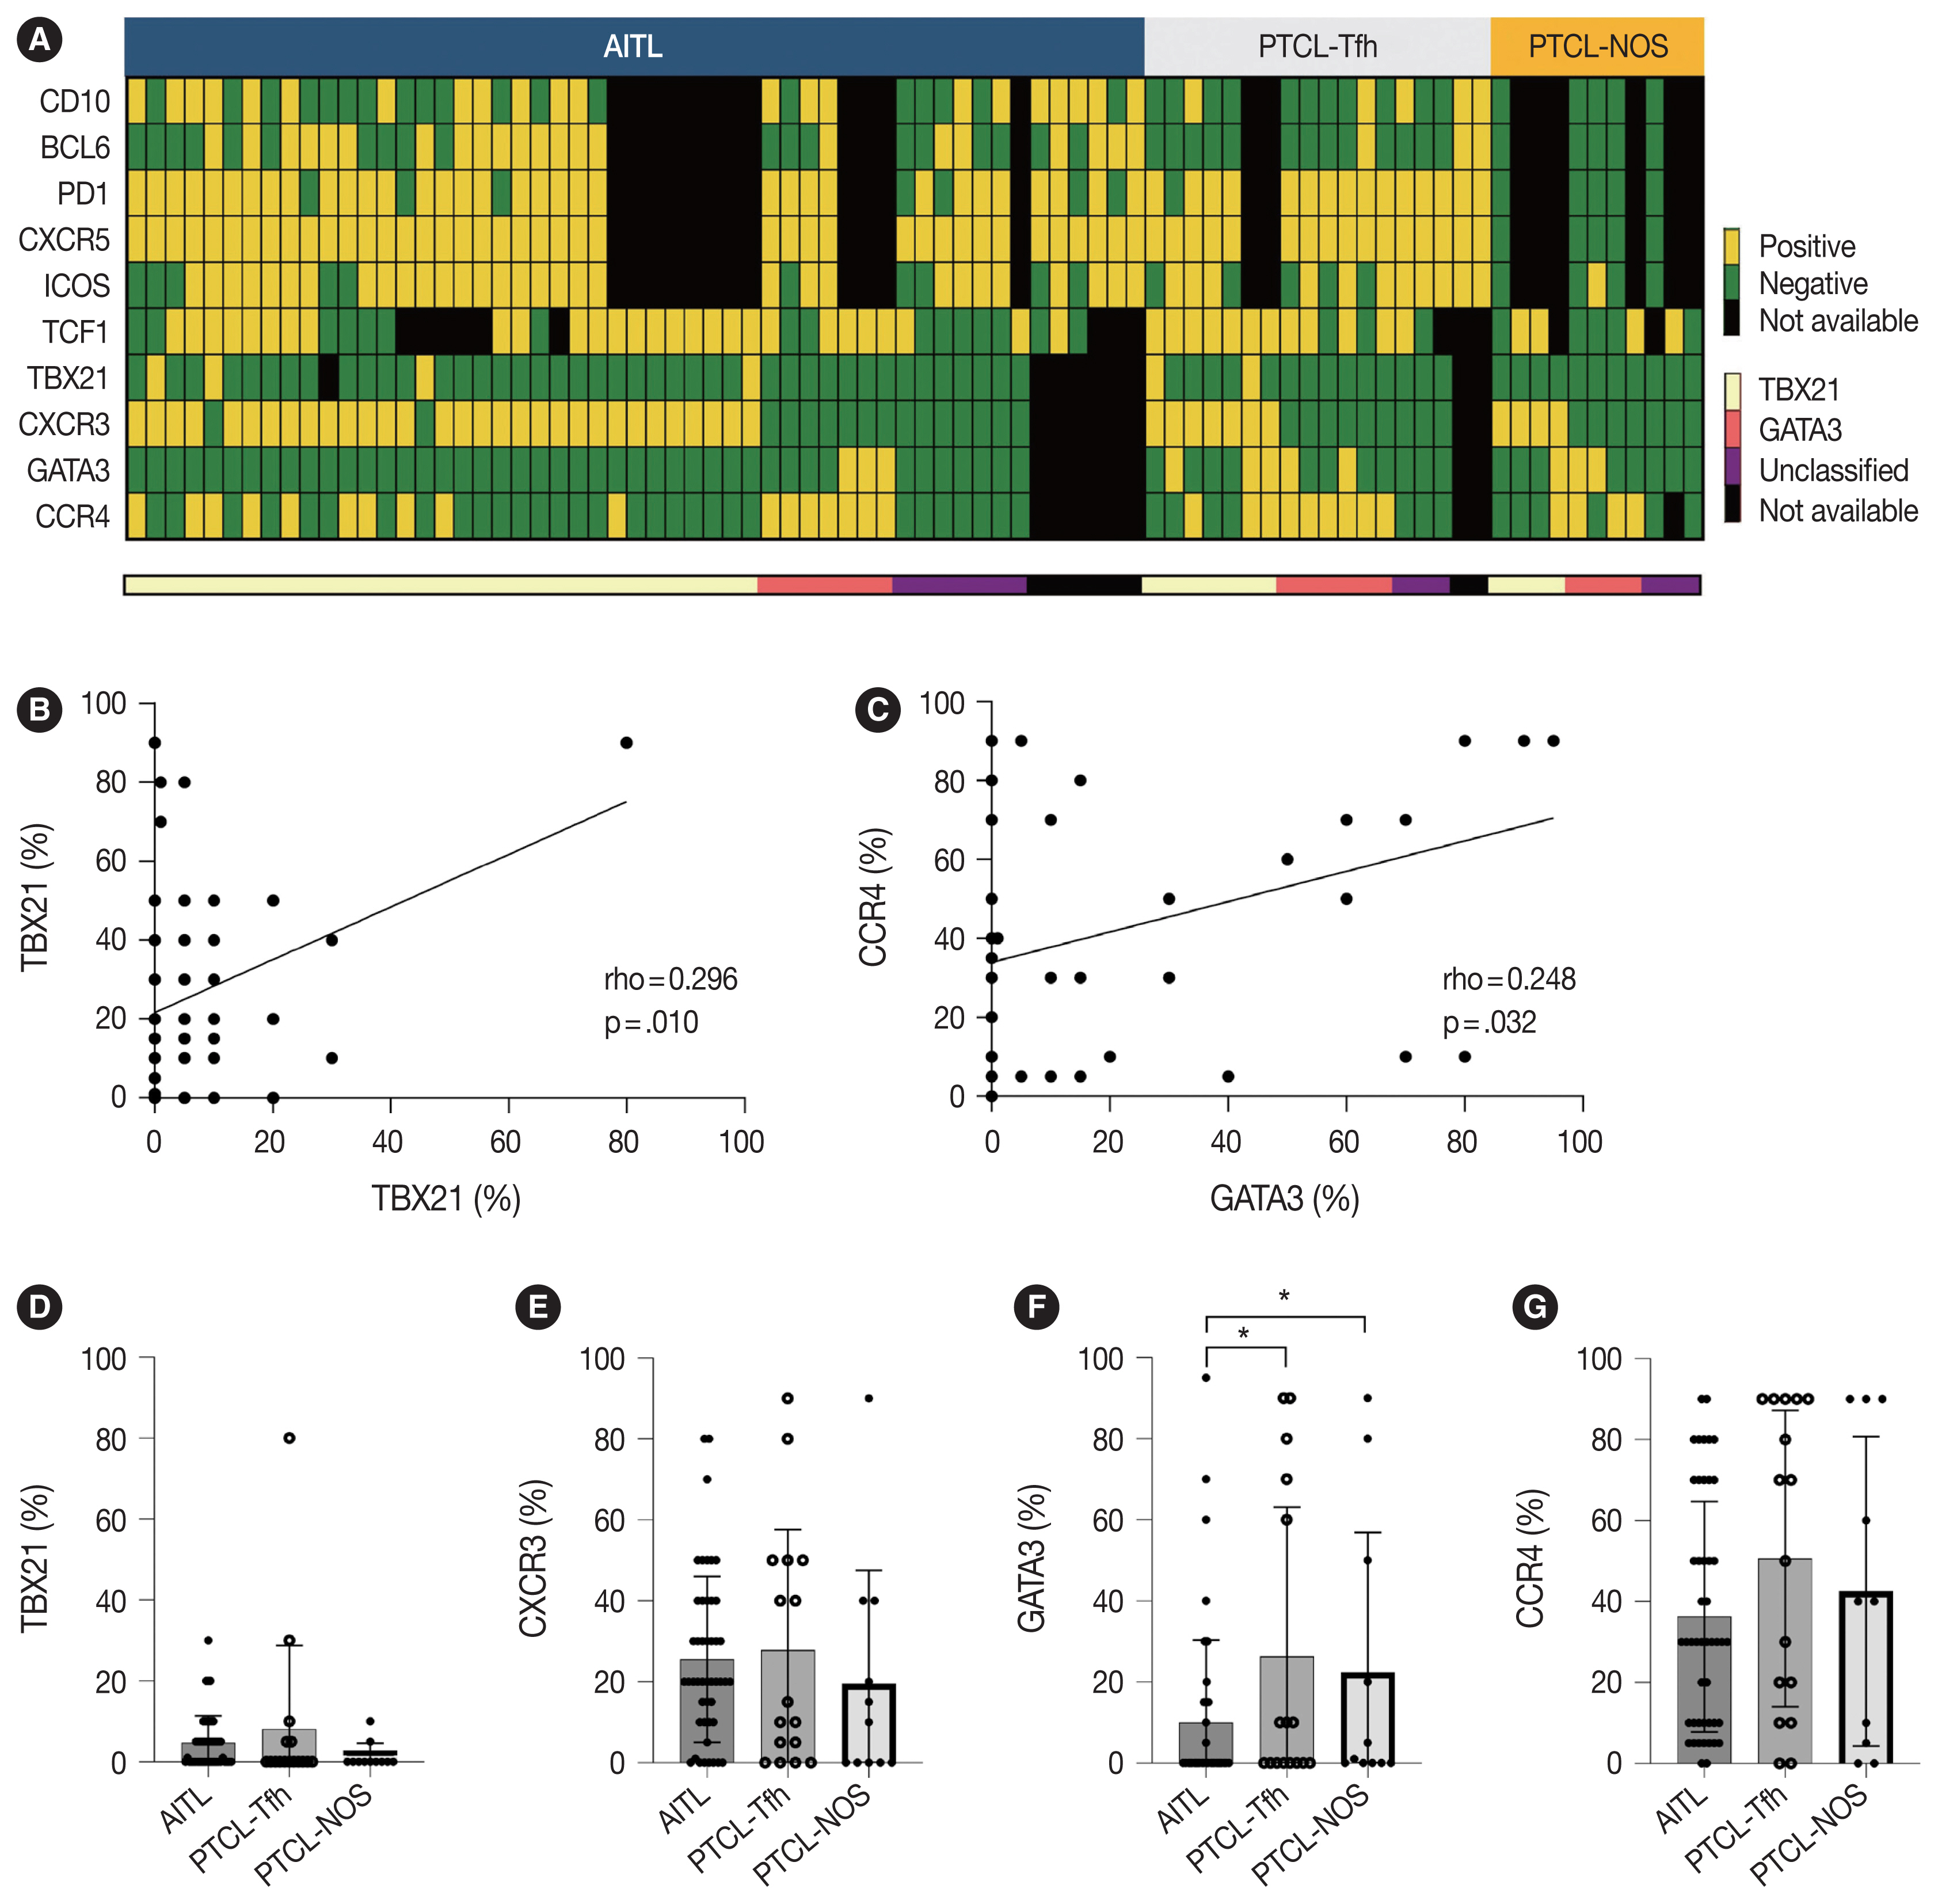
- Representative IHC images of TBX21, CXCR3, GATA3, and CCR4 in AITL, PTCL-Tfh, and PTCL-NOS cases are shown in Fig. 1, and the results are summarized in Table 2 and Fig. 2. TBX21 and GATA3 expression demonstrated a significant positive correlation with the expression of their respective target proteins, CXCR3 and CCR4, respectively (Fig. 2A–C). TBX21 showed low expression in the range of 0%–30% in suspected neoplastic cells, except for one case (Fig. 2D). While the expression levels of CXCR3 and CCR4 were not significantly different among the 3 PTCL entities, the GATA3 expression level was significantly lower in AITL compared to PTCL-Tfh and PTCL-NOS (p < .05, both) (Fig. 2E–G). When the cases were identified as positive or negative for each marker expression as described in Materials and Methods, AITL showed the lowest GATA3 positivity (vs. PTCL-NOS, p = .041; vs. PTCL-Tfh, p = .010; vs. non-AITL, p = .007) (Table 2). In contrast, AITL cases showed higher CXCR3 positivity compared to non-AITL cases (p = .035) (Table 2).
- Subclassification of nodal PTCL into TBX21 and GATA3 subtypes and their clinicopathological characteristics
- Cases were subclassified based on the TBX21, CXCR3, GATA3, and CCR4 IHC results into TBX21, GATA3, and unclassified subtypes according to the algorithm by Amador et al. [20]. Overall, 70% of AITL, 44% of PTCL-Tfh (i.e., nTFHL-NOS by WHO5), and 36% of PTCL-NOS were subclassified as the TBX21 subtype; 15% of AITL, 38% of PTCL-Tfh (i.e., nTFHL-NOS by WHO5), and 36% of PTCL-NOS into the GATA3 subtype; and the others into the unclassified subtype (Table 2). AITL frequently showed a TBX21 subtype (70%), which was statistically significant compared to non-AITL cases (p = .035) (Table 2). No difference in the proportion of TBX21 and GATA3 subtypes between PTCL-Tfh and PTCL-NOS was found (Table 2).
- We analyzed clinical features according to TBX21 and GATA3 subtype classifications (Table 3, Supplementary Table S1). In AITL, the unclassified subtypes exhibited a higher ECOG PS compared to the TBX21 and GATA3 subtypes (p = .048). Within PTCL-Tfh and non-AITL, the GATA3 subtype displayed male predominance compared to TBX21 and unclassified subtypes (p = .012 for PTCL-Tfh; p = .040 for non-AITL). In PTCL-NOS, B symptoms tended to be more common in the unclassified subtype (p = .084). Otherwise, there was no significant difference in clinical features according to TBX21 and GATA3 subtype in nodal PTCL (Table 3, Supplementary Table S1).
- Amador et al. reported that monomorphic morphology was common in PTCL-NOS of GATA3 subtype and polymorphic morphology with mixed inflammatory background was common in PTCL-NOS of TBX21 subtype [20]. In this study, no significant histologic difference was observed in PTCL-NOS according to the two subtypes.
- Survival analysis according to immunohistochemical markers and subtype classification in patients with AITL, PTCL-Tfh, nTFHL, PTCL-NOS, and non-AITL
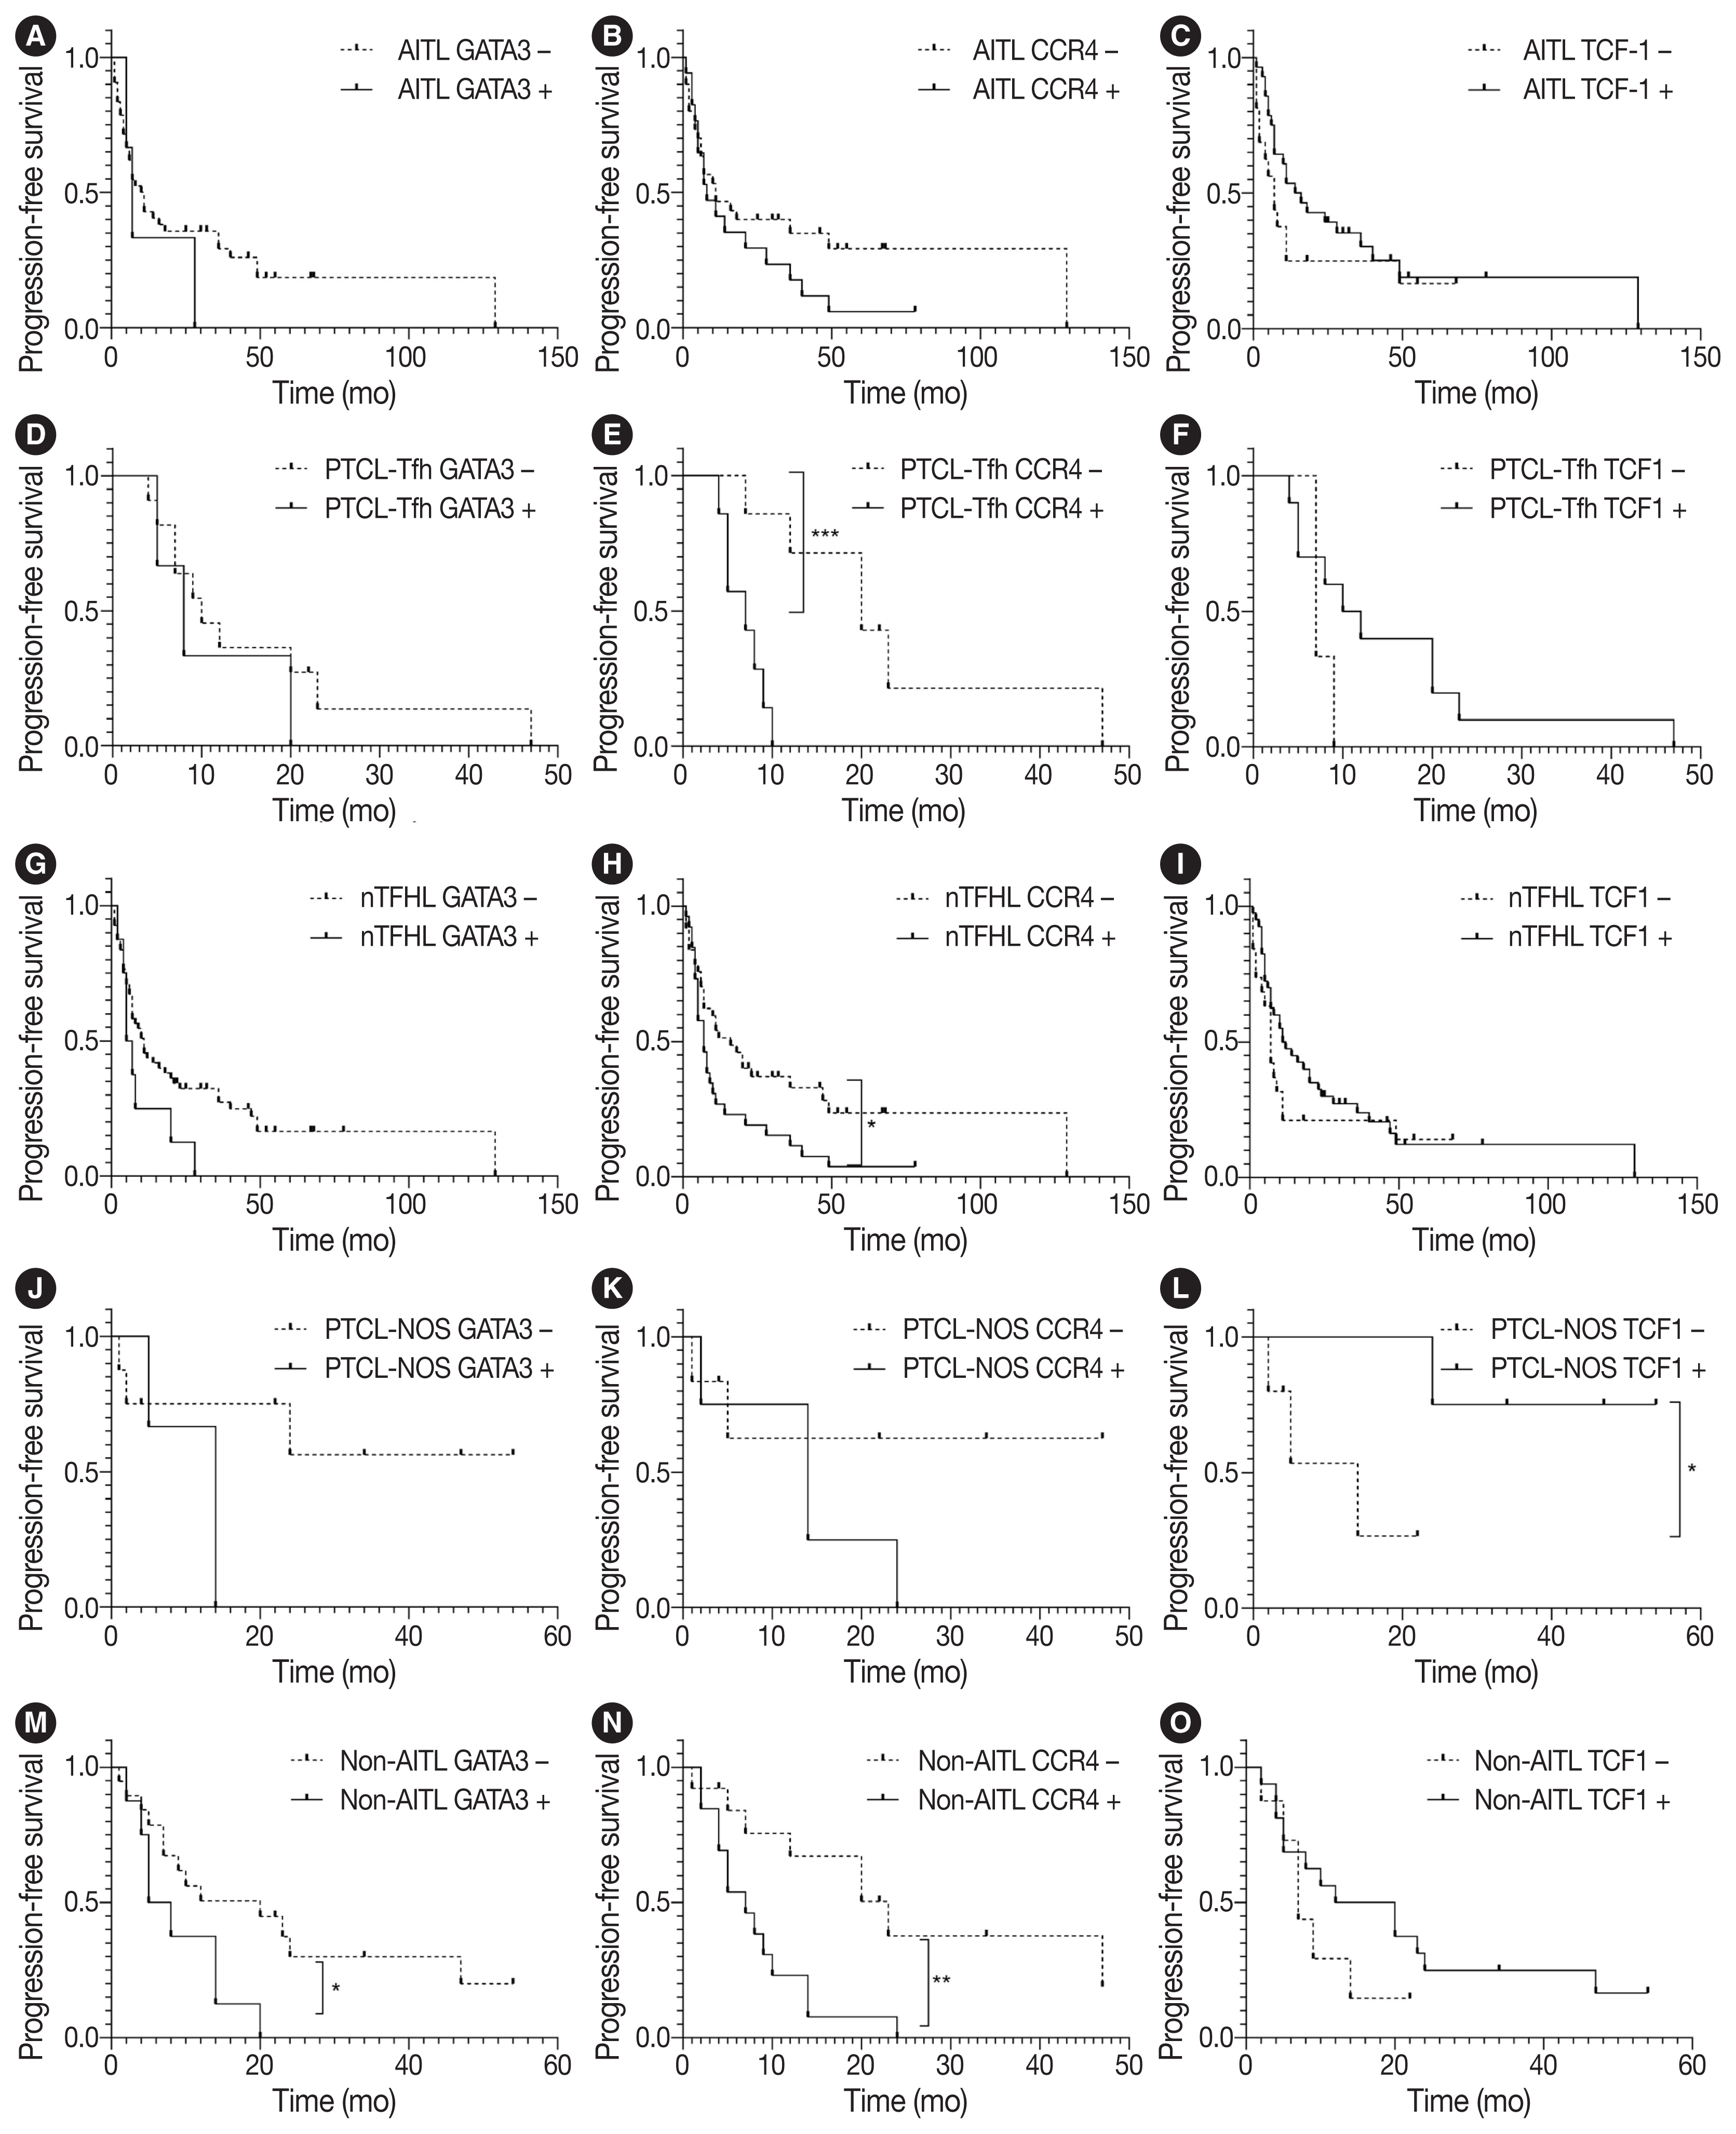
- Survival analysis according to the IHC markers and subtype classification was performed in patients with AITL, PTCL-Tfh, nTFHL, PTCL-NOS, and non-AITL. Progression-free survival (PFS) and overall survival (OS) using the Kaplan-Meier method according to GATA3, CCR4, and TCF1 expression are shown in Fig. 3 and Supplementary Fig. S3. GATA3 positivity was significantly associated with poor PFS in patients with non-AITL (p = .040). CCR4 positivity was significantly associated with poor PFS in patients with PTCL-Tfh (p < .001), nTFHL (p = .023), and non-AITL (p = .004) (Fig. 3). CCR4 positivity was also significantly associated with poor OS in patients with non-AITL (p = .016) (Supplementary Fig. S3). TCF1 positivity tended to be associated with a favorable prognosis with marginal statistical significance for PFS in patients with PTCL-NOS (p = .046) (Fig. 3L) and for OS in patients with AITL (p = .031) (Supplementary Fig. S3C). No significant difference in PFS and OS was found according to the expression of TBX21 and CXCR3 (Supplementary Figs. S4, S5).
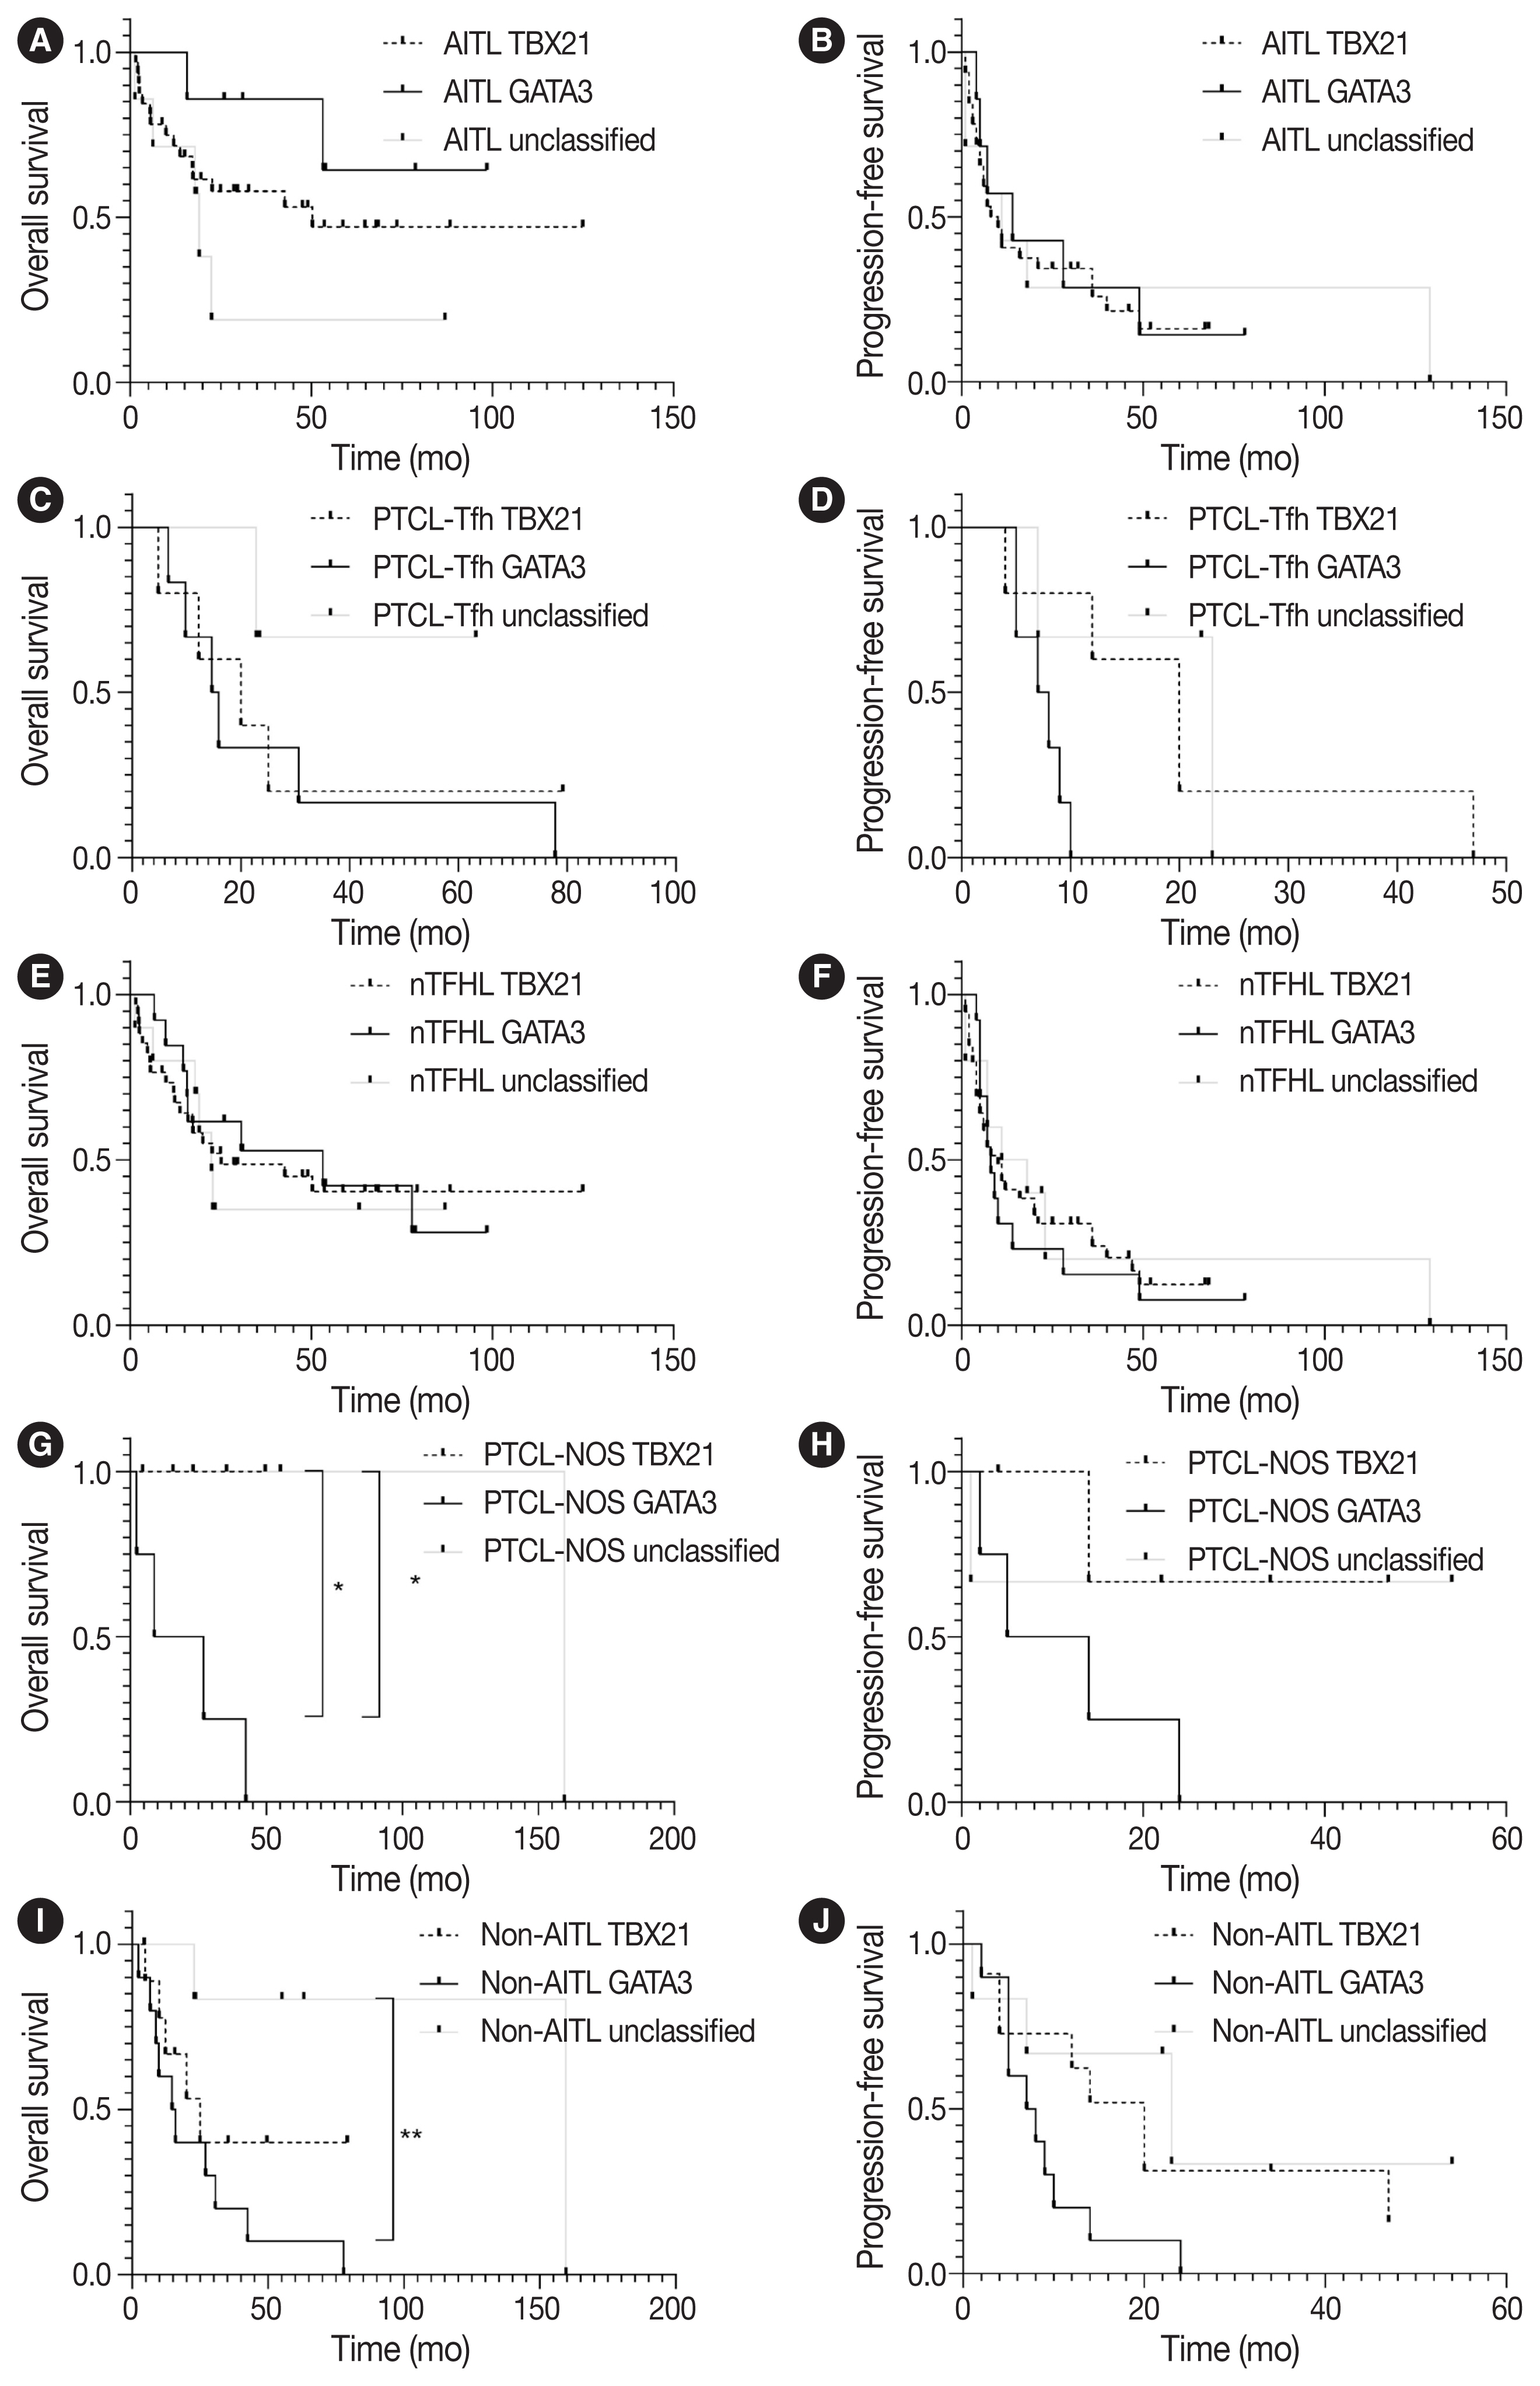
- PFS and OS using the Kaplan-Meier method according to TBX21 and GATA3 subtypes are shown in Fig. 4. The GATA3 subtype was significantly associated with poor OS in patients with PTCL-NOS (vs. TBX21 subtype, p = .046; vs. unclassified subtype, p = .033) (Fig. 4G). The GATA3 subtype was associated with poor OS in patients with non-AITL (vs. unclassified subtype, p = .008) and poor PFS (vs. TBX21 subtype, p = .054) (Fig. 4I, J).
RESULTS
- According to the latest 5th WHO and ICC classification, AITL and PTCL-Tfh/nTFHL-NOS belong to the nTFHL family. However, they show partially overlapping and some distinct clinicopathological and genetic features. For example, genetic mutations in epigenetic modifiers (i.e., DNMT3A and TET2) and RHOA, are shared, whereas IDHR172 mutations are considered exclusive to AITL [9,27]. PTCL-Tfh/nTFHL-NOS could be differentiated from PTCL-NOS based on Tfh marker expression, and approximately 40%–63% of cases previously diagnosed as PTCL-NOS are now deemed to be PTCL-Tfh/nTFHL-NOS [25,27]. Clinical studies indicated that nTFHL showed improved responsiveness to treatment involving epigenetic modifiers, such as histone deacetylase inhibitors and demethylating agents, compared to PTCL-NOS [28,29]. Therefore, nTFHL subtypes must be differentiated, and nTFHL must be distinguished from non-TFHL, particularly PTCL-NOS, for accurate diagnosis and effective management in the future. Given the importance of IHC markers for determining the Tfh phenotype in the diagnosis of PTCL, we evaluated the expression pattern of TCF1 in PTCL to explore its potential utility as a diagnostic and prognostic biomarker. TCF1 was highly expressed in up to 68% of nTFHL but also in 44% of PTCL-NOS, with no statistical difference. Thus, TCF1 may have limited diagnostic value as a potential novel marker for the Tfh phenotype, warranting further studies using a larger PTCL-NOS cohort.
- TCF1 was reported to play a role in T-cell lymphomagenesis, as well as T-cell development [30–32]. A previous study explored TCF1 expression in PTCLs (including AITL, ALCL, and PTCL-unspecified), where CXCR3 and CCR4 were used as Th1 and Th2 markers, respectively. These two markers were expressed in a mutually exclusive manner [33]. In that study, TCF1 was expressed in 46% of PTCL, particularly in 76% of Th1-like PTCL but none of Th2-like PTCL [33]. Consistently, in our present study, TCF1 expression was significantly positively correlated with CXCR3 expression (Supplementary Fig. S2) and the TBX21 subtype (Supplementary Fig. S1C) in nodal PTCLs. Although not exclusive, as in the previous study, the higher expression of TCF1 in Th1-like PTCL might suggest a potential role of TCF1 in the pathogenesis of Th1-like PTCL, requiring further studies. TCF1 is implicated in T-cell lymphomagenesis, and a study claimed that TCF1 functions as a T-cell-specific tumor suppressor [31]. In this study, we observed that TCF1 expression was associated with favorable PFS in patients with PTCL-NOS and OS in AITL, suggesting the potential of TCF1 as a positive prognostic marker and emphasizing the need for further investigations into the role of TCF1 in T-cell lymphomagenesis.
- PTCL-NOS, excluding nTFHL, still remains a heterogeneous entity. Using comprehensive gene expression profile analysis, unique subtypes of PTCL-NOS, including PTCL-TBX21 and PTCL-GATA3, have been identified [18,19]. These subtypes show distinct oncogenic pathway alterations, which may be implicated in the prognosis of patients [2,3]. Recently, subclassifications of PTCL-TBX21 and PTCL-GATA3 were validated by IHC analysis for TBX21, CXCR4, GATA3, and CCR4 [20]. However, the comprehensive expression patterns of these molecules remain unclear in nodal PTCL. We compared the expression of four IHC markers and TBX21 vs. GATA3 subtypes among AITL, PTCL-Tfh, and PTCL-NOS. Consistent with previous reports [21–24], Th1- and Th2-transcription factors and cytokines were also expressed in nTFHL. CXCR3 expression was significantly higher in AITLs than non-AITLs, whereas GATA3 expression was higher in non-AITL than in AITL and in PTCLTfh than in AITL. Based on the algorithm by Amador et al. [20], AITL frequently showed the TBX21 subtype (70%, 33/53) rather than the GATA3 subtype (15%, 7/53), whereas PTCL-Tfh and PTCL-NOS revealed comparable frequencies of TBX21 and GATA3 subtypes. These findings were partly consistent with a previous study by Yoon et al. [34], where both AITL and other TFHL frequently showed the TBX21 subtype (31/41, 75.6% and 10/11, 90.9%, respectively) compared to the GATA3 subtype.
- GATA3 acts as a proto-oncogene in T-cell lymphoma [35], and GATA3 expression and GATA3 subtype were reported to be associated with the poor prognosis of patients with PTCL-NOS [16,18,20,35]. This may be partly attributable to higher genomic complexity including PTEN and CDKN2A/B deletions, aberrant TP53 pathway (biallelic deletions/mutations), gains/amplifications of MYC and STAT, and high proliferation signature in PTCL-GATA3 cases [18,27,36]. In the present study, the GATA3 subtype was significantly associated with poor survival compared to TBX21 and unclassified subtypes in patients with PTCL-NOS and non-AITL but not in patients with AITL. These observations suggest that the prognostic implication of the GATA3 subtype might differ in the context of disease entities.
- In the present study, CCR4 expression was significantly associated with poor prognosis in patients with PTCL-Tfh, nTFHL, as well as non-AITL. CCR4 expression is reported in the majority of adult T-cell leukemia/lymphoma (ATLL), cutaneous T-cell lymphoma (CTCL), and 30%–40% of PTCL cases [37–40]. CCR4 expression was associated with the poor prognosis of patients with PTCL, unspecified, and ATLL [38,41]. Mogamulizumab, a humanized monoclonal antibody against CCR4, has been approved for the treatment of ATLL and CTCL (mycosis fungoides/Sezary Syndrome) [42,43] and also showed clinical efficacy in patients with relapsed CCR4-positive PTCL [44]. Thus, mogamulizumab could be a potential therapeutic option in CCR4-positive nodal PTCL patients with a poor prognosis [45].
- This study had some limitations. First, due to the disease’s rarity and data collection from a single institution, the sample size was restricted, particularly in the case of PTCL-NOS. Second, while the identification of shared molecular alterations is critical in categorizing nTFHL, this study did not explore genetic alterations. Third, PTCL often consists of heterogeneous cell populations and tumor cells with mild atypism. Thus, it sometimes is not easy to distinguish between neoplastic cells and reactive cells. Consensus interpretation of IHC results was performed after independent evaluations by two pathologists to overcome this shortening.
- In summary, our comprehensive IHC analysis of TCF1, Th1-and Th2-like markers may contribute to the evolving understanding of nodal PTCL, emphasizing the applicability and importance of these markers for accurate diagnosis and predicting prognosis and potential therapeutic targets.
DISCUSSION
Supplementary Information
-
Ethics Statement
This study was approved by the Institutional Review Board (IRB) of SNUH (No. 1506-080-681). The requirement for informed consent for participation in the study was waived by the IRB of SNUH.
-
Availability of Data and Material
All data generated or analyzed during the study are included in this published article (and its supplementary information files).
-
Code Availability
Not applicable.
-
Conflicts of Interest
The authors declare that they have no potential conflicts of interest.
-
Author Contributions
Conceptualization: YKJ, YAK. Data curation: BH, YKS, JK, SK. Formal analysis: BH, SL, JY, JK, CL, YKJ. Funding acquisition: YAK. Investigation: BH, SL, JY, YKS, JK, SK. Project Administration: BH, YKJ. Resources: CL, YKJ, YAK. Methodology: BH, SL, JY, JK, SK. Software: BH, SK. Supervision: YKJ. Visualization: BH, YKJ. Writing—original draft preparation: BH, YKJ. Writing—review & editing: BH, YKS, YKJ, YAK. Approval of final manuscript: all authors.
-
Funding Statement
This work was supported by the Development Fund from Seoul National University funded by HUNKIM FAMILY CHARITABLE FOUNDATION.
Notes


| Variable | PTCL (n = 82) | AITL (n = 53) | PTCL-Tfh (n = 18) | nTFHL (n = 71) | PTCL-NOS (n = 11) | Non-AITL (n = 29) | p-value | |||||
|---|---|---|---|---|---|---|---|---|---|---|---|---|
|
|
||||||||||||
| Three groupsa | AITL vs. PTCL-NOS | PTCL-Tfh vs. PTCL-NOS | AITL vs. PTCL-Tfh | nTFHL vs. PTCL-NOS | AITL vs. non-AITL | |||||||
| Sex | ||||||||||||
| Female | 34 (41.5) | 22 (41.5) | 11 (61.1) | 33 (46.5) | 1 (9.1) | 12 (41.4) | .022 | .041 | .006 | .150 | .019 | .991 |
| Male | 48 (58.5) | 31 (58.5) | 7 (38.9) | 38 (53.5) | 10 (90.9) | 17 (58.6) | ||||||
| Age (yr) | ||||||||||||
| ≤ 60 | 32 (39.0) | 22 (41.5) | 5 (27.8) | 27 (38.0) | 5 (45.5) | 10 (34.5) | .526 | .809 | .331 | .300 | .638 | .533 |
| > 60 | 50 (61.0) | 31 (58.5) | 13 (72.2) | 44 (62.0) | 6 (54.5) | 19 (65.5) | ||||||
| Ann Arbor stage | ||||||||||||
| 1–2 | 10 (12.2) | 4 (7.5) | 2 (11.1) | 6 (8.5) | 4 (36.4) | 6 (20.7) | .029 | .009 | .103 | .639 | .008 | .082 |
| 3–4 | 72 (87.8) | 49 (92.5) | 16 (88.9) | 65 (91.5) | 7 (63.6) | 23 (79.3) | ||||||
| IPI score | ||||||||||||
| 0–2 | 32 (39.0) | 21 (39.6) | 4 (22.2) | 25 (35.2) | 7 (63.6) | 11 (37.9) | .084 | .144 | .026 | .182 | .072 | .881 |
| 3–5 | 50 (61.0) | 32 (60.4) | 14 (77.8) | 46 (64.8) | 4 (36.4) | 18 (62.1) | ||||||
| Extranodal site | ||||||||||||
| ≤ 1 | 58 (71.6) | 39 (75.0) | 11 (61.1) | 50 (71.4) | 8 (72.7) | 19 (65.5) | .528 | .875 | .523 | .261 | .929 | .364 |
| > 1 | 23 (28.4) | 13 (25.0) | 7 (38.9) | 20 (28.6) | 3 (27.3) | 10 (34.5) | ||||||
| Serum LDH | ||||||||||||
| Normal | 19 (23.8) | 10 (19.6) | 4 (22.2) | 14 (20.3) | 5 (45.5) | 9 (31.0) | .186 | .069 | .189 | .813 | .069 | .248 |
| Elevated | 61 (76.3) | 41 (80.4) | 14 (77.8) | 55 (79.7) | 6 (54.5) | 20 (69.0) | ||||||
| ≥2 | 12 (20.3) | 8 (20.0) | 4 (36.4) | 12 (16.9) | 0 | 4 (21.1) | ||||||
| B symptoms | ||||||||||||
| Absent | 48 (60.8) | 26 (51.0) | 16 (94.1) | 42 (61.8) | 6 (54.5) | 22 (78.6) | .006 | .083 | .013 | .002 | .649 | .016 |
| Present | 31 (39.2) | 25 (49.0) | 1 (5.9) | 26 (38.2) | 5 (45.5) | 6 (21.4) | ||||||
| BM involvement | ||||||||||||
| Absent | 34 (43.0) | 20 (39.2) | 7 (41.2) | 27 (39.7) | 7 (63.6) | 14 (50.0) | .328 | .138 | .246 | .886 | .137 | .354 |
| Present | 45 (57.0) | 31 (60.8) | 10 (58.8) | 41 (60.3) | 4 (36.4) | 14 (50.0) | ||||||
Values are presented as number (%) unless otherwise indicated.
PTCL, peripheral T-cell lymphoma; AITL, angioimmunoblastic T-cell lymphoma; PTCL-Tfh, peripheral T-cell lymphoma of follicular helper T-cell phenotype; nT-FHL, nodal T-follicular helper (TFH) cell lymphoma; PTCL-NOS, peripheral T-cell lymphoma, not otherwise specified; IPI, International Prognostic Index; LDH, lactate dehydrogenase; BM, bone marrow.
a AITL vs. PTCL-Tfh vs. PTCL-NOS.
| Variable | AITL (n = 53) | PTCL-Tfh (n = 18) | nTFHL (n = 71) | PTCL- NOS (n = 11) | Non-AITL (n = 29) | p-value | |||||
|---|---|---|---|---|---|---|---|---|---|---|---|
|
|
|||||||||||
| Three groupsa | AITL vs. PTCL-NOS | PTCL-Tfh vs. PTCL- NOS | AITL vs. PTCL-Tfh | nTFHL vs. PTCL-NOS | AITL vs. non-AITL | ||||||
| CD10 | |||||||||||
| Negative | 19 (46.3) | 11 (68.8) | 30 (52.6) | 5 (100) | 16 (76.2) | .038 | .023 | .152 | .128 | .041 | .025 |
| Positive | 22 (53.7) | 5 (31.3) | 27 (47.4) | 0 | 5 (23.8) | ||||||
| BCL6 | |||||||||||
| Negative | 19 (46.3) | 13 (81.3) | 32 (56.1) | 5 (100) | 18 (85.7) | .009 | .023 | .296 | .017 | .055 | .003 |
| Positive | 22 (53.7) | 3 (18.8) | 25 (43.9) | 0 | 3 (14.3) | ||||||
| PD-1 | |||||||||||
| Negative | 7 (17.1) | 1 (6.3) | 8 (14) | 5 (100) | 6 (28.6) | < .001 | < .001 | < .001 | .290 | < .001 | .293 |
| Positive | 34 (82.9) | 15 (93.8) | 49 (86) | 0 | 15 (71.4) | ||||||
| CXCR5 | |||||||||||
| Negative | 0 | 0 | 0 | 5 (100) | 5 (23.8) | < .001 | < .001 | < .001 | - | < .001 | .001 |
| Positive | 41 (100) | 16 (100) | 57 (100) | 0 | 16 (76.2) | ||||||
| ICOS | |||||||||||
| Negative | 10 (24.4) | 5 (31.3) | 15 (26.3) | 4 (80.0) | 9 (42.9) | .039 | .011 | .055 | .597 | .013 | .136 |
| Positive | 31 (75.6) | 11 (68.8) | 42 (73.7) | 1 (20.0) | 12 (57.1) | ||||||
| TCF1 | |||||||||||
| Negative | 16 (36.4) | 3 (20.0) | 19 (32.2) | 5 (55.6) | 8 (33.3) | .204 | .283 | .074 | .241 | .172 | .803 |
| Positive | 28 (63.6) | 12 (80.0) | 40 (67.8) | 4 (44.4) | 16 (66.7) | ||||||
| TBX21 | |||||||||||
| Negative | 42 (91.3) | 14 (87.5) | 56 (90.3) | 11 (100) | 25 (92.6) | .500 | .310 | .223 | .658 | .281 | .847 |
| Positive | 4 (8.7) | 2 (12.5) | 6 (9.7) | 0 | 2 (7.4) | ||||||
| CXCR3 | |||||||||||
| Negative | 16 (34.0) | 9 (56.3) | 25 (39.7) | 7 (63.6) | 16 (59.3) | .101 | .071 | .701 | .117 | .139 | .035 |
| Positive | 31 (66.0) | 7 (43.8) | 38 (60.3) | 4 (36.4) | 11 (40.7) | ||||||
| GATA3 | |||||||||||
| Negative | 44 (93.6) | 11 (68.8) | 55 (87.3) | 8 (72.7) | 19 (70.4) | .025 | .041 | .824 | .010 | .210 | .007 |
| Positive | 3 (6.4) | 5 (31.3) | 8 (12.7) | 3 (27.3) | 8 (29.6) | ||||||
| CCR4 | |||||||||||
| Negative | 30 (63.8) | 7 (43.8) | 37 (58.7) | 6 (60.0) | 13 (50.0) | .369 | .820 | .420 | .159 | .940 | .250 |
| Positive | 17 (36.2) | 9 (56.3) | 26 (41.3) | 4 (40.0) | 13 (50.0) | ||||||
| Subclassification | |||||||||||
| TBX21 | 33 (70.2) | 7 (43.8) | 40 (63.5) | 4 (36.4) | 11 (40.7) | .135 | .102 | .860 | .112 | .239 | .035 |
| GATA3 | 7 (14.9) | 6 (37.5) | 13 (20.6) | 4 (36.4) | 10 (37.0) | ||||||
| Unclassified | 7 (14.9) | 3 (18.8) | 10 (15.9) | 3 (27.3) | 6 (22.2) | ||||||
Values are presented as number (%) unless otherwise indicated.
AITL, angioimmunoblastic T-cell lymphoma; PTCL-Tfh, peripheral T-cell lymphoma of follicular helper T-cell phenotype; nTFHL, nodal T-follicular helper (TFH) cell lymphoma; PTCL-NOS, peripheral T-cell lymphoma, not otherwise specified; PD-1, programmed death-1; CXCR5, C-X-C motif chemokine receptor 5; ICOS, inducible T cell costimulator; TCF1, T-cell factor-1; TBX21, T-box transcription factor 21; GATA3, GATA binding protein 3; CCR4, C-C motif chemokine receptor 4.
a AITL vs. PTCL-Tfh vs. PTCL-NOS.
Values are presented as number (%).
TBX21, T-box transcription factor 21; GATA3, GATA binding protein 3; AITL, angioimmunoblastic T-cell lymphoma; PTCL-Tfh, peripheral T-cell lymphoma of follicular helper T-cell phenotype; nTFHL, nodal T-follicular helper (TFH) cell lymphoma; PTCL-NOS, peripheral T-cell lymphoma, not otherwise specified; IPI, International Prognostic Index; LDH, lactate dehydrogenase; ECOG PS, Eastern Cooperative Oncology Group performance status; BM, bone marrow.
- 1. Swerdlow SH, Campo E, Harris NL, et al. WHO classification of tumours of haematopoietic and lymphoid tissues. Revised 4th ed. Geneva: World Health Organization, 2017.
- 2. Alaggio R, Amador C, Anagnostopoulos I, et al. The 5th edition of the World Health Organization classification of haematolymphoid tumours: lymphoid neoplasms. Leukemia 2022; 36: 1720–48. PubMedPMC
- 3. Campo E, Jaffe ES, Cook JR, et al. The International Consensus Classification of Mature Lymphoid Neoplasms: a report from the Clinical Advisory Committee. Blood 2022; 140: 1229–53. PubMedPMC
- 4. Vallois D, Dobay MP, Morin RD, et al. Activating mutations in genes related to TCR signaling in angioimmunoblastic and other follicular helper T-cell-derived lymphomas. Blood 2016; 128: 1490–502. ArticlePubMedPDF
- 5. Palomero T, Couronne L, Khiabanian H, et al. Recurrent mutations in epigenetic regulators, RHOA and FYN kinase in peripheral T cell lymphomas. Nat Genet 2014; 46: 166–70. ArticlePubMedPMCPDF
- 6. Lemonnier F, Couronne L, Parrens M, et al. Recurrent TET2 mutations in peripheral T-cell lymphomas correlate with TFH-like features and adverse clinical parameters. Blood 2012; 120: 1466–9. ArticlePubMedPDF
- 7. Yoo HY, Sung MK, Lee SH, et al. A recurrent inactivating mutation in RHOA GTPase in angioimmunoblastic T cell lymphoma. Nat Genet 2014; 46: 371–5. ArticlePubMedPDF
- 8. Sakata-Yanagimoto M, Enami T, Yoshida K, et al. Somatic RHOA mutation in angioimmunoblastic T cell lymphoma. Nat Genet 2014; 46: 171–5. ArticlePubMedPDF
- 9. Dobay MP, Lemonnier F, Missiaglia E, et al. Integrative clinicopathological and molecular analyses of angioimmunoblastic T-cell lymphoma and other nodal lymphomas of follicular helper T-cell origin. Haematologica 2017; 102: e148–51. ArticlePubMedPMC
- 10. Sandell RF, Boddicker RL, Feldman AL. Genetic landscape and classification of peripheral T cell lymphomas. Curr Oncol Rep 2017; 19: 28.ArticlePubMedPMCPDF
- 11. Ondrejka SL, Amador C, Climent F, et al. Follicular helper T-cell lymphomas: disease spectrum, relationship with clonal hematopoiesis, and mimics.. A report of the 2022 EA4HP/SH lymphoma workshop. Virchows Arch 2023; 483: 349–65. ArticlePubMedPMCPDF
- 12. Vega F, Medeiros LJ. A suggested immunohistochemical algorithm for the classification of T-cell lymphomas involving lymph nodes. Hum Pathol 2020; 102: 104–16. ArticlePubMed
- 13. Basha BM, Bryant SC, Rech KL, et al. Application of a 5 marker panel to the routine diagnosis of peripheral T-cell lymphoma with T-follicular helper phenotype. Am J Surg Pathol 2019; 43: 1282–90. ArticlePubMed
- 14. Kim C, Jin J, Weyand CM, Goronzy JJ. The transcription factor TCF1 in T cell differentiation and aging. Int J Mol Sci 2020; 21: 6497.ArticlePubMedPMC
- 15. Qiu H, Wu H, Chan V, Lau CS, Lu Q. Transcriptional and epigenetic regulation of follicular T-helper cells and their role in autoimmunity. Autoimmunity 2017; 50: 71–81. ArticlePubMed
- 16. Wang T, Feldman AL, Wada DA, et al. GATA-3 expression identifies a high-risk subset of PTCL, NOS with distinct molecular and clinical features. Blood 2014; 123: 3007–15. ArticlePubMedPMCPDF
- 17. Iqbal J, Weisenburger DD, Greiner TC, et al. Molecular signatures to improve diagnosis in peripheral T-cell lymphoma and prognostication in angioimmunoblastic T-cell lymphoma. Blood 2010; 115: 1026–36. ArticlePubMedPMCPDF
- 18. Heavican TB, Bouska A, Yu J, et al. Genetic drivers of oncogenic pathways in molecular subgroups of peripheral T-cell lymphoma. Blood 2019; 133: 1664–76. ArticlePubMedPMCPDF
- 19. Iqbal J, Wright G, Wang C, et al. Gene expression signatures delineate biological and prognostic subgroups in peripheral T-cell lymphoma. Blood 2014; 123: 2915–23. ArticlePubMedPMCPDF
- 20. Amador C, Greiner TC, Heavican TB, et al. Reproducing the molecular subclassification of peripheral T-cell lymphoma-NOS by immunohistochemistry. Blood 2019; 134: 2159–70. ArticlePubMedPMCPDF
- 21. Ioannidou K, Ndiaye DR, Noto A, et al. In situ characterization of follicular helper CD4 T cells using multiplexed imaging. Front Immunol 2020; 11: 607626.ArticlePubMedPMC
- 22. Wang P, Wang Y, Xie L, et al. The transcription factor T-bet is required for optimal type I follicular helper T cell maintenance during acute viral infection. Front Immunol 2019; 10: 606.ArticlePubMedPMC
- 23. Sheikh AA, Groom JR. Transcription tipping points for T follicular helper cell and T-helper 1 cell fate commitment. Cell Mol Immunol 2021; 18: 528–38. ArticlePubMedPMCPDF
- 24. Schmitt N, Bentebibel SE, Ueno H. Phenotype and functions of memory Tfh cells in human blood. Trends Immunol 2014; 35: 436–42. ArticlePubMedPMC
- 25. Paik JH, Koh J, Han B, et al. Distinct and overlapping features of nodal peripheral T-cell lymphomas exhibiting a follicular helper T-cell phenotype: a multicenter study emphasizing the clinicopathological significance of follicular helper T-cell marker expression. Hum Pathol 2023; 131: 47–60. ArticlePubMed
- 26. Kim S, Kwon D, Koh J, et al. Clinicopathological features of programmed cell death-1 and programmed cell death-ligand-1 expression in the tumor cells and tumor microenvironment of angioimmunoblastic T cell lymphoma and peripheral T cell lymphoma not otherwise specified. Virchows Arch 2020; 477: 131–42. ArticlePubMedPDF
- 27. Vega F, Amador C, Chadburn A, et al. Genetic profiling and biomarkers in peripheral T-cell lymphomas: current role in the diagnostic work-up. Mod Pathol 2022; 35: 306–18. ArticlePDF
- 28. Ghione P, Faruque P, Mehta-Shah N, et al. T follicular helper phenotype predicts response to histone deacetylase inhibitors in relapsed/refractory peripheral T-cell lymphoma. Blood Adv 2020; 4: 4640–7. ArticlePubMedPMCPDF
- 29. Drieux F, Lemonnier F, Gaulard P. How molecular advances may improve the diagnosis and management of PTCL patients. Front Oncol 2023; 13: 1202964.ArticlePubMedPMC
- 30. Yu S, Zhou X, Steinke FC, et al. The TCF-1 and LEF-1 transcription factors have cooperative and opposing roles in T cell development and malignancy. Immunity 2012; 37: 813–26. ArticlePubMedPMC
- 31. Tiemessen MM, Baert MR, Schonewille T, et al. The nuclear effector of Wnt-signaling, Tcf1, functions as a T-cell-specific tumor suppressor for development of lymphomas. PLoS Biol 2012; 10: e1001430.ArticlePubMedPMC
- 32. Arnovitz S, Mathur P, Tracy M, et al. Tcf-1 promotes genomic instability and T cell transformation in response to aberrant beta-catenin activation. Proc Natl Acad Sci U S A 2022; 119: e2201493119.PubMedPMC
- 33. Dorfman DM, Greisman HA, Shahsafaei A. Loss of expression of the WNT/beta-catenin-signaling pathway transcription factors lymphoid enhancer factor-1 (LEF-1) and T cell factor-1 (TCF-1) in a subset of peripheral T cell lymphomas. Am J Pathol 2003; 162: 1539–44. PubMedPMC
- 34. Yoon SE, Cho J, Kim YJ, et al. Comprehensive analysis of clinical, pathological, and genomic characteristics of follicular helper T-cell derived lymphomas. Exp Hematol Oncol 2021; 10: 33.ArticlePubMedPMCPDF
- 35. Geng X, Wang C, Gao X, et al. GATA-3 is a proto-oncogene in T-cell lymphoproliferative neoplasms. Blood Cancer J 2022; 12: 149.ArticlePubMedPMCPDF
- 36. Maura F, Dodero A, Carniti C, et al. CDKN2A deletion is a frequent event associated with poor outcome in patients with peripheral T-cell lymphoma not otherwise specified (PTCL-NOS). Haematologica 2021; 106: 2918–26. PubMed
- 37. Ishida T, Iida S, Akatsuka Y, et al. The CC chemokine receptor 4 as a novel specific molecular target for immunotherapy in adult T-Cell leukemia/lymphoma. Clin Cancer Res 2004; 10: 7529–39. ArticlePubMedPDF
- 38. Ishida T, Inagaki H, Utsunomiya A, et al. CXC chemokine receptor 3 and CC chemokine receptor 4 expression in T-cell and NK-cell lymphomas with special reference to clinicopathological significance for peripheral T-cell lymphoma, unspecified. Clin Cancer Res 2004; 10: 5494–500. ArticlePubMedPDF
- 39. Asano N, Suzuki R, Ohshima K, et al. Linkage of expression of chemokine receptors (CXCR3 and CCR4) and cytotoxic molecules in peripheral T cell lymphoma, not otherwise specified and ALK-negative anaplastic large cell lymphoma. Int J Hematol 2010; 91: 426–35. ArticlePubMedPDF
- 40. Campbell JJ, Clark RA, Watanabe R, Kupper TS. Sezary syndrome and mycosis fungoides arise from distinct T-cell subsets: a biologic rationale for their distinct clinical behaviors. Blood 2010; 116: 767–71. PubMedPMC
- 41. Ishida T, Utsunomiya A, Iida S, et al. Clinical significance of CCR4 expression in adult T-cell leukemia/lymphoma: its close association with skin involvement and unfavorable outcome. Clin Cancer Res 2003; 9: 3625–34. PubMed
- 42. Ureshino H, Kamachi K, Kimura S. Mogamulizumab for the treatment of adult T-cell leukemia/lymphoma. Clin Lymphoma Myeloma Leuk 2019; 19: 326–31. ArticlePubMed
- 43. Kasamon YL, Chen H, de Claro RA, et al. FDA Approval summary: mogamulizumab-kpkc for mycosis fungoides and Sezary syndrome. Clin Cancer Res 2019; 25: 7275–80. PubMed
- 44. Ogura M, Ishida T, Hatake K, et al. Multicenter phase II study of mogamulizumab (KW-0761), a defucosylated anti-cc chemokine receptor 4 antibody, in patients with relapsed peripheral T-cell lymphoma and cutaneous T-cell lymphoma. J Clin Oncol 2014; 32: 1157–63. ArticlePubMed
- 45. Ngu HS, Savage KJ. Past, present and future therapeutic approaches in nodal peripheral T-cell lymphomas. Haematologica 2023; 108: 3211–26. ArticlePubMedPMCPDF
References
Figure & Data
References
Citations
 PubReader
 ePub Link
-
 Cite this Article
- Cite this Article
-
- Close
- Download Citation
- Close
- Figure
-