E-submission
Articles
- Page Path
- HOME > J Pathol Transl Med > Volume 54(4); 2020 > Article
-
Original Article
Current status of cytopathology practices in Korea: annual report on the Continuous Quality Improvement program of the Korean Society for Cytopathology for 2018 -
Yosep Chong1,*
 , Haeyoen Jung2,*, Jung-Soo Pyo3, Soon Won Hong4, Hoon Kyu Oh,5, The Committee of Quality Improvement of Korean Society for Cytopathology
 -
Journal of Pathology and Translational Medicine 2020;54(4):318-331.
DOI: https://doi.org/10.4132/jptm.2020.02.26
Published online: April 15, 2020
1Department of Hospital Pathology, College of Medicine, The Catholic University of Korea, Seoul, Korea
2Department of Pathology, Eone Laboratories, Incheon, Korea
3Department of Pathology, Eulji University Hospital, Eulji University School of Medicine, Seoul, Korea
4Department of Pathology, Gangnam Severance Hospital, Yonsei University College of Medicine, Seoul, Korea
5Department of Pathology, Daegu Catholic University School of Medicine, Daegu, Korea
- Corresponding Author: Hoon Kyu Oh, MD, PhD, Department of Pathology, Daegu Catholic University School of Medicine, 33 Duryugongwon-ro 17-gil, Nam-gu, Daegu 42472, Korea Tel: +82-53-650-4156, Fax: +82-53-650-3456, E-mail: 'ap501@cu.ac.kr'
- *Yosep Chong and Haeyoen Jung contributed equally to this work.
© 2020 The Korean Society of Pathologists/The Korean Society for Cytopathology
This is an Open Access article distributed under the terms of the Creative Commons Attribution Non-Commercial License (http://creativecommons.org/licenses/by-nc/4.0) which permits unrestricted non-commercial use, distribution, and reproduction in any medium, provided the original work is properly cited.
Abstract
-
Background
- The Korean Society for Cytopathology has conducted the Continuous Quality Improvement program for cytopathology laboratories in Korea since 1995. In 2018 as part of the program, an annual survey of cytologic data was administered to determine the current status of cytopathology practices in Korea.
-
Methods
- A questionnaire was administered to 211 cytopathology laboratories. Individual laboratories submitted their annual statistics regarding cytopathology practices, diagnoses of gynecologic samples, inadequacy rates, and gynecologic cytology-histology correlation review (CHCR) data for 2018. In addition, proficiency tests and sample adequacy assessments were conducted using five consequent gynecologic slides.
-
Results
- Over 10 million cytologic exams were performed in 2018, and this number has almost tripled since this survey was first conducted in 2004 (compounded annual growth rate of 7.2%). The number of non-gynecologic samples has increased gradually over time and comprised 24% of all exams. The overall unsatisfactory rate was 0.14%. The ratio of the cases with atypical squamous cells to squamous intraepithelial lesions accounted for up to 4.24. The major discrepancy rate of the CHCR in gynecologic samples was 0.52%. In the proficiency test, the major discrepancy rate was approximately 1%. In the sample adequacy assessment, a discrepancy was observed in 0.1% of cases.
-
Conclusions
- This study represents the current status of cytopathology practices in Korea, illustrating the importance of the Continuous Quality Improvement program for increasing the accuracy and credibility of cytopathologic exams as well as developing national cancer exam guidelines and government projects on the prevention and treatment of cancer.
- The Continuous Quality Improvement program by CQIKSC
- As mentioned earlier, the annual Continuous Quality Improvement program consists of four parts: 1, a survey of the statistics on the cytologic exams performed in the last year; 2, a PT using five glass slides; 3, a sample adequacy evaluation of five GYN glass slides submitted by the participating institutions; and 4, submission of six candidate slides by the participating institutions to be used in the PTs of the following years.
- Annual survey of cytopathology statistics
- A nationwide survey was conducted by CQIKSC from February 11, 2019, to February 22, 2019. The questionnaire and the written informed consent were collected from 211 medical institutions performing cytopathologic examinations in Korea in 2018. The questionnaire included the statistical data on overall cytologic exams, the case number of the GYN exams according to the diagnostic categories, the GYN sample adequacy, the CHCR results, and the number of discordant cases according to the discordant assessment criteria. The diagnostic concordance between the cytologic and corresponding histologic examination of the uterine cervix or endometrium was categorized as either concordant (category O) or one of three discordant categories: category A (minimal clinical impact), category B (minor clinical impact), or category C (major clinical impact). The criteria for CHCR were developed by the individual institutes according to the internal guidelines for laboratory QA. The discordant assessment criteria for PT by CQIKSC were provided to each institute as a reference for the criteria for CHCR (Tables 1–4).
- The participating institutions were categorized into three groups: university hospitals, general hospitals, and commercial laboratories. The overall cytologic exam statistics were analyzed by category. The sample categories were as follows: GYN, fine-needle aspiration (FNA), and non-GYN/non-FNA sample exams including urine, body fluids, respiratory tract samples (sputum, bronchial washing, brushing, bronchioloalveolar lavage, etc.), cerebrospinal fluid, etc. Endoscopic bronchial ultrasonography-assisted aspiration cytology samples were classified as FNA samples other than body fluids. The cystic fluids derived from anatomical body cavities, such as the pleural, peritoneal, or pericardial cavities, were classified as body fluids although they were obtained by needle aspiration.
- Proficiency test
- The second part of the Continuous Quality Improvement program, the PT, was performed in 209 medical institutions from May 3, 2019, to May 25, 2019, using a total of 1,045 glass slides. Five glass slides (2 GYN slides, 1 body fluid or urine, 2 respiratory tract sample or FNA slides) were dispatched to the participating institutions by parcel post. The candidate cases for PT, along with their cytologic diagnoses and the corresponding histologic diagnoses, were collected from the participating institutions in 2015 and 2016. The cases were reviewed by members of the CQIKSC and their eligibility for PT was confirmed. The diagnosis submitted by participating institutions was based on the Bethesda system [6] for GYN samples and on the thyroid Bethesda system [7] for thyroid FNA samples. The submitted diagnoses were evaluated using the discordance assessment criteria (Tables 1–4), and the diagnostic concordance was categorized as either concordant (category O) or as one of three discordant categories: category A (minimal clinical impact), category B (minor clinical impact), or category C (major clinical impact). The criteria for PT have been developed and modified by CQIKSC based on the potential clinical impact in relation to the clinical treatment guidelines.
- Sample adequacy assessment
- The third part of the program was the sample adequacy assessment. Each participating institution was asked to submit five GYN glass slides of any consequent number and the corresponding reported adequacy that were diagnosed in each institution on March 5, 2018. They were submitted to the CQIKSC from September 10, 2018, to September 21, 2018, and the sample adequacy was reevaluated by the members of the CQIKSC.
- Submission of samples for the QA program
- For the final part of the program, each participating institution was asked to submit six glass slides (2 GYN, 2 non-GYN, and 2 FNA) with confirmed cytologic diagnoses and the corresponding histologic diagnoses from November 26, 2018, to December 7, 2018. The eligibility of the collected samples for the PT was evaluated by the members of the CQIKSC, and eligible samples were archived to be used in the PT in the following years.
- Statistical analysis
- The correlation between total case numbers, liquid-based preparation (LBP) coverage, atypical squamous cells to squamous intraepithelial lesions ratio (ASC/SIL ratio) of participant institutions in 2018 was done using Pearson correlation analysis with Microsoft Excel 14.0.7237.5000, Microsoft Co. (Redmond, CA, USA).
MATERIALS AND METHODS
- Participating institutions
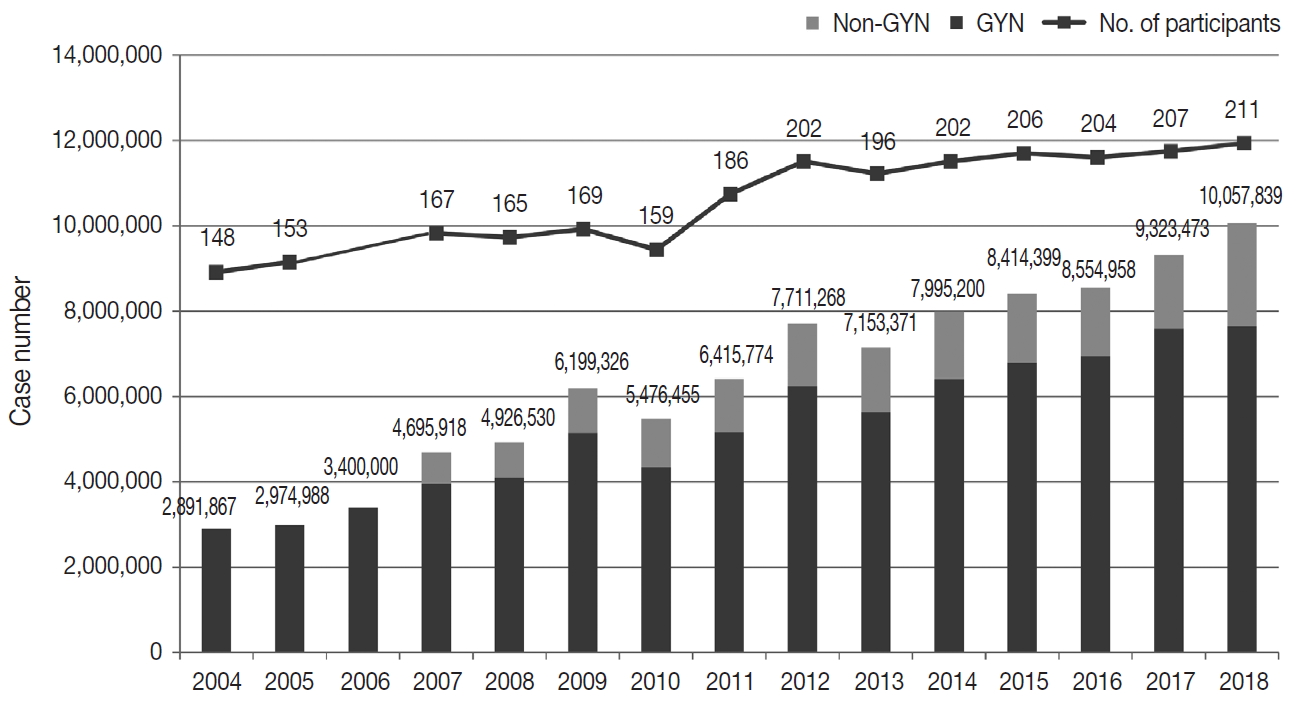
- Responses were obtained from all 211 medical institutions, including 83 university hospitals (39.3%), 84 general hospitals (39.8%), and 44 commercial laboratories (20.8%) (Fig. 1). The number of participating institutions steadily increased from 148 in 2004 to 211 in 2018. In particular, the number of commercial laboratories significantly increased from 25 (14.6%) in 2009 to 44 (20.8%) in 2018, while the number of general and university hospital laboratories slightly increased.
- Overall statistics
- The total number of cytopathologic examinations performed in 2018 was 10,057,839; this number was more than triple the number of examinations performed in 2004 (2,891,867, compounded annual growth rate: 7.2%) (Fig. 1). The number of cytologic exams performed was 1,695,625 in university hospitals (16.9%), 732,880 in general hospitals (7.3%), and 7,629,334 in commercial laboratories (75.9%). In 2018, commercial laboratories only comprised approximately 20% of the total institutions but performed over 75% of the total examinations (Supplementary Fig. S1). In 2015, commercial laboratories comprised 17.5% of the participating institutions (36 out of 206) and performed 5,717,336 out of 8,284,952 exams (69.0%), illustrating a significant increase of the segment share (69.0% to 75.9%) and the number of institutions (17.5% to 20.8%). In 2018, the average number of cytologic exams was 20,429 in university hospitals, 8,724 in general hospitals, and 173,393 in commercial laboratories. In 2015, the average number of cytologic exams was 19,320 in university hospitals, 11,080 in general hospitals, and 158,814 in commercial laboratories, illustrating a significant increase in the number of exams in university hospitals and commercial laboratories and a significant decrease in the number of exams in general hospitals.
- GYN and non-GYN samples
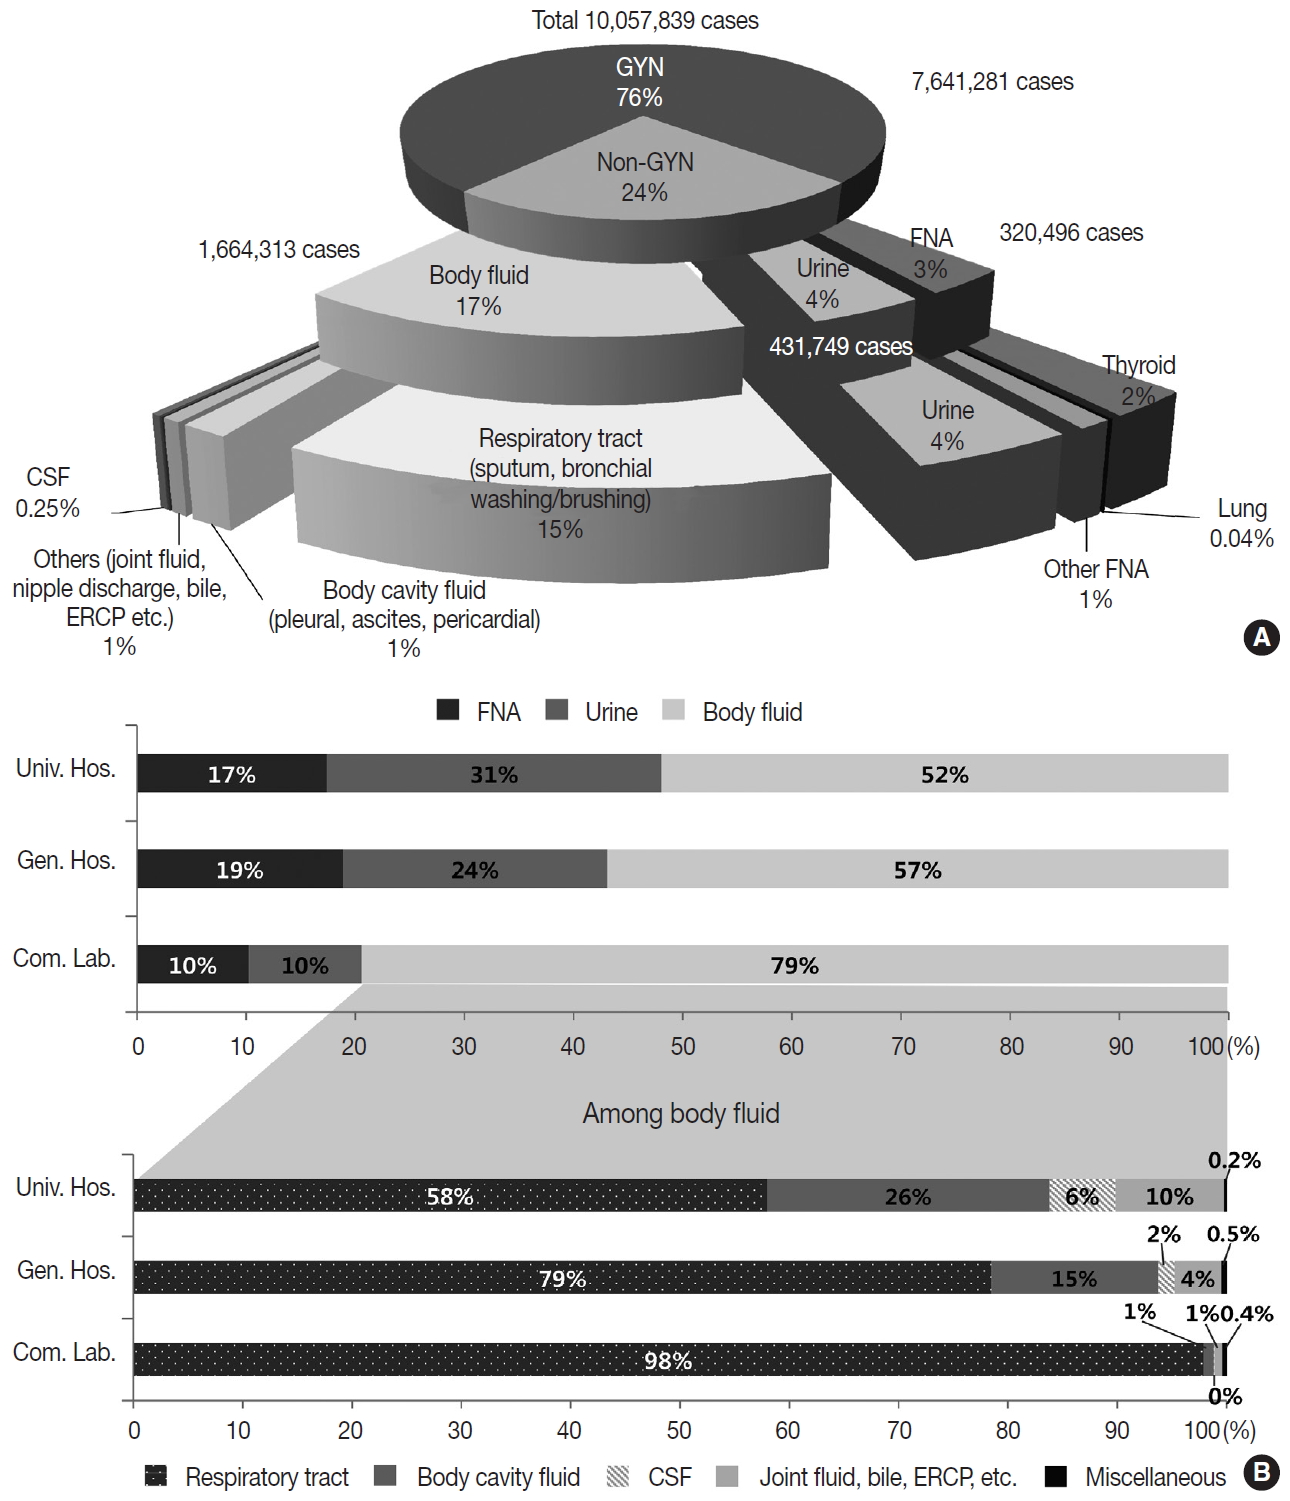
- In 2018, the total number of GYN samples was 7,641,281 (76.0%), and the total number of non-GYN samples was 2,416,558 (24.0%). The percentage of non-GYN samples gradually increased from 14% in 2007 to 24.0% in 2018. The majority (approximately 80.9%) of the GYN samples were analyzed in commercial laboratories (n = 6,181,796), while only 6.7% and 12.5% were processed by general and university hospitals, respectively. The proportion of GYN samples analyzed by commercial laboratories significantly increased from 58.0% in 2004 and 74.2% in 2015 to 80.9% in 2018; however, from 2015 to 2018, this number was similar in university hospitals (13.8% and 12.5%) and significantly decreased in general hospitals (11.1% to 6.7%). The proportion of non-GYN samples was highest in university hospitals (44%), followed by general hospitals (31%) and commercial laboratories (19%).
- The primary types of non-GYN samples were body fluids (n = 1,664,313, 68.9%), followed by urine (n = 431,749, 17.9%) and FNA (n = 320,496, 13.3%). The majority of the body fluids were obtained from the respiratory system (e.g., sputum, bronchial washing, or bronchial brushing, n = 1,508,676, 90.6%) (Fig. 2A). Most of the FNA samples were taken from the thyroid (n = 225,511, 70.4%). The FNA and urine samples were more common in the university (17.4% and 30.6%, respectively) and general hospitals (18.9% and 24.2%, respectively), while body fluids from the respiratory tract comprised the majority of the commercial laboratory samples (79.4%) (Fig. 2B).
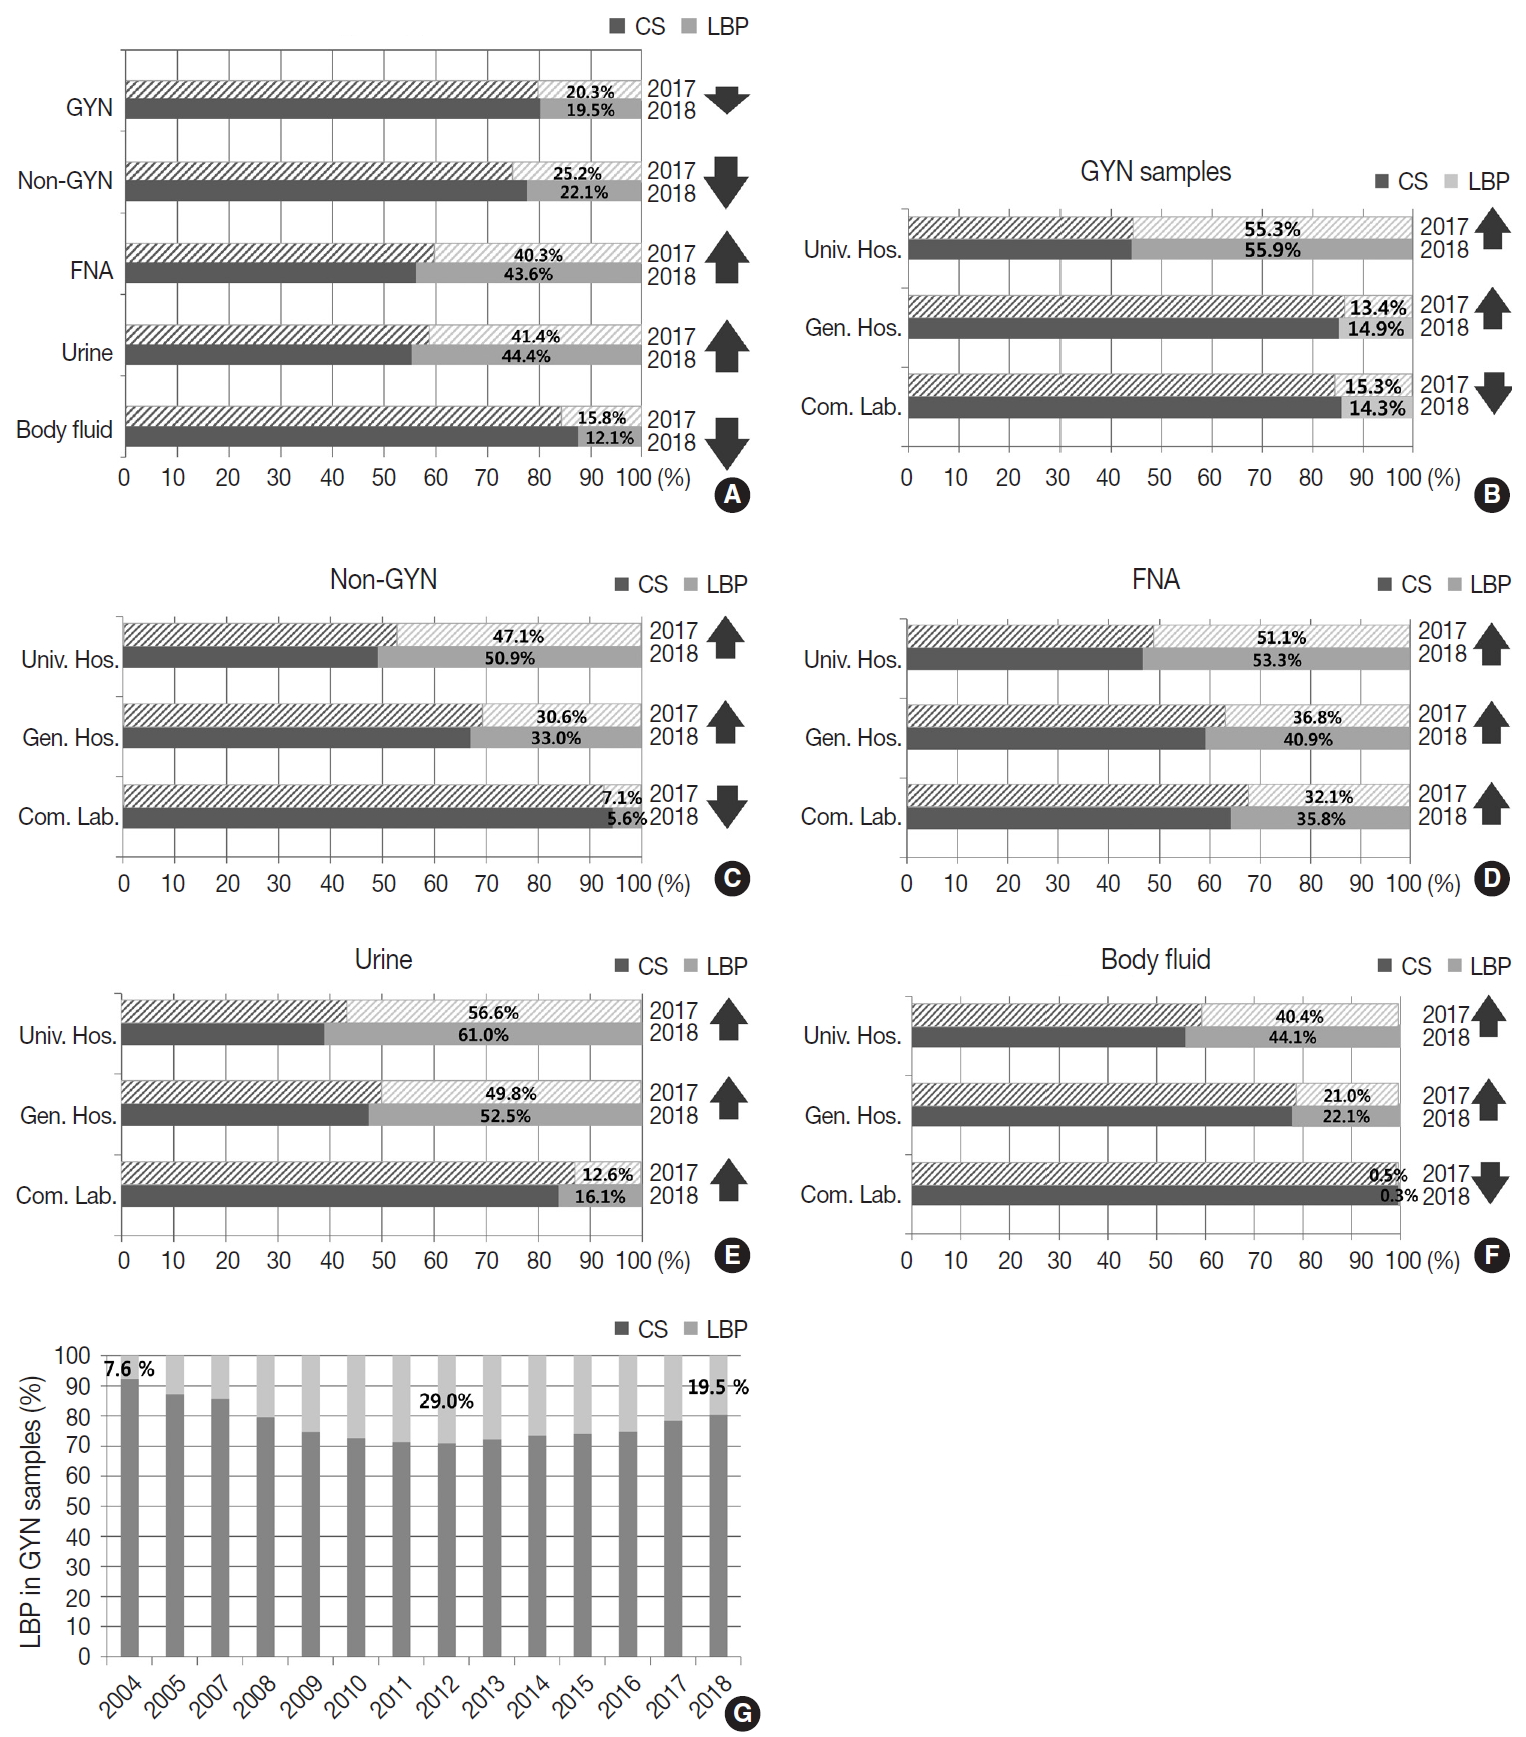
- Conventional and LBP cytology
- Of all the samples, 8,030,418 (79.8%) samples were prepared by conventional smear, and 2,027,421 (20.2%) samples were prepared by LBP. The LBP method was used in 19.5% of the GYN (n = 1,493,582) and 22.1% of the non-GYN samples (n = 533,839), including 44.4% of the urine (n = 191,769), 43.6% of the FNA (n = 139,599), and 12.1% of the body fluid (n = 202,471) samples (Fig. 3A). The LBP coverage of the GYN samples slightly decreased from 2017 to 2018 (20.3% to 19.5%). The LBP coverage of the non-GYN samples also decreased from 2017 to 2018 (25.2% to 22.1%), although the coverage was significantly increased in the FNA and urine subsets among the non-GYN samples. This indirectly suggests that from 2017 to 2018 a relatively high increase of GYN and body fluid samples were prepared by conventional methods (Fig. 3A). The LBP coverage of the GYN samples increased from 2017 to 2018 in both university and general hospitals, while it decreased in commercial laboratories (Fig. 3B). This pattern was similar in the non-GYN samples; the LBP coverage decreased only in commercial laboratories in 2018 (Fig. 3C). Among the subsets of the non-GYN samples, the LBP coverage generally increased in the FNA and urine samples of all institutions, while it only decreased in the body fluid samples of the commercial laboratories. (Fig. 3D–F). Chronologically, the LBP coverage in the GYN samples increased from 7.6% in 2004, reached a peak of 29.0% in 2012, and decreased slightly to 19.5% in 2018 (Fig. 3G).
- Distribution of the GYN sample cytologic diagnoses
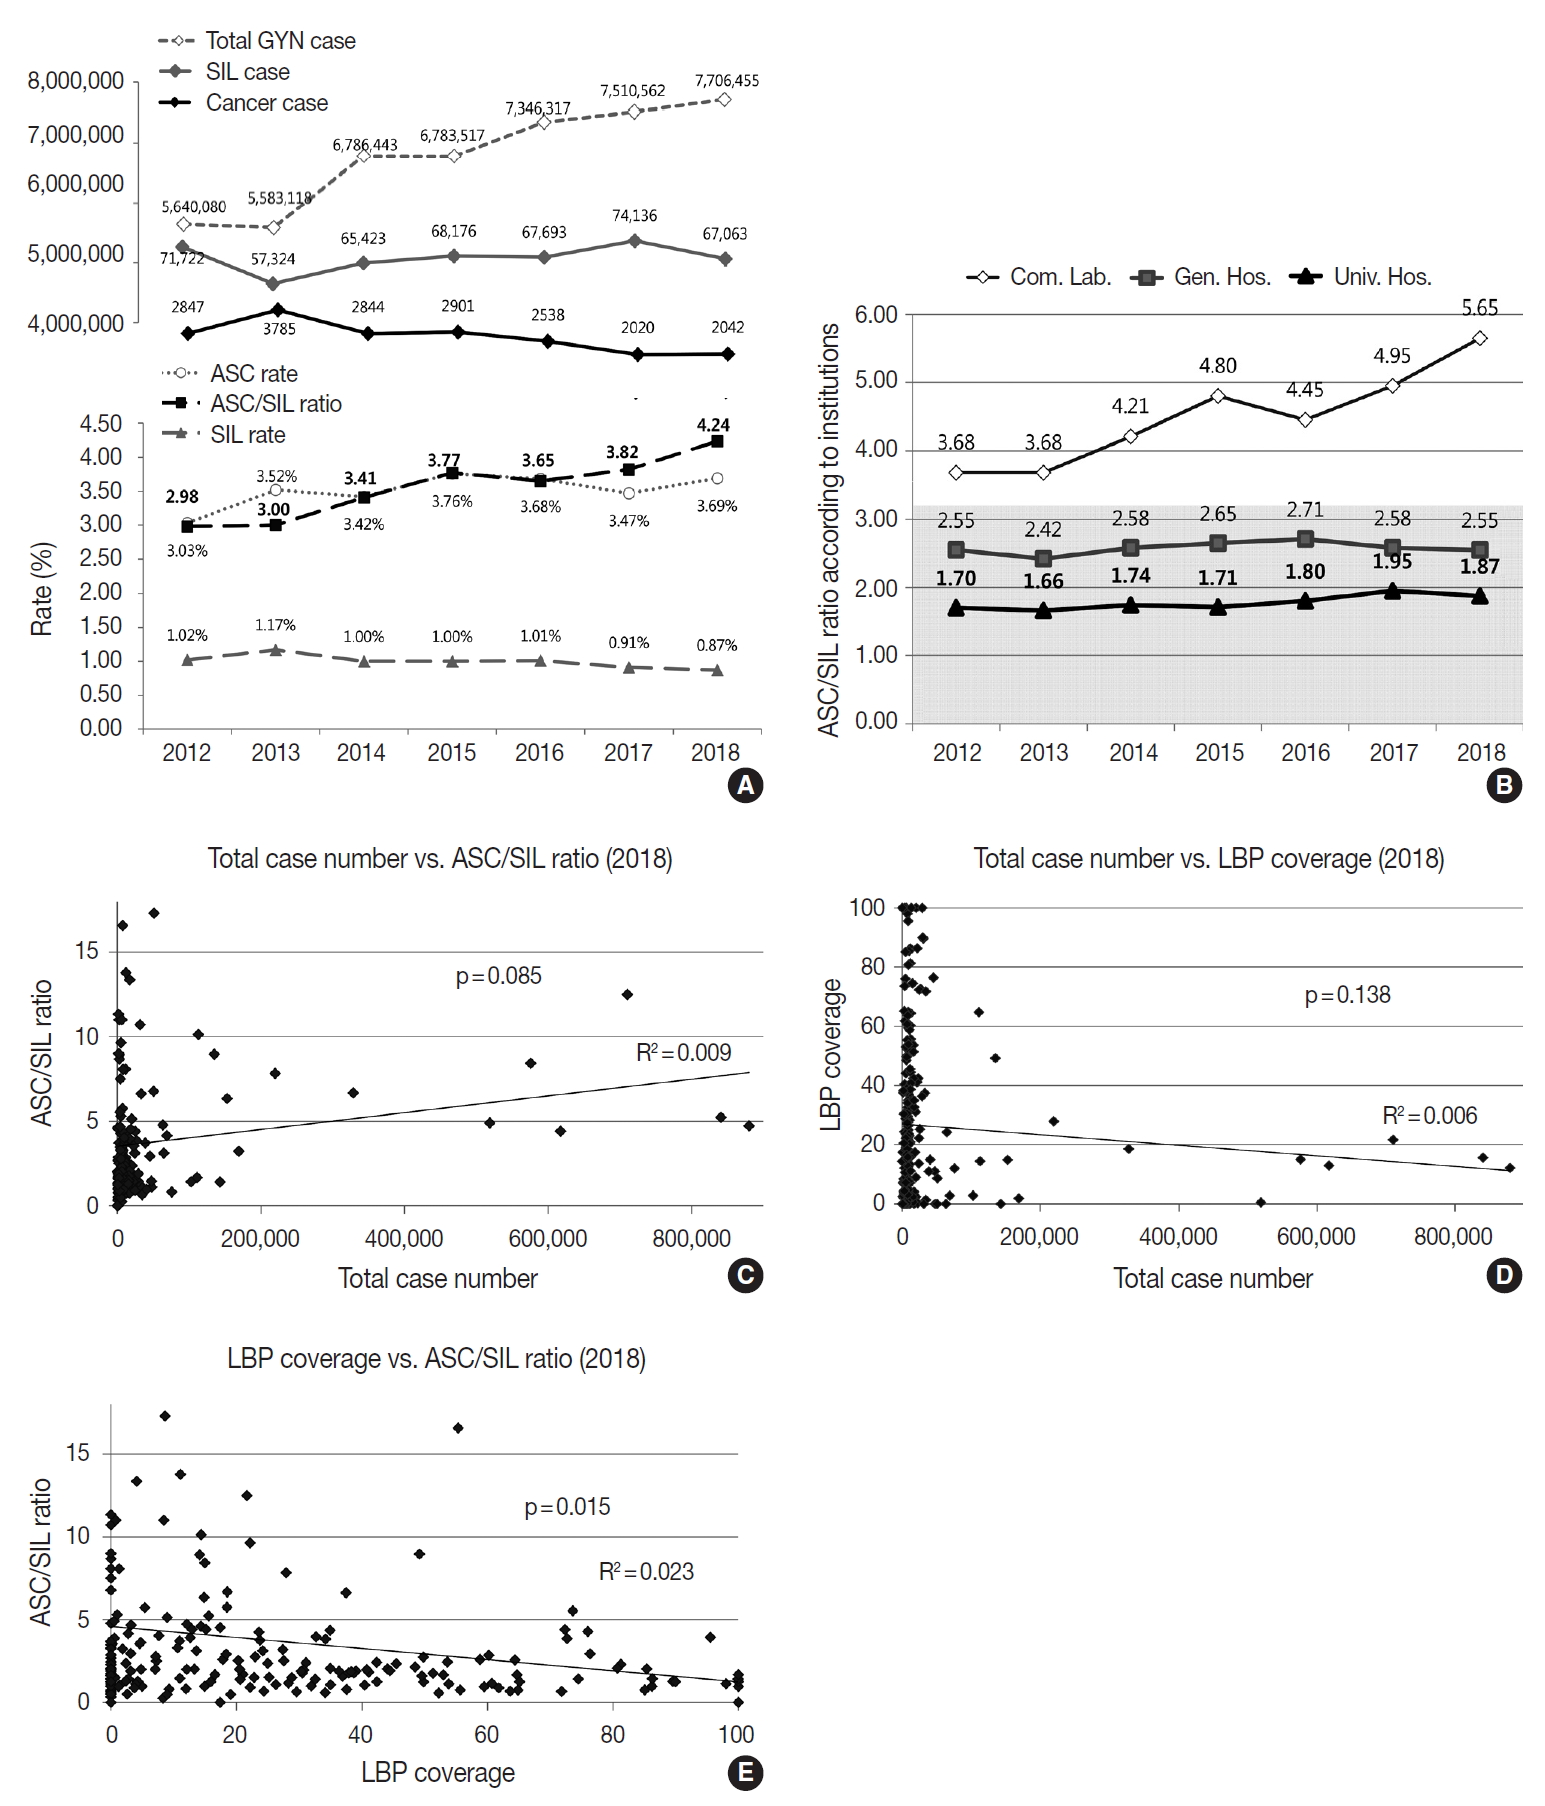
- The cytologic diagnoses percentages of the GYN samples are summarized in Table 5. The percentage of the samples with “unsatisfactory adequacy” was 0.14% in 2018. The overall percentage of the “negative” samples was 95.29%. The percentage of “atypical squamous cells of undetermined significance” (ASC-US) and “atypical squamous cells-cannot exclude highgrade squamous intraepithelial lesion” were 3.45% and 0.19%, respectively. The percentage of “low-grade squamous intraepithelial lesion” and “high-grade squamous intraepithelial lesion” were 0.65% and 0.19%, respectively. The ratio of ASC-US to squamous intraepithelial lesion (SIL) was 4.25 in 2018. Compared to 2017, the percentage of ASC-US increased from 3.47% to 3.69%, and the percentage of SIL decreased from 0.91% to 0.87%.
- Although the total number of GYN samples increased significantly from 5,640,080 in 2012 to 7,706,455 in 2018 as the coverage of the National Cancer Screening Program increased, the total number of SIL and cancer slightly decreased from 71,722 in 2012 to 67,063 in 2018 and 2,847 in 2012 to 2,042 in 2018, respectively (Fig. 4A). In contrast, the atypical squamous cell (ASC) percentage increased slightly from 3.03% in 2012 to 3.69% in 2018. As a result, the ASC/SIL ratio increased from 2.98 in 2012 to 4.24 in 2018. With regard to institutions, the ASC/SIL ratio was steadily maintained at approximately 1.8 in university hospitals and 2.5 in general hospitals; however, it has continuously increased in commercial laboratories from 3.68 in 2012 to 5.65 in 2018 (Fig. 4B). A correlation analysis using the data from all 211 institutions showed that the laboratories with more cases tended to use less LBP and report a higher ASC/SIL ratio, although these findings were not statistically significant (Fig. 4C, D). Moreover, the laboratories that used more LBP tended to report significantly lower ASC/SIL ratios (Fig. 4E).
- CHCR for the GYN cytology
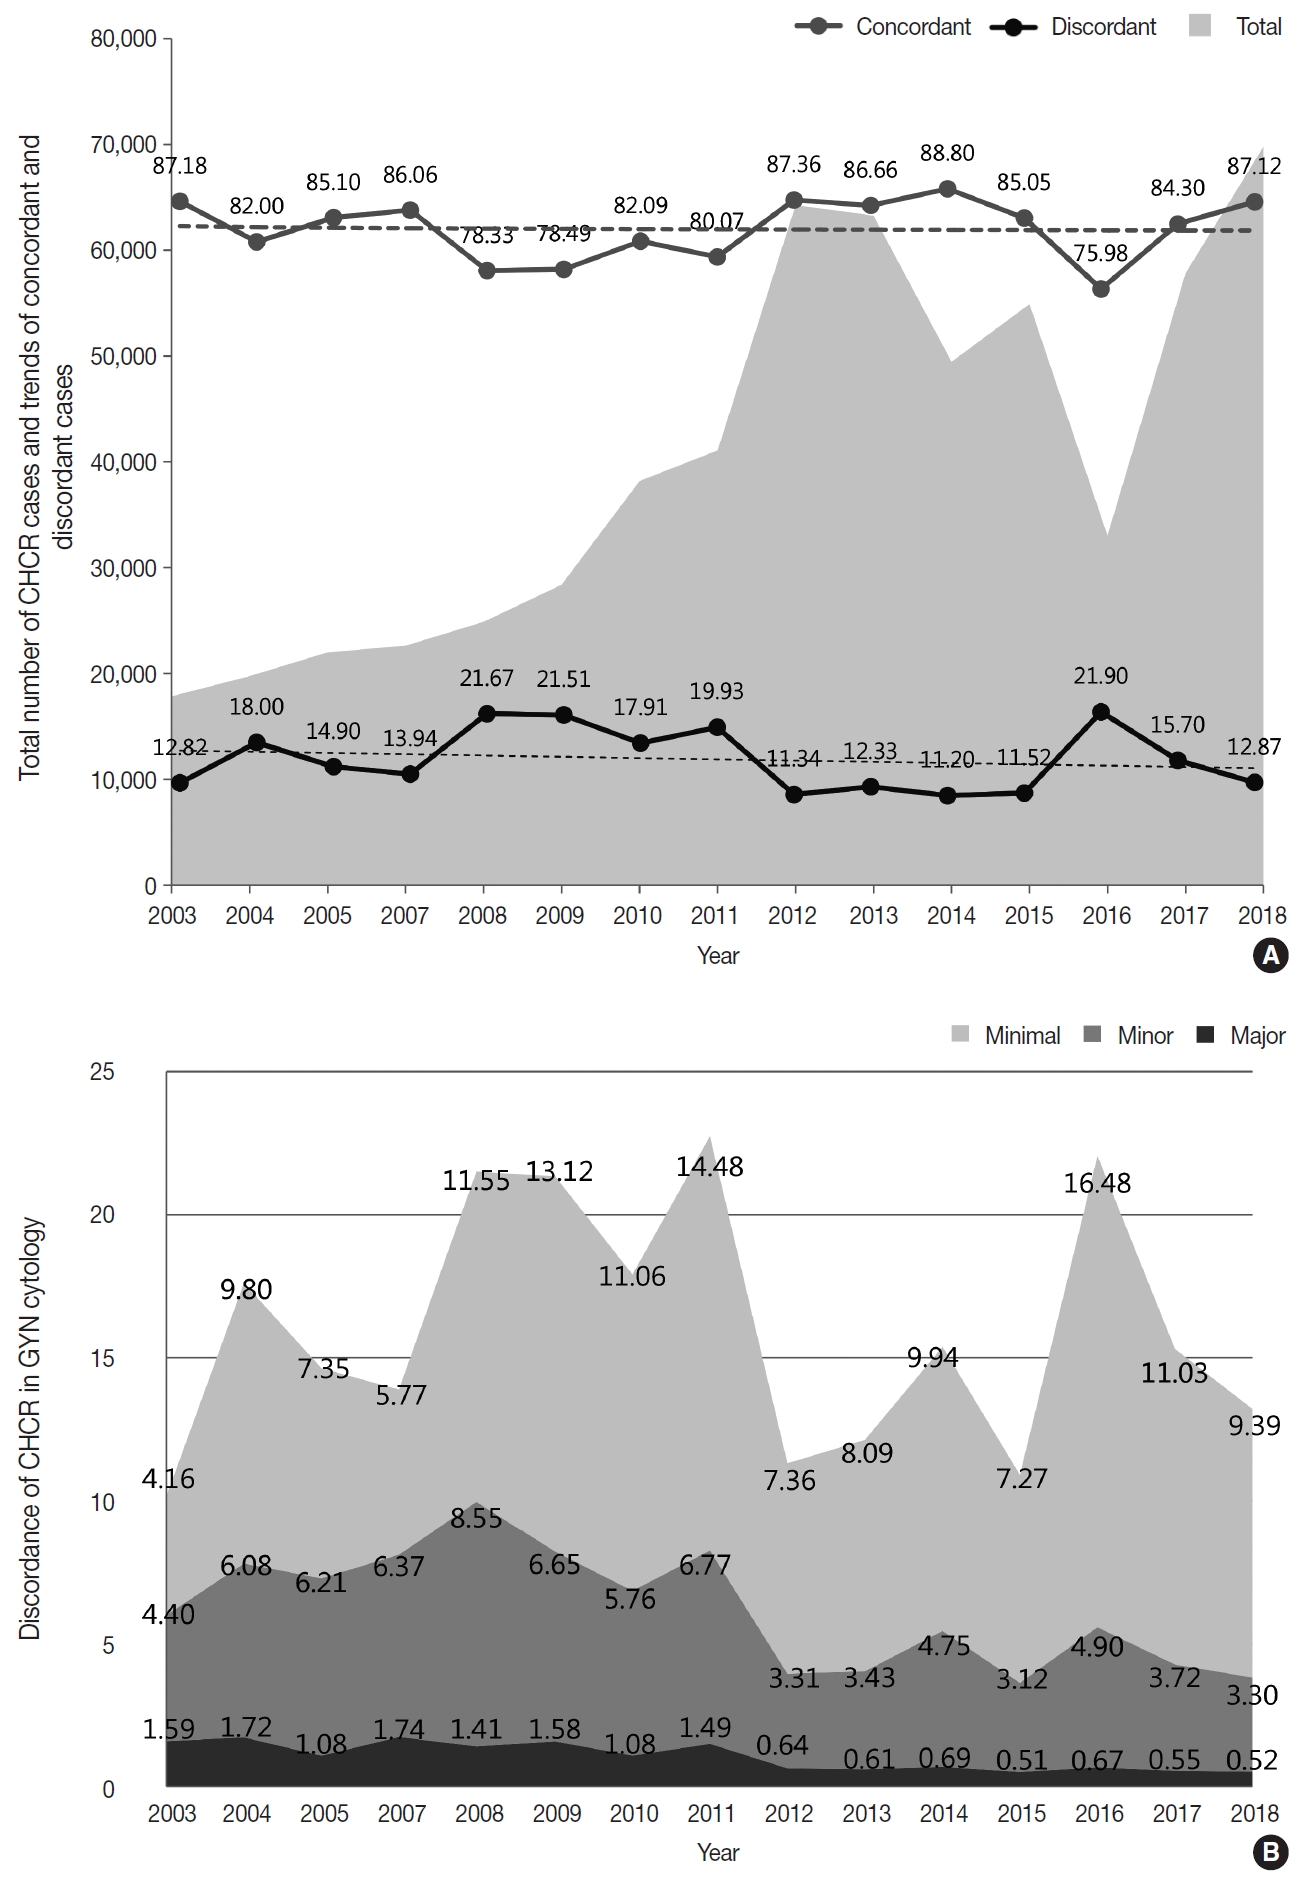
- As part of the internal quality control (QC) program, each institution was asked to compare the diagnoses of the cytologic and histologic samples of the same individual whenever possible and to document the degree of discordance between the cytologic and histologic diagnoses according to the institutional criteria. Of 69,808 cases, 60,823 cases showed concordant results between the cytologic and histologic diagnoses (87.1%) (Fig. 5A). Discordance with minimal and minor clinical impact (categories A and B) were found in 6,555 and 2,301 cases, respectively (9.4% and 3.3%) (Fig. 5B). Discordance with major clinical impact (category C) was found in 361 cases (0.52%) (Fig. 5B). Over the past 15 years, while an increasing number of cases have been compared, the discordant rate has been steadily maintained at approximately 15% (Fig. 5A). However, the rates of discordance with minor and major clinical impact (categories B and C) have markedly decreased from 4.40% and 1.5% in 2003 to 3.30% and 0.52% in 2018, respectively (Fig. 5B).
- Adequacy of GYN samples
- The percentage of the GYN samples with unsatisfactory adequacy in each institution was collected as a part of the annual survey. The overall unsatisfactory rate was 0.14% in 2018 and 0.24% in 2017. It was 0.45% in university hospitals, 0.44% in general hospitals, and 0.07% in commercial laboratories in 2018.
- Proficiency test
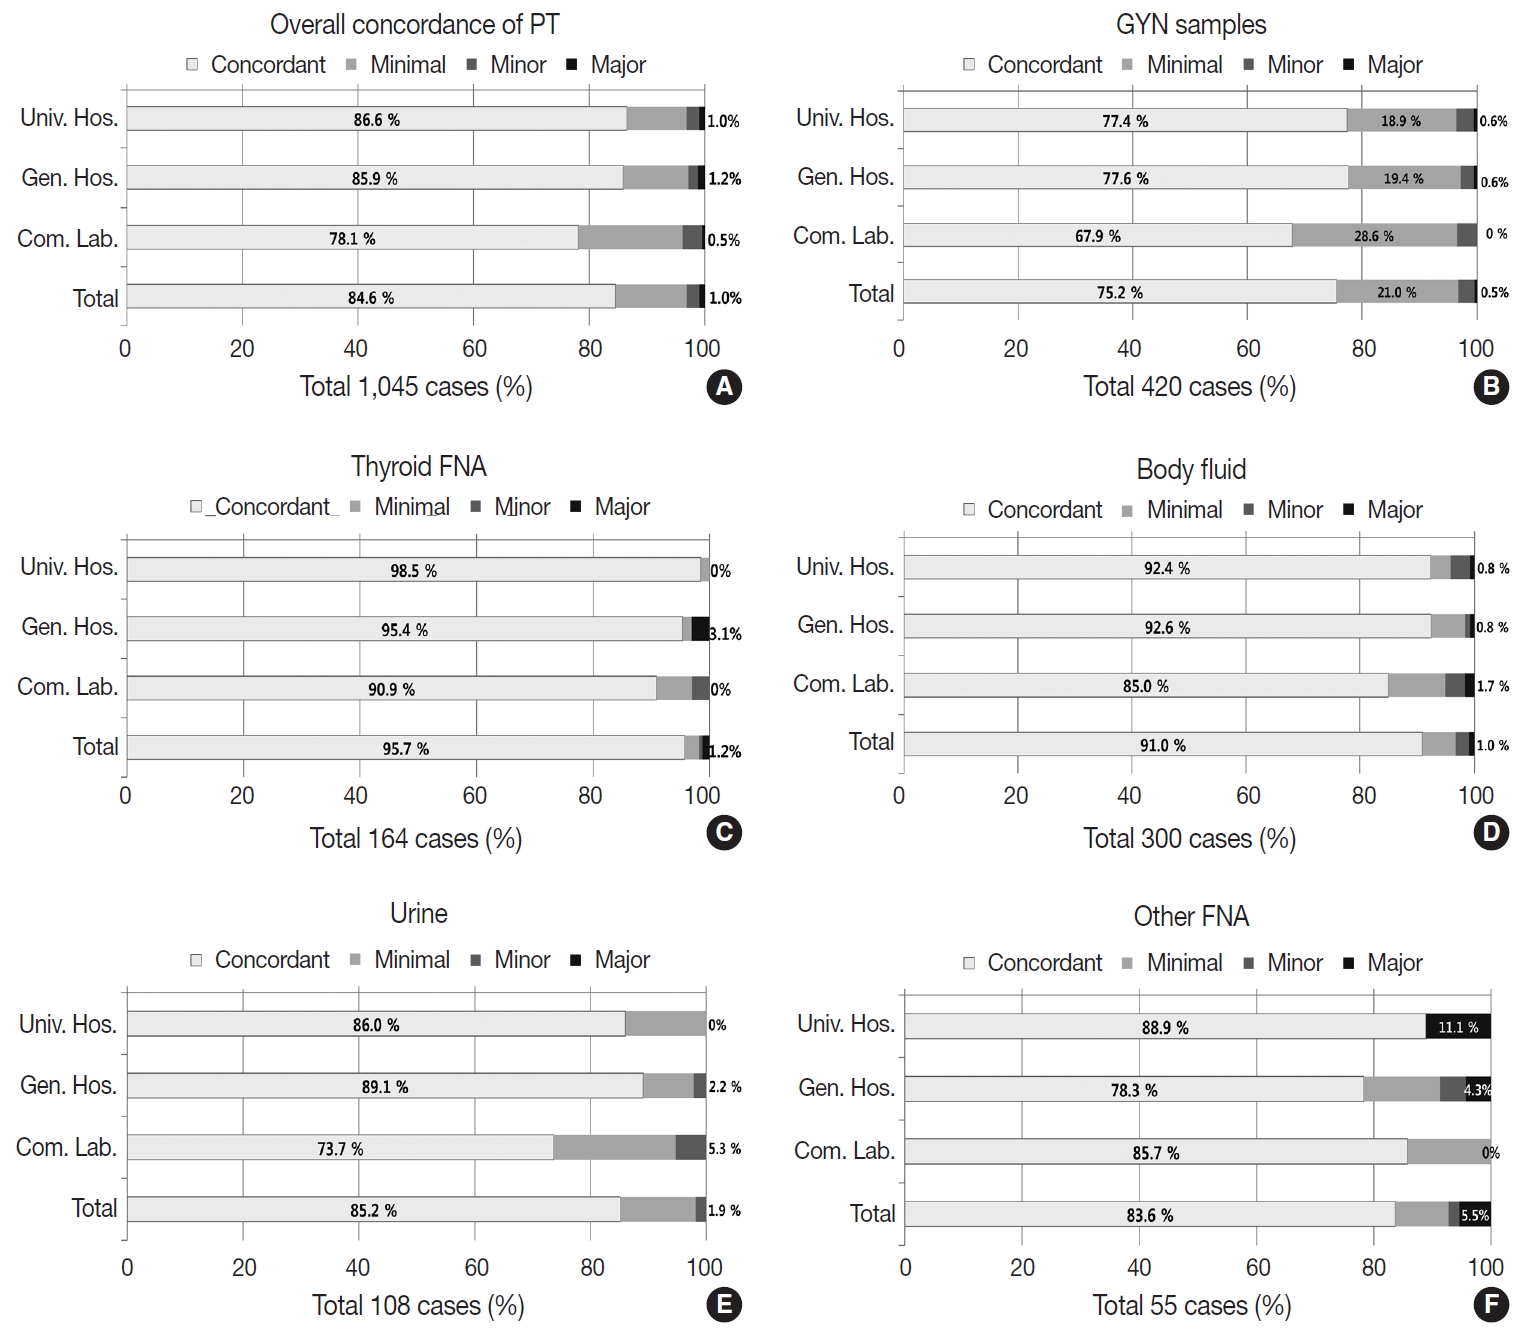
- The PT using 1,045 dispatched glass slides showed 84.6% overall concordance (category O), 12.2% discordance with minimal clinical impact (category A), 2.2% discordance with minor clinical impact (category B), and 0.95% discordance with major clinical impact (category C) (Fig. 6A). The concordance rates reported by the institutions were 86.6% in university hospitals, 85.9% in general hospitals, and 78.1% in commercial laboratories; discordance with major clinical impact (category C) was 1.0% in university hospitals, 1.2% in general hospitals, and 0.5% in commercial laboratories (Fig. 6A). Of the 420 GYN cytology cases, the overall concordance rate was 75.2%, minimal discordance (category A) was 21.0%, minor discordance (category B) was 2.8%, and major discordance (category C) was 0.5% (Fig. 6B). Concordance reported by the institutions was 77.4%, 77.6%, and 67.9% in university hospitals, general hospitals, and commercial laboratories, respectively. Major discordance (category C) was 0.6%, 0.6%, and 0.0% in the university hospitals, general hospitals, and commercial laboratories, respectively (Fig. 6B). Of the 164 thyroid FNA cases, the overall concordance was 95.7%, and the major discordance was 1.2% (Fig. 6C). The concordance rates by institution were similar in the university hospitals (98.5%), general hospitals (95.4%), and commercial laboratories (90.9%). Major discordance was found in only two cases (3.1%) in the general hospitals (Fig. 6C). Of the 300 body fluid cases, the overall concordance was 91.0% and the major discordance rate was 1.0% (Fig. 6D). The concordance rate was 92.4%, 92.6%, and 85.0% in the university hospitals, general hospitals, and commercial laboratories, respectively. Major discordance was found in one case in each institution (0.8%, 0.8%, and 1.7% in university hospitals, general hospitals, and commercial laboratories, respectively) (Fig. 6D). Of the 108 urine cytology cases, the overall concordance rate was 85.2%, and the major discordance rate was 1.9% (Fig. 6E). The concordance rate was 86.0%, 89.1%, and 73.7% in the university hospitals, general hospitals, and commercial laboratories, respectively. Major discordance was found in one case in the general hospitals and in the commercial laboratories (2.2% and 5.3%, respectively) (Fig. 6E). Among 55 other FNA cases, the overall concordance rate was 83.6%, and the major discordance rate was 5.5% (Fig. 6F). The concordance rate was 88.9%, 78.3%, and 85.7% in the university hospitals, general hospitals, and commercial laboratories, respectively. Major discordance was found in two cases and one case in the university and general hospitals, respectively (11.1% and 4.3%, respectively) (Fig. 6F).
- Sample adequacy assessment
- A total of 193 participating institutions submitted a total of 965 GYN slides of consequent numbers (5 slides from each institution) and their reported adequacy. The sample adequacy assessments reevaluated by the members of the CQIKSC and the reported adequacy of the institutions in all cases were concordant.
- Submission of samples for the next QA program
- A total of 182 participating institutions submitted 961 glass slides with confirmed cytologic diagnoses and corresponding histologic diagnoses.
RESULTS
- The key findings of this study are summarized as follows: 1) the total number of cytopathologic exams is continuously increasing, and the proportion of non-GYN samples is gradually increasing over time; 2) the number of cytopathologic exams processed by commercial laboratories is increasing; 3) the LBP coverage is increasing in all samples except GYN and body fluid samples processed by commercial laboratories; 4) the total number of GYN exams is increasing, but the number of cancer cases is decreasing; 5) the ASC/SIL ratio is increasing (the ASC percentage is increasing while the SIL percentage is decreasing); 6) the high LBP coverage seems to be lowering the ASC/SIL ratio; 7) the major discordance rate found by the CHCR (internal QC assessment) is decreasing over time; 8) the unsatisfactory rate in GYN samples is well under control; 9) the average diagnosis concordance rate of the PT (external QC assessment) is approximately 85% with a major discordance (category C) rate of less than 1%; and 10) the concordance rate was highest in thyroid FNA, lower in urine and other FNA, and lowest in GYN cytology.
- The total number of cytopathologic exams has increased dramatically to over 10 million exams per year. It has more than tripled from the number of total exams in 2004 with a steady compounded annual growth rate of 7.2%. Furthermore, the growth has not slowed but rather reached a peak. In 2018, an annual average of 47,667 cases was processed by individual laboratories that processed only 19,000 cases in 2004. This seems to be primarily due to the introduction of screening cytologic exams in the National Cancer Screening Program [1,2,8]. The proportion of non-GYN samples has also been gradually increasing over time. This is probably because of an overall increase in cytologic exams (the subgroup proportions were not significantly different from the numbers in 2015).
- The number of cytopathologic exams processed by commercial laboratories has been increasing. The average number of cytologic exams reported by the institutions showed a bipolar distribution; they significantly increased in university hospitals (19,320 in 2015 to 20,429 in 2018) and commercial laboratories (158,814 in 2015 to 173,393 in 2018) but decreased in general hospitals (11,080 in 2015 to 8,724 in 2018). This finding suggests that university hospitals and commercial laboratories have a need for more manpower.
- LBP coverage has generally increased in all samples, especially thyroid FNA and urine samples based on the wide acceptance of the technology in these samples [9]. However, it decreased in the GYN and body fluid samples processed by the commercial laboratories. This seems to be primarily due to the increase in National Cancer Screening Program samples where LBP methods are not covered by insurance. Because the total number of cytologic exams is significantly increasing and cytopathology manpower is limited, expanding LBP coverage in the cancer screening program would be an effective strategy to manage increasing labor demands.
- Over the past few years, the total number of GYN exams has been increasing and the number of cancer cases has been decreasing. At the same time, the ASC/SIL ratio, an important QC parameter for GYN cytology exams [10], has been increasing (the ASC rate has been increasing while the SIL rate has been decreasing). This finding seems to be due to the expansion of the recipient age group of the National Cancer Screening Program. Since 2016, the National Cancer Screening Program has covered women over the age of 20 (previously, only women over the age of 30 were covered), and the number of negative or ASC cases has increased while the number of SIL or cancer cases proportionally decreased [8]. The ASC/SIL ratio was more significantly increased in commercial laboratories than in the other institutions (3.68 in 2012 to 5.65 in 2018), which explains the impact of the changes in the National Cancer Screening Program samples. Interestingly, in correlation analyses, the institutions with more samples tended to have less LBP coverage and to report higher ASC/SIL ratios, and high LBP coverage tended to significantly correlate with lower ASC/SIL ratios. As the registered cytotechnologists that perform cytology screening were estimated as 386 in 2017, the average number of GYN samples screened by a cytotechnologist is 19,796.1 cases per year, approximately 79.2 cases per working day, which indicates that cytology laboratories in Korea have a labor-intensive working environment.
- The major discordance (category C) rate in the CHCR of the GYN samples has been significantly decreasing over time to a level as low as 0.52%, and the unsatisfactory rate of GYN samples has been well controlled over time (0.14% in 2018). These findings show that the Continuous Quality Improvement program of KSC has gradually contributed to the improvement of cytopathologic exam quality in cytopathology laboratories in Korea over time.
- In the PT, the average diagnosis concordance rate was approximately 85%, and the major discordance (category C) rate was less than 1% (0.95%). The concordance rate was the highest in thyroid FNA (95.7%), followed by body fluids (91.0%), urine (85.2%), and other FNA (83.6%); it was the lowest in GYN cytology (75.2%). This finding seems to be due to the sample characteristics and the varying degrees of complexity of the diagnostic categories. In GYN cytology, the major discordance (category C) was less than 0.5%, while the minimal and minor discordance (categories A and B) composed almost one-fourth of the total samples (24.3%). This finding indirectly shows the complexity of the diagnostic category (Bethesda system [6]) of GYN cytology. In contrast, in thyroid FNA, the concordance rate was over 95%. This seems to stem from the monotonous composition of PT samples. The occurrence of the minor categories of thyroid FNA, such as medullary carcinoma, poorly differentiated, or undifferentiated carcinoma was relatively rare, and these categories were not properly included in the PT sample pools. A more balanced sample composition for the PT should be carefully designed in the future. In comparison with the prior results of PT in 2004 and 2007, the concordant rate slightly but gradually increased from 73.0% in 2004 and 74.5% in 2007 to 75.2% in 2018 [1]. The major discordant rate (category C) also gradually decreased from 2.8% in 2004 and 2.0% in 2007 to 0.5% in 2018 [1]. However, because the discordance assessment criteria for PT have been slightly modified by the CQIKSC during the period as clinical treatment guidelines have changed, it is recommended that this data should be interpreted with care.
- For the fourth part of the program, each participating institution has submitted candidate slide samples for the next PT program (182 institutions, 961 slides). However, there are several drawbacks to using these glass slides in the PT program. Not enough samples have been submitted every year. There is a possibility of sample loss or damage during packaging, handling, and storage, which can lead to the leakage of personal information. The level of diagnostic difficulty of each PT sample is variable, and the PT samples may be distributed disproportionately. The PT samples can easily become discolored over time during storage. Because of the aforementioned reasons, the introduction of a digital pathology system in the QC programs is being utilized in other programs such as United Kingdom National External Quality Assessment Site (UKNEQAS) and The Royal College of Pathologists of Australasia Quality Assurance Programs (RCPAQAP) [11,12]. In 2019, CQIKSC will also attempt to adopt the digital pathology system for the Continuous Quality Improvement programs with the collaboration of the Committee of Quality Assurance of the Korean Society of Pathologists. The efficacy of the digital pathology system in the Continuous Quality Improvement program will be assessed during its establishment.
- With the results of this study, we confirmed that the Continuous Quality Improvement programs using the annual survey and the internal (CHCR) and external QC tests (PT) in the KSC have contributed to improved cytopathology practice performance quality by enhancing diagnostic accuracy. However, the high ASC/SIL ratio in a few institutions should be further monitored as the National Cancer Screening Programs expand over time. Active intervention and QC surveillance of each institution must be continued.
DISCUSSION
Supplementary Materials
-
Ethics Statement
This study was reviewed and approved by the Institutional Review Board of The Catholic University of Korea, Yeouido St. Mary’s Hospital (SC19ZCDI0091) with a waiver of consent.
-
Author contributions
Conceptualization: YC, SWH, HKO.
Data curation: YC, HKO.
Investigation: YC, HKO.
Methodology: YC, HKO.
Project administration: YC, HJ, JSP, HKO.
Resources: YC, HJ, JSP, HKO.
Supervision: SWH, HKO.
Validation: YC, HKO.
Visualization: YC, HJ, JSP.
Writing—original draft: YC, HJ, JSP.
Writing—review & editing: YC, HJ, JSP, SWH, HKO.
-
Conflicts of Interest
Y.C., contributing editor and S.W.H., the senior editor of the Journal of Pathology and Translational Medicine, were not involved in the editorial evaluation or decision to publish this article. All remaining authors have declared no conflicts of interest.
-
Funding
No funding to declare.
Notes
Acknowledgments

| Original diagnosis |
Submitted diagnosis |
|||||
|---|---|---|---|---|---|---|
| Negative | ASC-US | ASC-H | L-SIL | H-SIL | Carcinoma | |
| Negative | O | A | B | A | B | C |
| ASC-US | A | O | A | O | A | B |
| ASC-H | B | A | O | A | O | B |
| L-SIL | A | A | A | O | A | B |
| H-SIL | B | B | A | A | O | A |
| Carcinoma | C | B | B | B | A | O |
ASC, atypical squamous cells; ASC-US, atypical squamous cells of uncertain significance; ASC-H, atypical squamous cells, cannot exclude H-SIL; AGC, atypical glandular cells; L-SIL, low-grade squamous intraepithelial lesion; H-SIL, high-grade squamous intraepithelial lesion; ASC/SIL ratio, atypical squamous cells/squamous intraepithelial lesion ratio.
- 1. Lee HK, Kim SN, Khang SK, Kang CS, Yoon HK. Quality control program and its results of Korean Society for Cytopathologists. Korean J Cytopathol 2008; 19: 65–71. Article
- 2. Kim Y, Jun JK, Choi KS, Lee HY, Park EC. Overview of the National Cancer screening programme and the cancer screening status in Korea. Asian Pac J Cancer Prev 2011; 12: 725–30. PubMed
- 3. Suh M, Song S, Cho HN, et al. Trends in participation rates for the national cancer screening program in Korea, 2002-2012. Cancer Res Treat 2017; 49: 798–806. ArticlePubMedPDF
- 4. Oh EJ, Jung CK, Kim DH, et al. Current Cytology Practices in Korea: A nationwide survey by the Korean Society for Cytopathology. J Pathol Transl Med 2017; 51: 579–87. ArticlePubMedPMCPDF
- 5. Jung M. National Cancer Screening Programs and evidence-based healthcare policy in South Korea. Health Policy 2015; 119: 26–32. ArticlePubMed
- 6. Nayar R, Wilbur DC. The Bethesda system for reporting cervical cytology: definitions, criteria, and explanatory notes. 3rd ed. Cham: Springer, 2015.
- 7. Cibas ES, Ali SZ. The 2017 Bethesda System for Reporting Thyroid Cytopathology. Thyroid 2017; 27: 1341–6. ArticlePubMed
- 8. Lim SC, Yoo CW. Current status of and perspectives on cervical cancer screening in Korea. J Pathol Transl Med 2019; 53: 210–6. ArticlePubMedPMCPDF
- 9. Chong Y, Ji SJ, Kang CS, Lee EJ. Can liquid-based preparation substitute for conventional smear in thyroid fine-needle aspiration? A systematic review based on meta-analysis. Endocr Connect 2017; 6: 817–29. ArticlePubMedPMC
- 10. Nascimento AF, Cibas ES. The ASC/SIL ratio for cytopathologists as a quality control measure: a follow-up study. Am J Clin Pathol 2007; 128: 653–6. ArticlePubMedPDF
- 11. Hodgson C, Cross P. Introduction and development of a digital diagnostic non gynaecological diagnostic cytology interpretative scheme. Cytopathology 2018; 29(Suppl 1):79.
- 12. Greaves J, Holzhauser D. Virtual cytopathology in an Austrailian EQA setting. 20th International Congress of Cytology; 2019 May 5-10; Sydney, Australia.
References
Figure & Data
References
Citations
- Diagnostic proficiency test using digital cytopathology and comparative assessment of whole slide images of cytologic samples for quality assurance program in Korea
Yosep Chong, Soon Auck Hong, Hoon Kyu Oh, Soo Jin Jung, Bo-Sung Kim, Ji Yun Jeong, Ho-Chang Lee, Gyungyub Gong
Journal of Pathology and Translational Medicine.2023; 57(5): 251. CrossRef - Recent Application of Artificial Intelligence in Non-Gynecological Cancer Cytopathology: A Systematic Review
Nishant Thakur, Mohammad Rizwan Alam, Jamshid Abdul-Ghafar, Yosep Chong
Cancers.2022; 14(14): 3529. CrossRef - Re-Increasing Trends in Thyroid Cancer Incidence after a Short Period of Decrease in Korea: Reigniting the Debate on Ultrasound Screening
Chan Kwon Jung, Ja Seong Bae, Young Joo Park
Endocrinology and Metabolism.2022; 37(5): 816. CrossRef - Current status of cytopathology practice in Korea: impact of the coronavirus pandemic on cytopathology practice
Soon Auck Hong, Haeyoen Jung, Sung Sun Kim, Min-Sun Jin, Jung-Soo Pyo, Ji Yun Jeong, Younghee Choi, Gyungyub Gong, Yosep Chong
Journal of Pathology and Translational Medicine.2022; 56(6): 361. CrossRef
 PubReader
 ePub Link
-
 Cite this Article
- Cite this Article
-
- Close
- Download Citation
- Close
- Figure
-