 E-submission
Articles
- Page Path
- HOME > J Pathol Transl Med > Volume 54(2); 2020 > Article
-
Original Article
Programmed death-ligand 1 expression and its correlation with clinicopathological parameters in gallbladder cancer -
Ji Hye Kim1
 , Kyungbin Kim1, Misung Kim1, Young Min Kim1,2, Jae Hee Suh1,2, Hee Jeong Cha1,2, Hye Jeong Choi,1,2
 -
Journal of Pathology and Translational Medicine 2020;54(2):154-164.
DOI: https://doi.org/10.4132/jptm.2019.11.13
Published online: February 10, 2020
1Department of Pathology, Ulsan University Hospital, Ulsan, Korea
2University of Ulsan College of Medicine, Ulsan, Korea
- Corresponding Author: Hye Jeong Choi, MD, PhD, Department of Pathology, Ulsan University Hospital, University of Ulsan College of Medicine, 877 Bangeojinsunwhando-ro, Dong-gu, Ulsan 05505, Korea Tel: +82-52-250-7264, Fax: +82-52-252-3024, E-mail: 'thanksg@uuh.ulsan.kr'
© 2020 The Korean Society of Pathologists/The Korean Society for Cytopathology
This is an Open Access article distributed under the terms of the Creative Commons Attribution Non-Commercial License (http://creativecommons.org/licenses/by-nc/4.0) which permits unrestricted non-commercial use, distribution, and reproduction in any medium, provided the original work is properly cited.
Abstract
-
Background
- Immunomodulatory therapies targeting the interaction between programmed cell death protein 1 and programmed death-ligand 1 (PD-L1) have become increasingly important in anticancer treatment. Previous research on the subject of this immune response has established an association with tumor aggressiveness and a poor prognosis in certain cancers. Currently, scant information is available on the relationship between PD-L1 expression and gallbladder cancer (GBC).
-
Methods
- We investigated the expression of PD-L1 in 101 primary GBC cases to determine the potential association with prognostic impact. PD-L1 expression was immunohistochemically assessed using a single PD-L1 antibody (clone SP263). Correlations with clinicopathological parameters, overall survival (OS), or progression- free survival (PFS) were analyzed.
-
Results
- PD-L1 expression in tumor cells at cutoff levels of 1%, 10%, and 50% was present in 18.8%, 13.8%, and 7.9% of cases. Our study showed that positive PD-L1 expression at any cutoff was significantly correlated with poorly differentiated histologic grade and the presence of lymphovascular invasion (p < .05). PD-L1 expression at cutoff levels of 10% and 50% was significantly positive in patients with perineural invasion, higher T categories, and higher pathologic stages (p < .05). Additionally, there was a significant association noted between PD-L1 expression at a cutoff level of 50% and worse OS or PFS (p = .049 for OS, p = .028 for PFS). Other poor prognostic factors included histologic grade, T category, N category, pathologic stage, lymphovascular invasion, perineural invasion, growth pattern, and margin of resection (p < .05).
-
Conclusions
- The expression of PD-L1 in GBC varies according to cutoff level but is valuably associated with poor prognostic parameters and survival. Our study indicates that the overexpression of PD-L1 in GBC had a negative prognostic impact.
- Specimens and patient selection
- Formalin-fixed, paraffin-embedded (FFPE) primary GBC tissues were derived from 101 patients at Ulsan University Hospital (UUH) between January 2013 and December 2018. Clinical data were recorded from the UUH electronic medical records, including age, sex, size, location, risk factors (e.g., gallstone, cholecystitis, diabetes mellitus, hypertension), margin of tumor resection, histologic grade, TNM stage, lymph node involvement, lymphovascular invasion or perineural invasion by tumor, adjuvant chemotherapy, and follow-up time in months. Follow-up was completed on April 8, 2019. Overall survival (OS) was the interval either between the initial diagnosis and death or between the initial diagnosis and the last observation among surviving patients, respectively. Progression-free survival (PFS) was the interval between the initial diagnosis and progressive changes in the typical imaging appearance on computed tomography and/or magnetic resonance imaging. No patient underwent chemotherapy before surgery. The pathologic diagnosis was confirmed according to the eighth edition of the American Joint Committee on Cancer staging system [15] and the World Health Organization classification systems.
- Automated immunohistochemistry
- A representative paraffin block from each specimen was chosen for immunohistochemical analysis. We immunohistochemically analyzed PD-L1 expression on 3- to 5-μm tissue sections of FFPE specimens. The primary PD-L1 antibody (rabbit monoclonal antibody clone SP263; Roche Holding AG, Basel, Switzerland) was used in all cases in a concentration of approximately 1.61 μg/mL. A negative control for all cases was also developed using the same antibody to control for potential false-positive staining. Placental tissues served as positive controls. Immunohistochemistry assays were performed on a VENTANA BenchMark ULTRA instrument (Roche Holding AG) according to the manufacturer’s instructions.
- Evaluation of immunohistochemistry
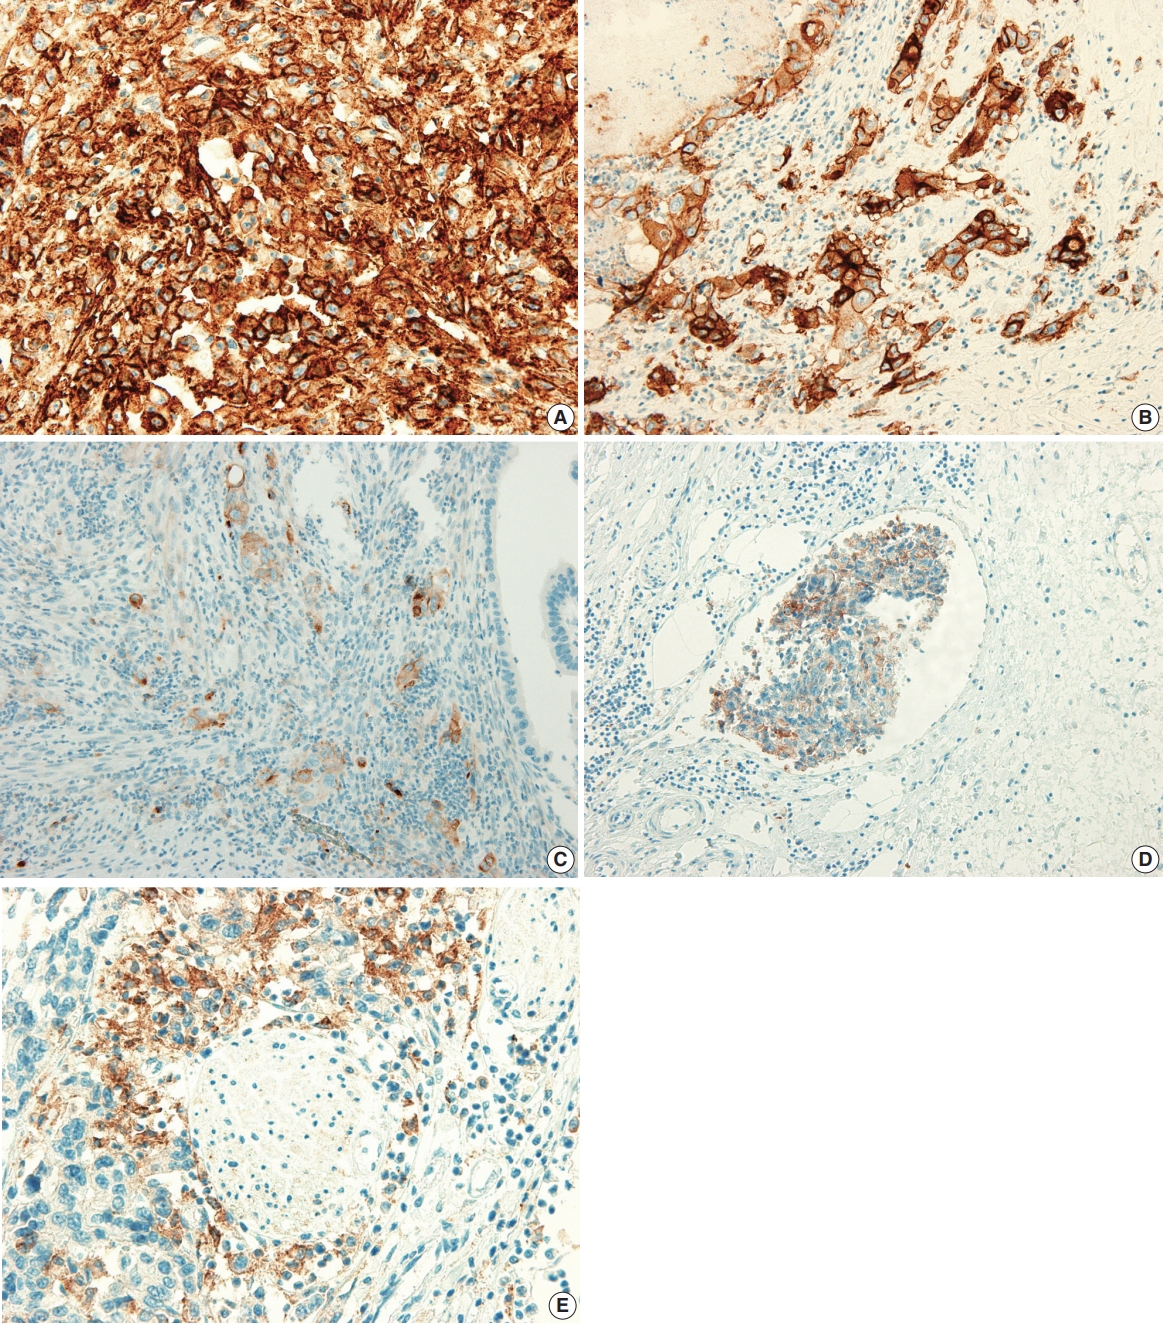
- The PD-L1 expression proportion score was assessed as the percentage of positive membranous expression on tumor cells, whereas cytoplasmic expression was regarded as negative. Tumor cells with any membranous staining intensity were judged to be positive. Various PD-L1 antibodies and cutoff levels were used in different studies. We assessed PD-L1 expression using the cutoff levels of 1%, 10%, and 50% (Fig. 1).
- Statistical analysis
- SPSS ver. 24.0 (IBM Corp., Armonk, NY, USA) was used to conduct statistical analyses. To determine the association between two or more variables and PD-L1 expression, Pearson’s chi-square test or Fisher exact test where appropriate were applied, with statistical significance at p < .05. The univariable analysis of OS and PFS was completed using the Kaplan-Meier method and log-rank test.
- Ethics statement
- This study was approved by the institutional review board (IRB) of UUH, who granted a waiver of the need for informed consent (IRB No. 2019-08-017). This study was performed in accordance with the principles of the Declaration of Helsinki.
MATERIALS AND METHODS
- Clinicopathological characteristics
- The study group included 101 primary GBC cases, with a female predominance (56.4%). The mean age of the included patients was 68.0 years (range, 40 to 90 years) and 97 patients (96.0%) were aged older than 45 years. Fifty-two patients (51.5%) were diagnosed via simple cholecystectomy specimens and 10 of these underwent further surgery after diagnosis. Risk factors included gallstone (28.7%), cholecystitis (91.0%), hypertension (28.7%), and diabetes (32.7%). The majority of cases showed adenocarcinoma not otherwise specified (n = 82, 81.2%), and the most common type was well-differentiated (n = 45, 44.6%). Although subtype-specific components accompanying adenocarcinoma were present, no cases were diagnosed as either undifferentiated carcinoma, squamous cell carcinoma, adenosquamous cell carcinoma, or neuroendocrine carcinoma. This cohort included mostly patients with early stages of disease; 84 patients (83.2%) presented with pT1 or pT2 category. Among 72 patients eligible for the evaluation of pathologic stage status, 37 (51.4%) presented with stage I or stage II disease. The clinicopathological characteristics of our GBC patients are shown in Table 1.
- Correlation of clinicopathological parameters with PD-L1 expression
- PD-L1 expression in tumor cells was observed in 19 patients (18.8%) with a cutoff level of 1%, 14 patients (13.8%) with a cutoff level of 10%, and eight patients (7.9%) with a cutoff level of 50%. The finding of any positive PD-L1 expression was significantly correlated with poorer and other differentiation (1% cutoff: p = .001; 10% cutoff: p < .001; 50% cutoff: p < .001) and the presence of lymphovascular invasion (1% cutoff, p = .015; 10% cutoff, p = .001; 50% cutoff, p = .005). Positive PD-L1 expression with cutoff levels of 10% and 50% was associated with the presence of perineural invasion (10% cutoff, p = .032; 50% cutoff, p = .023), higher T category (10% cutoff, p = .012; 50% cutoff, p = .026), and higher pathologic stage (10% cutoff, p = .045; 50% cutoff, p = .010). In addition, positive PD-L1 expression with 1% and 10% cutoff levels was correlated with larger tumor size (1% cutoff, p = .040; 10% cutoff, p = .007). No significant differences were observed with regard to sex; age; tumor location; margin of tumor resection; adjuvant chemotherapy; or primary risk factors for GBC such as gallstones, cholecystitis, diabetes, and hypertension. The associations between PD-L1 expression in tumor cells and clinicopathological characteristics of GBC patients are shown in Table 2.
- Survival analysis
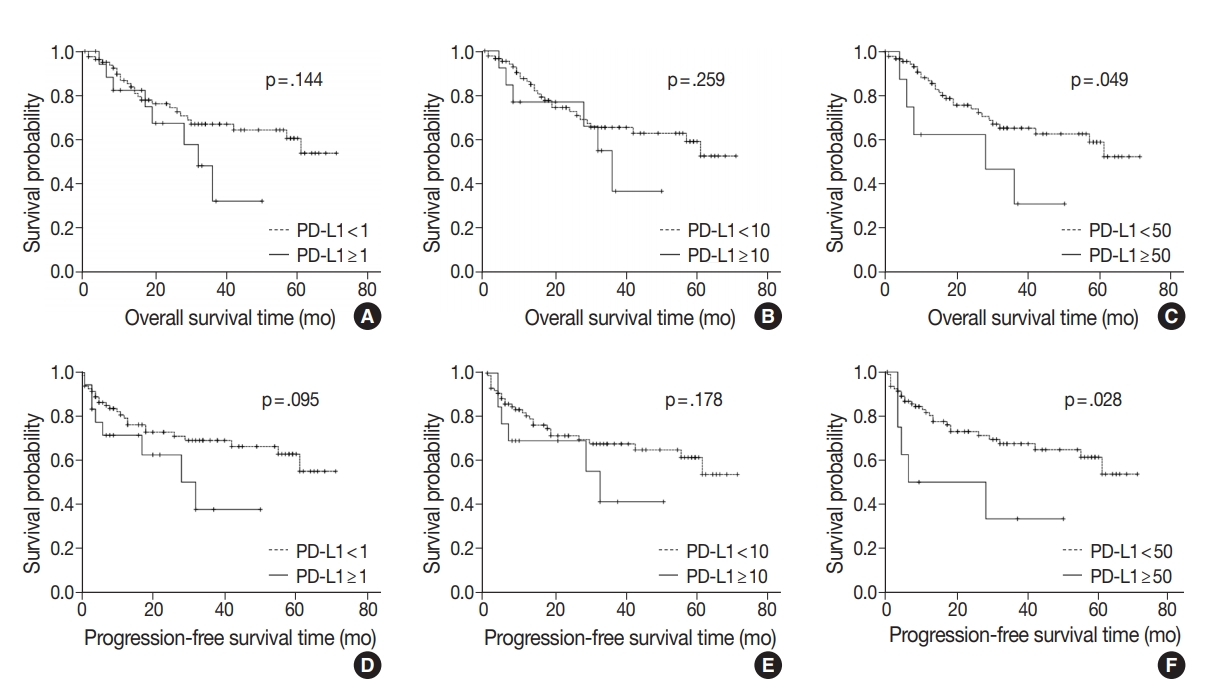
- At the time of analysis, the median OS was 14 months (range, 0 to 71 months). Thirty-three patients (32.6%) died during the follow-up period. Meanwhile, a total of 24 patients showed disease progression, and 19 of these patients died. Survival analysis using Kaplan-Meier analysis was performed to evaluate the prognostic impact of PD-L1 expression and other parameters. OS was significantly associated with histologic grade (p = .003), T category (p < .001), N category (p < .001), pathologic stage (p < .001), lymphovascular invasion (p < .001), perineural invasion (p < .001), growth pattern (p = .019), and resection margin (p = .006). Worse mean survival was observed in histologic grade progressing from well-differentiated to poorly differentiated, undifferentiated, or other. The patients with higher T categories, nodal metastasis, higher pathologic stages, presence of lymphovascular invasion, and presence of perineural invasion showed poorer OS, whereas those with a polypoid growth pattern and complete resection showed better OS. These parameters were more significantly associated with PFS. Significant differences in both OS and PFS according to PD-L1 expression were seen only at the 50% cutoff statistically (1% cutoff: p = .14; 10% cutoff: p =.259; 50% cutoff: p = .049 for OS and 1% cutoff: p = .095; 10% cutoff: p = .178; 50% cutoff: p = .028 for PFS) (Fig. 2). We observed a high expression of PD-L1 correlated with poor prognostic significance of both survival types, especially PFS. Old age (≥ 68 years) was correlated with poor OS and larger tumor size (≥ 2.7 cm) was correlated with poor PFS, respectively. No significant associations with sex, histologic type, adjuvant chemotherapy, gallstone status, cholecystitis, diabetes, or hypertension were evident. Correlations between OS or PFS and clinicopathological parameters are shown in Table 3.
RESULTS
- Immune checkpoint inhibitors targeting the PD-1–PD-L1 pathway have exhibited potent efficacy in some cancers such as triple-negative breast cancer, renal cell carcinoma, and non-small cell lung cancer [16-20]. Clinical benefits were strongly correlated with high PD-L1 expression and certain drugs have been approved for use in conjunction [20,21]. While PD-L1 expression significantly correlates with poor prognosis in gastric cancer, hepatocellular carcinoma, and esophageal cancer, both better and worse results have been observed in lung cancer, colorectal cancer, and melanoma [22]. PD-L1 expression has been suggested as an important prognostic factor, but few studies have evaluated the expression levels of PD-L1 in GBC patients and there are no consistent results regarding its value as a predictor.
- Various studies suggest that PD-L1 expression is associated with poor prognostic factors or survival in different tumor types. These studies observed that tumors with poor differentiation, vascular invasion, nodal metastasis, higher stage, adenocarcinoma histology, and lower survival rate were correlated with higher PD-L1 expression. Table 4 summarizes recent studies covering the prognostic value of PD-L1 [11,12,23-32].
- In patients with advanced cholangiocarcinoma or gallbladder adenocarcinoma, results from phase I KEYNOTE-028 and phase II KEYNOTE-158 research indicated that pembrolizumab, a humanized monoclonal antibody against PD-1, constitutes a possible treatment option regardless of PD-L1 expression [14]. The PD-L1 antibody (22C3) and a 1% cutoff level were used in these trials. Elsewhere, Ha et al. [33] found a high level of soluble PD-L1 in the serum represents a negative prognostic factor in advanced cholangiocarcinoma and GBC patients who received palliative chemotherapy. Recently, two other studies evaluated the predictive value of PD-L1 expression using immunohistochemistry in GBC tissues. Neyaz et al. [11] examined the relationship between PD-L1 expression in tumor cells and tumor-infiltrating lymphocytes (TILs) at cutoff levels of 1%, 10%, and 50% and clinicopathological characteristics or OS. Their study ultimately showed significant correlations existed in terms of histologic type, histologic grade, TIL density, and stage of disease at all cutoff levels but did not find any significant correlations in conjunction with OS. Lin et al. [12] evaluated the expression of PD-L1, PD-L2, and the density of CD8+ TIL in association with OS, PFS, and risk factors in gallbladder adenocarcinoma by analyzing PD-L1 expression at a 5% cutoff level and performing four subgroup analyses according to PD-L1 expression and CD8+ TILs. According to the results, there were no correlations observed with PD-L1 expression in tumor cells alone except for regarding CD8+ TIL density and worse OS. Instead, the study demonstrated the coevaluation of CD8 TIL and PD-L1 had the significant prognostic value, and patients with high TILs and/or PD-L1 positivity had the worst PFS and OS.
- Based on the above studies, PD-L1 expression in tumor cells as a predictive marker is controversial in GBC. In this study, we evaluated the expression of PD-L1 in 101 GBC cases and investigated the relationship between PD-L1 expression and various clinicopathological parameters or survival. A standard positive cutoff level or biomarker for PD-L1 has not been established [34-36]. Different antibodies (e.g., SP263, SP142, 22C3, 22-8, and E1L3N clones) and cutoff levels (e.g., 1%, 5%, 25%, and 50%) are used in various studies; we used the monoclonal antibody SP263 and the 1%, 10%, and 50% cutoff levels in our investigation. Our study showed a strong positive correlation in poor histologic grade and lymphovascular invasion at any cutoff level of PD-L1 expression. Also, other unfavorable parameters such as perineural invasion, higher T category, and higher pathologic stage of disease showed a significant correlation with PD-L1 expression at the 10% and 50% cutoff levels. Our final aim was to evaluate the prognostic impact of the clinicopathological parameters in survival. In this study, the association between PD-L1 expression at the 50% cutoff level and OS or PFS achieved statistical significance. Other parameters including the presence of lymphovascular invasion and perineural invasion; incomplete resection; higher histologic grade; higher T category, N category, and pathologic stage; and nonpolypoid growth pattern were also significantly associated with poor OS and PFS.
- In summary, although opposite results have been reported regarding the use of PD-L1 expression as a predictive parameter in GBC, our results supported the negative clinical impact of PD-L1 expression as described by Lin et al. [12]. We found that GBC cases with high PD-L1 expression were significantly associated with poor clinicopathological parameters and survival at the 50% cutoff level. Interestingly, although a significant association with PD-L1 expression was found in the two studies using E1L3N and SP263, SP263 did not display any such significance in the previous study by Neyaz et al. [11]. We have to consider the following reasons for discrepancies in PD-L1 expression: dissimilar cutoff levels and anti-PD-L1 antibodies, heterogeneity of tumor, interobserver and intra-observer variability, and the influence of relationships with other indicators such as PD-L1 expression in TILs. Future research with larger study populations focused on elucidating detailed evaluation criteria and identifying the benefit of PD-L1–inhibiting immunomodulating therapies should be conducted.
DISCUSSION
-
Author contributions
Conceptualization: JHK, HJC (Hye Jeong Choi).
Data curation: JHK.
Formal analysis: JHK, MK.
Investigation: JHK.
Methodology: JHK, KK, MK, HJC (Hee Jeong Cha), YMK, JHS, HJC (Hye Jeong Choi).
Project administration: HJC (Hye Jeong Choi).
Resources: HJC (Hye Jeong Choi).
Supervision: HJC (Hye Jeong Choi).
Validation: JHK, KK, MK, HJC (Hee Jeong Cha), YMK, HJC (Hye Jeong Choi).
Visualization: JHK, HJC (Hye Jeong Choi).
Writing—original draft: JHK, HJC (Hye Jeong Choi).
Writing—review & editing: KK, MK, HJC (Hee Jeong Cha), YMK, JHS.
-
Conflicts of Interest
The authors declare that they have no potential conflicts of interest.
-
Funding
No funding to declare.
Notes
Acknowledgments
| Clinicopathological parameter |
PD-L1 |
p-value |
PD-L1 |
p-value |
PD-L1 |
p-value | |||
|---|---|---|---|---|---|---|---|---|---|
| < 1% | ≥ 1% | < 10% | ≥ 10% | < 50% | ≥ 50% | ||||
| Sex | .887 | .270 | > .99a | ||||||
| Male | 36 (43.9) | 8 (42.1) | 36 (41.4) | 8 (57.1) | 41 (44.1) | 3 (37.5) | |||
| Female | 46 (56.1) | 11 (57.9) | 51 (58.6) | 6 (42.9) | 52 (55.9) | 5 (62.5) | |||
| Age (yr) | .259 | .302 | .716a | ||||||
| < 68 | 42 (51.2) | 7 (36.8) | 44 (50.6) | 5 (35.7) | 46 (49.5) | 3 (37.5) | |||
| ≥ 68 | 40 (48.8) | 12 (63.2) | 43 (49.4) | 9 (64.3) | 47 (50.5) | 5 (62.5) | |||
| Histologic type | .132a | .004a | .306a | ||||||
| Adenocarcinoma NOS, ICPN with associated invasive carcinoma | 73 (89.0) | 14 (73.7) | 79 (90.8) | 8 (57.1) | 81 (87.1) | 6 (75.0) | |||
| Adenocarcinoma with other component, others | 9 (11.0) | 5 (26.3) | 8 (9.2) | 6 (42.9) | 12 (12.9) | 2 (25.0) | |||
| Histologic grade | .001 | < .001a | < .001a | ||||||
| Well differentiated | 42 (51.2) | 3 (15.8) | 44 (50.6) | 1 (7.1) | 45 (48.4) | 0 | |||
| Moderately differentiated | 28 (34.1) | 6 (31.6) | 31 (35.6) | 3 (21.4) | 33 (35.5) | 1 (12.5) | |||
| Poorly differentiated, undifferentiated, others | 12 (14.6) | 10 (52.6) | 12 (13.8) | 10 (71.4) | 15 (16.1) | 7 (87.5) | |||
| T category | |||||||||
| pT1 + pT2 | 70 (85.4) | 14 (73.7) | .304a | 76 (87.4) | 8 (57.1) | .012a | 80 (86.0) | 4 (50.0) | .026a |
| pT3 + pT4 | 12 (14.6) | 5 (26.3) | 11 (12.6) | 6 (42.9) | 13 (14.0) | 4 (50.0) | |||
| N category | .260 | .137 | .093a | ||||||
| N0 | 31 (56.4) | 6 (40.0) | 33 (56.9) | 4 (33.3) | 36 (56.3) | 1 (16.7) | |||
| N1 + N2 | 24 (43.6) | 9 (60.0) | 25 (43.1) | 8 (66.7) | 28 (43.8) | 5 (83.3) | |||
| Pathologic stage | .116 | .045 | .010a | ||||||
| I + II | 32 (56.1) | 5 (33.3) | 34 (56.7) | 3 (25.0) | 37 (56.1) | 0 | |||
| III + IV | 25 (43.9) | 10 (66.7) | 26 (43.3) | 9 (75.0) | 29 (43.9) | 6 (100) | |||
| Growth pattern | .315 | .437 | > .99a | ||||||
| Polypoid | 45 (54.9) | 8 (42.1) | 47 (54.0) | 6 (42.9) | 49 (52.7) | 4 (50.0) | |||
| Nonpolypoid (ulcerative) | 37 (45.1) | 11 (57.9) | 40 (46.0) | 8 (57.1) | 44 (47.3) | 4 (50.0) | |||
| Lymphovascular invasion | .015 | .001 | .005a | ||||||
| No | 55 (67.1) | 7 (36.8) | 59 (67.8) | 3 (21.4) | 61 (65.6) | 1 (12.5) | |||
| Yes | 27 (32.9) | 12 (63.2) | 28 (32.2) | 11 (78.6) | 32 (34.4) | 7 (87.5) | |||
| Perineural invasion | .086 | .032a | .023a | ||||||
| No | 56 (68.3) | 9 (47.4) | 60 (69.0) | 5 (35.7) | 63 (67.7) | 2 (25.0) | |||
| Yes | 26 (31.7) | 10 (52.6) | 27 (31.0) | 9 (64.3) | 30 (32.3) | 6 (75.0) | |||
| Tumor location | .487a | .079a | .060a | ||||||
| Fundus | 30 (36.6) | 6 (31.6) | 31 (35.6) | 5 (35.7) | 35 (37.6) | 1 (12.5) | |||
| Body | 33 (40.2) | 7 (36.8) | 35 (40.2) | 5 (35.7) | 36 (38.7) | 4 (50.0) | |||
| Neck, cystic duct | 12 (14.6) | 2 (10.5) | 14 (16.1) | 0 | 14 (15.1) | 0 | |||
| More than 2 portions | 7 (8.5) | 4 (21.1) | 7 (8.0) | 4 (28.6) | 8 (8.6) | 3 (37.5) | |||
| Tumor size (cm) | .040 | .007 | .062a | ||||||
| < 2.7 | 43 (52.4) | 5 (26.3) | 46 (52.9) | 2 (14.3) | 47 (50.5) | 1 (12.5) | |||
| ≥ 2.7 | 39 (47.6) | 14 (73.7) | 41 (47.1) | 12 (85.7) | 46 (49.5) | 7 (87.5) | |||
| Complete resection | .676a | > .99a | .539a | ||||||
| Yes | 75 (91.5) | 17 (89.5) | 79 (90.8) | 13 (92.9) | 85 (91.4) | 7 (87.5) | |||
| No | 7 (8.5) | 2 (10.5) | 8 (9.2) | 1 (7.1) | 8 (8.6) | 1 (12.5) | |||
| Adjuvant chemotherapy | .720 | .344a | .233a | ||||||
| No or refuse | 57 (69.5) | 14 (73.7) | 63 (72.4) | 8 (57.1) | 67 (72.0) | 4 (50.0) | |||
| Yes | 25 (30.5) | 5 (26.3) | 24 (27.6) | 6 (42.9) | 26 (28.6) | 4 (50.0) | |||
| Gallstone | .798 | .339a | .433a | ||||||
| No | 58 (70.7) | 14 (73.7) | 60 (69.0) | 12 (85.7) | 65 (69.9) | 7 (87.5) | |||
| Yes | 24 (29.3) | 5 (26.3) | 27 (31.0) | 2 (14.3) | 28 (30.1) | 1 (12.5) | |||
| Cholecystitis | .228 | .727 | > .99 | ||||||
| No | 21 (91.3) | 2 (8.7) | 21 (91.3) | 2 (8.7) | 21 (91.3) | 2 (8.7) | |||
| Yes | 61 (78.2) | 17 (21.8) | 67 (85.9) | 11 (14.1) | 72 (92.3) | 6 (7.7) | |||
| Diabetes | .512 | .137a | .268a | ||||||
| No | 54 (65.9) | 14 (73.7) | 56 (64.4) | 12 (85.7) | 61 (65.6) | 7 (87.5) | |||
| Yes | 28 (34.1) | 5 (26.3) | 31 (35.6) | 2 (14.3) | 32 (34.4) | 1 (12.5) | |||
| Hypertension | .729 | .346 | .255a | ||||||
| No | 51 (62.2) | 11 (57.9) | 55 (63.2) | 7 (50.0) | 59 (63.4) | 3 (37.5) | |||
| Yes | 31 (37.8) | 8 (42.1) | 32 (36.8) | 7 (50.0) | 34 (36.6) | 5 (62.5) | |||
Values are presented as number (%).
Statistical analysis method: Pearson chi-square test.
PD-L1, programmed death-ligand 1; GBC, gallbladder cancer; NOS, not otherwise specified; ICPN, intracholecystic papillary neoplasm; Others, mixed adenoneuroendocrine carcinoma, signet ring cell carcinoma, mucinous carcinoma, sarcomatoid carcinoma.
a Fisher exact test.
Values are presented as mean ± standard error.
Statistical analysis method: survival analysis by Kaplan-Meier method and log-rank test.
OS, overall survival; PFS, progression-free survival; GBC, gallbladder cancer; NOS, not otherwise specified; ICPN, intracholecystic papillary neoplasm; others, mixed adenoneuroendocrine carcinoma, signet ring cell carcinoma, mucinous carcinoma,sarcomatoid carcinoma; PD-L1, programmed death-ligand 1.
| Disease | No. | Detection specimen; detection antibody | PD-L1 expression cutoff (%) | Other clinicopathological parameters associated with PD-L1 expression | Survival with PD-L1 expression | Study |
|---|---|---|---|---|---|---|
| Gallbladder cancer | 174 | FFPE tissue; anti–PD-L1 (clone SP263) | 1, 10, 50 | Significant positive association with histologic type (squamous cell carcinoma, adenosquamous cell carcinoma, undifferentiated carcinoma), histologic grade (progressed from WD to PD), nuclear grade, stage 3 and 4, TIL (0 to 3+) | OS was not associated with PD-L1 expression | Neyaz et al. [11] |
| Gallbladder adenocarcinoma | 66 | FFPE tissue; anti–PD-L1 (E1L3N) | 5 | PD-L1 positive alone was not correlated with any clinicopathological or pathological parameters except for CD8+ TIL density and worse median OS | Combination of CD8 high with negative expression of PD-L1 serves as prognostic factor for improved OS and PFS | Lin et al. [12] |
| Gastric adenocarcinoma | 240 | FFPE tissue; anti–PD-L1 (E1L3N) | 10 | Patients with poor tumor differentiation had a higher positive rate of PD-L1 expression on tumor cells | Positive PD-L1 expression on TILs had a shorter OS; However, PD-L1 expression on tumor cells was not associated with OS | Fang et al. [23] |
| Gastric cancer | 107 | FFPE tissue; anti–PDL1 (polyclonal antihuman PD-L1/CD274 antibody) | Not applicable | Positive rate of PD-L1 expression is much higher in depth of invasion, high differentiation, lymph node metastasis, and higher T category | PD-L1–positive gastric cancers were significantly associated with a poor prognosis | Qing et al. [24] |
| Esophageal cancer | 41 | Frozen tissue; anti–PD-L1 (MIH1, mouse IgG1) | 10 | Effect of PD-L1 status was more distinct in the advanced stage of tumor with lymph node metastasis and distinct metastasis | Overall survival of patients with tumors positive for both PD-L1 and PD-L2 was significantly worse than that with tumors negative for both | Ohigashi et al. [25] |
| Colorectal cancer | 143 | FFPE tissue; anti–PD-L1 (Abcam, ab58810) | Strong and moderate immunostaining intensity | PD-L1 was significantly associated with cell differentiation status and TNM stage | Positive PD-L1 expression showed a trend shorter survival time; as an independent predictor of prognosis | Shi et al. [26] |
| Lung adenocarcinoma | 163 | FFPE tissue; anti–PD-L1 (Proteintech Group Inc., Chicago, IL, USA) | 5 | PD-L1 had higher positive results in tumors with higher grade differentiation and vascular invasion | PD-L1 expression correlated with better RFS | Yang et al. [27] |
| Lung non-small cell carcinoma | 819 | FFPE tissue; anti–PD-L1 (22C3) | 50 | Lower PD-L1 positivity correlated with lower stage and squamous cell carcinoma than adenocarcinoma | Not assessed | Skov et al. [28] |
| Extrahepatic cholangiocarcinoma | 69 | FFPE tissue; anti–PD-L1 (E1L3N) | Not applicable | Significant correlations of PD-L1 expression with venous invasion and poor differentiation of the tumor were observed | PD-L1 expression was not correlated with patient OS, but combined high PDL1 expression on tumor cells and low infiltration of CD3+ TILs showed poor OS | Walter D et al. [29] |
| Hepatocellular carcinoma | 240 + additional 125 | FFPE tissue; anti–PD-L1 (eBioscience) | High vs. low | PD-L1 expression was an independent prognostic factor for tumor vascular invasion, encapsulation, and TNM stage | PD-L1–positive (high expression) patients had significantly poorer DFS and OS | Gao et al. [30] |
| Hepatocellular carcinoma | 448 | FFPE tissue; anti–PD-L1 (E1L3N) | 1, 5 | No significant difference in PD-L1 expression was detected | Survival analysis showed that 5% PD-L1 expression was significantly correlated with improved rates of OS and RFS | Chen et al. [31] |
| Uveal melanoma | 67 | FFPE tissue; anti–PD-L1 (E1L3N) | 5 | Significant association of PD-L1 expression to a decreased number of TIL | PD-L1 expression is associated with metastasis-free survival | Zoroquiain et al. [32] |
- 1. Shaffer EA. Gallbladder cancer: the basics. Gastroenterol Hepatol (N Y) 2008; 4: 737–41. PubMedPMC
- 2. Goldin RD, Roa JC. Gallbladder cancer: a morphological and molecular update. Histopathology 2009; 55: 218–29. ArticlePubMed
- 3. Albores-Saavedra J, Kloppel G, Adsay NV, et al. Carcinoma of the gallbladder and extrahepatic bile ducts. In: Bosman FT, Carneiro F, Hruban RH, Theise ND, eds. WHO classification of tumours of the digestive system. Lyon: IARC Press, 2010; 266–73. 4th.
- 4. Aloia TA, Jarufe N, Javle M, et al. Gallbladder cancer: expert consensus statement. HPB (Oxford) 2015; 17: 681–90. ArticlePubMedPMC
- 5. Wi Y, Woo H, Won YJ, Jang JY, Shin A. Trends in gallbladder cancer incidence and survival in Korea. Cancer Res Treat 2018; 50: 1444–51. ArticlePubMedPMCPDF
- 6. Kim BW, Oh CM, Choi HY, Park JW, Cho H, Ki M. Incidence and overall survival of biliary tract cancers in South Korea from 2006 to 2015: using the National Health Information Database. Gut Liver 2019; 13: 104–13. ArticlePubMedPDF
- 7. Jiao Y, Pawlik TM, Anders RA, et al. Exome sequencing identifies frequent inactivating mutations in BAP1, ARID1A and PBRM1 in intrahepatic cholangiocarcinomas. Nat Genet 2013; 45: 1470–3. ArticlePubMedPMCPDF
- 8. Javle MM, Rashid A, Kar SP, et al. Identification of unique somatic mutations with functional relevance through genetic characterization of gallbladder cancer (GB ca). J Clin Oncol 2013; 31(4 Suppl):214.Article
- 9. Wu P, Wu D, Li L, Chai Y, Huang J. PD-L1 and survival in solid tumors: a meta-analysis. PLoS One 2015; 10: e0131403. ArticlePubMedPMC
- 10. Pyo JS, Kang G, Kim JY. Prognostic role of PD-L1 in malignant solid tumors: a meta-analysis. Int J Biol Markers 2017; 32: e68–74. ArticlePubMedPDF
- 11. Neyaz A, Husain N, Kumari S, et al. Clinical relevance of PD-L1 expression in gallbladder cancer: a potential target for therapy. Histopathology 2018; 73: 622–33. ArticlePubMed
- 12. Lin J, Long J, Wan X, et al. Classification of gallbladder cancer by assessment of CD8(+) TIL and PD-L1 expression. BMC Cancer 2018; 18: 766.ArticlePubMedPMCPDF
- 13. Takahashi R, Yoshitomi M, Yutani S, et al. Current status of immunotherapy for the treatment of biliary tract cancer. Hum Vaccin Immunother 2013; 9: 1069–72. ArticlePubMedPMC
- 14. Bang YJ, Ueno M, Malka D, et al. Pembrolizumab (pembro) for advanced biliary adenocarcinoma: results from the KEYNOTE-028 (KN028) and KEYNOTE-158 (KN158) basket studies. J Clin Oncol 2019; 37(15 Suppl):4079.Article
- 15. Amin MB, Edge S, Greene F, et al. AJCC cancer staging manual. New York: Springer, 2017.
- 16. Schmid P, Adams S, Rugo HS, et al. Atezolizumab and Nab-paclitaxel in advanced triple-negative breast cancer. N Engl J Med 2018; 379: 2108–21. ArticlePubMed
- 17. Motzer RJ, Penkov K, Haanen J, et al. Avelumab plus axitinib versus sunitinib for advanced renal-cell carcinoma. N Engl J Med 2019; 380: 1103–15. ArticlePubMedPMC
- 18. Giroux Leprieur E, Dumenil C, Julie C, et al. Immunotherapy revolutionises non-small-cell lung cancer therapy: results, perspectives and new challenges. Eur J Cancer 2017; 78: 16–23. ArticlePubMed
- 19. Carretero-González A, Lora D, Ghanem I, et al. Analysis of response rate with ANTI PD1/PD-L1 monoclonal antibodies in advanced solid tumors: a meta-analysis of randomized clinical trials. Oncotarget 2018; 9: 8706–15. ArticlePubMedPMC
- 20. Zhao B, Zhang W, Yu D, Xu J, Wei Y. The benefit and risk of nivolumab in non-small-cell lung cancer: a single-arm meta-analysis of noncomparative clinical studies and randomized controlled trials. Cancer Med 2018; 7: 1642–59. ArticlePubMedPMC
- 21. Reck M, Rodriguez-Abreu D, Robinson AG, et al. Pembrolizumab versus chemotherapy for PD-L1-positive non-small-cell lung cancer. N Engl J Med 2016; 375: 1823–33. ArticlePubMed
- 22. Wang X, Teng F, Kong L, Yu J. PD-L1 expression in human cancers and its association with clinical outcomes. Onco Targets Ther 2016; 9: 5023–39. ArticlePubMedPMC
- 23. Fang W, Chen Y, Sheng J, et al. Association between PD-L1 expression on tumour-infiltrating lymphocytes and overall survival in patients with gastric cancer. J Cancer 2017; 8: 1579–85. ArticlePubMedPMC
- 24. Qing Y, Li Q, Ren T, et al. Upregulation of PD-L1 and APE1 is associated with tumorigenesis and poor prognosis of gastric cancer. Drug Des Devel Ther 2015; 9: 901–9. ArticlePubMedPMC
- 25. Ohigashi Y, Sho M, Yamada Y, et al. Clinical significance of programmed death-1 ligand-1 and programmed death-1 ligand-2 expression in human esophageal cancer. Clin Cancer Res 2005; 11: 2947–53. ArticlePubMed
- 26. Shi SJ, Wang LJ, Wang GD, et al. B7-H1 expression is associated with poor prognosis in colorectal carcinoma and regulates the proliferation and invasion of HCT116 colorectal cancer cells. PLoS One 2013; 8: e76012. ArticlePubMedPMC
- 27. Yang CY, Lin MW, Chang YL, Wu CT, Yang PC. Programmed cell death-ligand 1 expression in surgically resected stage I pulmonary adenocarcinoma and its correlation with driver mutations and clinical outcomes. Eur J Cancer 2014; 50: 1361–9. ArticlePubMed
- 28. Skov BG, Rorvig SB, Jensen TH, Skov T. The prevalence of programmed death ligand-1 (PD-L1) expression in non-small cell lung cancer in an unselected, consecutive population. Mod Pathol 2020; 33: 109–17. ArticlePubMedPDF
- 29. Walter D, Herrmann E, Schnitzbauer AA, et al. PD-L1 expression in extrahepatic cholangiocarcinoma. Histopathology 2017; 71: 383–92. ArticlePubMed
- 30. Gao Q, Wang XY, Qiu SJ, et al. Overexpression of PD-L1 significantly associates with tumor aggressiveness and postoperative recurrence in human hepatocellular carcinoma. Clin Cancer Res 2009; 15: 971–9. ArticlePubMed
- 31. Chen CL, Pan QZ, Zhao JJ, et al. PD-L1 expression as a predictive biomarker for cytokine-induced killer cell immunotherapy in patients with hepatocellular carcinoma. Oncoimmunology 2016; 5: e1176653. ArticlePubMedPMC
- 32. Zoroquiain P, Esposito E, Logan P, et al. Programmed cell death ligand-1 expression in tumor and immune cells is associated with better patient outcome and decreased tumor-infiltrating lymphocytes in uveal melanoma. Mod Pathol 2018; 31: 1201–10. ArticlePubMedPDF
- 33. Ha H, Nam AR, Bang JH, et al. Soluble programmed death-ligand 1 (sPD-L1) and neutrophil-to-lymphocyte ratio (NLR) predicts survival in advanced biliary tract cancer patients treated with palliative chemotherapy. Oncotarget 2016; 7: 76604–12. ArticlePubMedPMC
- 34. Diggs LP, Hsueh EC. Utility of PD-L1 immunohistochemistry assays for predicting PD-1/PD-L1 inhibitor response. Biomark Res 2017; 5: 12.ArticlePubMedPMCPDF
- 35. Festino L, Botti G, Lorigan P, et al. Cancer treatment with anti-PD-1/PD-L1 agents: is PD-L1 expression a biomarker for patient selection? Drugs 2016; 76: 925–45. ArticlePubMedPDF
- 36. O’Malley DP, Yang Y, Boisot S, et al. Immunohistochemical detection of PD-L1 among diverse human neoplasms in a reference laboratory: observations based upon 62,896 cases. Mod Pathol 2019; 32: 929–42. ArticlePubMedPMCPDF
References
Figure & Data
References
Citations
- Lacking Immunotherapy Biomarkers for Biliary Tract Cancer: A Comprehensive Systematic Literature Review and Meta-Analysis
Giorgio Frega, Fernando P. Cossio, Jesus M. Banales, Vincenzo Cardinale, Rocio I. R. Macias, Chiara Braconi, Angela Lamarca
Cells.2023; 12(16): 2098. CrossRef - Gallbladder carcinomas: review and updates on morphology, immunohistochemistry, and staging
Whayoung Lee, Vishal S. Chandan
Human Pathology.2023; 132: 149. CrossRef - Prognostic Relevance of PDL1 and CA19-9 Expression in Gallbladder Cancer vs. Inflammatory Lesions
Neetu Rawal, Supriya Awasthi, Nihar Ranjan Dash, Sunil Kumar, Prasenjit Das, Amar Ranjan, Anita Chopra, Maroof Ahmad Khan, Sundeep Saluja, Showket Hussain, Pranay Tanwar
Current Oncology.2023; 30(2): 1571. CrossRef - Identification of genes associated with gall bladder cell carcinogenesis: Implications in targeted therapy of gall bladder cancer
Ishita Ghosh, Ruma Dey Ghosh, Soma Mukhopadhyay
World Journal of Gastrointestinal Oncology.2023; 15(12): 2053. CrossRef - CD73 and PD-L1 as Potential Therapeutic Targets in Gallbladder Cancer
Lu Cao, Kim R. Bridle, Ritu Shrestha, Prashanth Prithviraj, Darrell H. G. Crawford, Aparna Jayachandran
International Journal of Molecular Sciences.2022; 23(3): 1565. CrossRef - Evolving Role of Immunotherapy in Advanced Biliary Tract Cancers
Sandra Kang, Bassel F. El-Rayes, Mehmet Akce
Cancers.2022; 14(7): 1748. CrossRef - Novel immune scoring dynamic nomograms based on B7-H3, B7-H4, and HHLA2: Potential prediction in survival and immunotherapeutic efficacy for gallbladder cancer
Chao Lv, Shukun Han, Baokang Wu, Zhiyun Liang, Yang Li, Yizhou Zhang, Qi Lang, Chongli Zhong, Lei Fu, Yang Yu, Feng Xu, Yu Tian
Frontiers in Immunology.2022;[Epub] CrossRef - PD-1 inhibitors plus nab-paclitaxel-containing chemotherapy for advanced gallbladder cancer in a second-line setting: A retrospective analysis of a case series
Sirui Tan, Jing Yu, Qiyue Huang, Nan Zhou, Hongfeng Gou
Frontiers in Oncology.2022;[Epub] CrossRef - Expression of HER2 and Mismatch Repair Proteins in Surgically Resected Gallbladder Adenocarcinoma
You-Na Sung, Sung Joo Kim, Sun-Young Jun, Changhoon Yoo, Kyu-Pyo Kim, Jae Hoon Lee, Dae Wook Hwang, Shin Hwang, Sang Soo Lee, Seung-Mo Hong
Frontiers in Oncology.2021;[Epub] CrossRef - Programmed Death Ligand-1 (PD-L1) Is an Independent Negative Prognosticator in Western-World Gallbladder Cancer
Thomas Albrecht, Fritz Brinkmann, Michael Albrecht, Anke S. Lonsdorf, Arianeb Mehrabi, Katrin Hoffmann, Yakup Kulu, Alphonse Charbel, Monika N. Vogel, Christian Rupp, Bruno Köhler, Christoph Springfeld, Peter Schirmacher, Stephanie Roessler, Benjamin Goep
Cancers.2021; 13(7): 1682. CrossRef - Immune Microenvironment in Gallbladder Adenocarcinomas
Pallavi A. Patil, Kara Lombardo, Weibiao Cao
Applied Immunohistochemistry & Molecular Morphology.2021; 29(8): 557. CrossRef - Molecular Targets and Emerging Therapies for Advanced Gallbladder Cancer
Matteo Canale, Manlio Monti, Ilario Giovanni Rapposelli, Paola Ulivi, Francesco Giulio Sullo, Giulia Bartolini, Elisa Tiberi, Giovanni Luca Frassineti
Cancers.2021; 13(22): 5671. CrossRef - Overview of current targeted therapy in gallbladder cancer
Xiaoling Song, Yunping Hu, Yongsheng Li, Rong Shao, Fatao Liu, Yingbin Liu
Signal Transduction and Targeted Therapy.2020;[Epub] CrossRef
 PubReader
 ePub Link
-
 Cite this Article
- Cite this Article
-
- Close
- Download Citation
- Close
- Figure
-


