 E-submission
Articles
- Page Path
- HOME > J Pathol Transl Med > Volume 47(2); 2013 > Article
-
Original Article
EGFR Gene Amplification and Protein Expression in Invasive Ductal Carcinoma of the Breast - Won Hwangbo, Jeong Hyeon Lee, Sangjeong Ahn, Seojin Kim, Kyong Hwa Park, Chul Hwan Kim, Insun Kim
-
Korean Journal of Pathology 2013;47(2):107-115.
DOI: https://doi.org/10.4132/KoreanJPathol.2013.47.2.107
Published online: April 24, 2013
Department of Pathology, Korea University Anam Hospital, Korea University College of Medicine, Seoul, Korea.
- Corresponding Author: Insun Kim, M.D. Department of Pathology, Korea University Anam Hospital, Korea University College of Medicine, 73 Inchon-ro, Seongbuk-gu, Seoul 136-705, Korea. Tel: +82-2-920-5595, Fax: +82-2-920-6576, iskim@korea.ac.kr
© 2013 The Korean Society of Pathologists/The Korean Society for Cytopathology
This is an Open Access article distributed under the terms of the Creative Commons Attribution Non-Commercial License (http://creativecommons.org/licenses/by-nc/3.0/) which permits unrestricted non-commercial use, distribution, and reproduction in any medium, provided the original work is properly cited.
Abstract
-
Background
- The epidermal growth factor receptor (EGFR) is a surrogate marker for basal-like breast cancer. A recent study suggested that EGFR may be used as a target for breast cancer treatment.
-
Methods
- A total of 706 invasive ductal carcinomas (IDC) of the breast were immunophenotyped, and 82 cases with EGFR protein expression were studied for EGFR gene amplification.
-
Results
- EGFR protein was expressed in 121 of 706 IDCs (17.1%); 5.9% were of luminal type, 25.3% of epidermal growth factor receptor 2 (HER-2) type, and 79.3% of basal-like tumors. EGFR gene amplification and high polysomy (fluorescent in situ hybridization [FISH]-positive) were found in 18 of 82 cases (22.0%); 41.2% of the HER-2+, EGFR+, cytokeratin 5/6- (CK5/6-) group, 11.2% of the HER-2-, EGFR+, CK5/6- group, and 19.1% of the HER-2-, EGFR+, CK5/6+ group. FISH-positive cases were detected in 8.3% of the EGFR protein 1+ expression cases, 15.9% of 2+ expression cases, and 38.5% of 3+ expression cases. In group 2, the tumors had a high Ki-67 labeling (>60%), but the patients showed better disease-free survival than those with tumors that co-expressed HER-2 or CK5/6.
-
Conclusions
- EGFR-directed therapy can be considered in breast cancer patients with EGFR protein overexpression and gene amplification, and its therapeutic implication should be determined in HER-2 type breast cancer patients.
- Selection of cases
- Among 946 breast cancer patients whose cancer was diagnosed at the Anam Hospital of Korea University Medical Center between September 2005 and July 2011, 706 patients with IDCs were identified and analyzed in this study. All cases were routinely processed and diagnosed with immunohistochemical stains for ER, PR, HER-2, CK5/6, EGFR, p53, and Ki-67. All clinicopathological findings, including age of the patient, tumor size, histological grade, lymph node metastasis, treatment modality, and patient survival were retrieved from the pathological and clinical records.
- Immunohistochemical staining
- The routinely processed paraffin blocks were cut into sections of 4 µm thickness; these sections were deparaffinized in xylene and hydrated by immersing in a series of graded ethanol. Antigen retrieval was performed in a microwave by placing the sections in epitope retrieval solution (0.01 M citrate buffer, pH 6.0 or 10 mM ethylenediaminetetraacetic acid, pH 8.0) for 20 minutes; endogenous peroxidase was blocked by immersing the sections in 0.3% hydrogen peroxide for 10 minutes. Immunostaining was performed using the Dako Autostainer plus Universal Staining System (Dako Cytomation, Carpinteria, CA, USA) with a ChemMate DAKO EnVision detection kit. The characteristics of the primary antibodies against ER, PR, HER-2, CK5/6, EGFR, p53, and Ki-67 are summarized in Table 1.
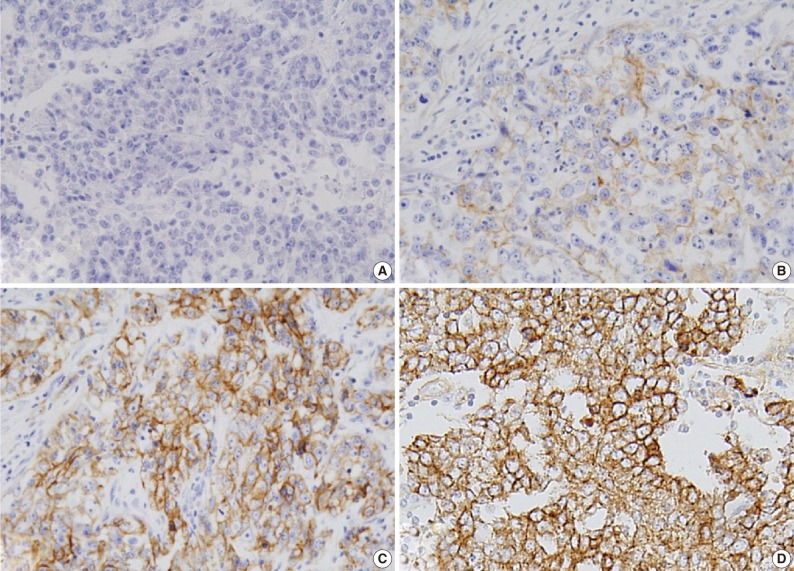
- Expression of ER and PR was evaluated according to the Allred scoring system, and HER-2 expression was scored according to the criteria described in the HercepTest. In the case with 2+ HER-2 expression, a fluorescent in situ hybridization (FISH) study was performed. For EGFR expression, the same criteria were applied as for HER-2 (Table 2, Fig. 1).5,6,16 The expression of p53 and Ki-67 was counted in 1,000 tumor cells, and the percentage of positive cells was categorized as ≤60% or >60%.
- Construction of tissue microarray (TMA)
- Hematoxylin and eosin-stained slides were reviewed and the appropriate area was marked. The corresponding formalin-fixed, paraffin-embedded tissue block was retrieved, and the selected area was marked. One 5 mm diameter core was punched out from each block sample and incorporated into a recipient paraffin block using a precision instrument (UNITMA Co. Ltd., Seoul, Korea). The TMA block was heated in an oven at 60℃ for 30 minutes and then embedded in a paraffin block.
- FISH analysis of EGFR copy number
- EGFR copy number was analyzed by FISH in a 4 µm-thick tissue section derived from the TMA block. A probe for the EGFR locus (7p11.2), labeled with Texas Red, was used in combination with a fluorescein isothiocyanate-labeled centromeric probe for chromosome 7. The procedure was performed according to the manufacturer's instructions (Cytocell, Cambridge, UK). The tissue section was incubated at 56℃ overnight, deparaffinized in xylene, hydrated in 100% and 70% ethanol, and treated in 0.1 M HCl at room temperature for 20 minutes. After incubation in the pretreatment reagent (Abbott Molecular Inc., Des Plaines, IL, USA) at 80℃ for 30 minutes, the section was digested with pepsin (2 mg/mL in 0.01 M HCl) at 37℃ for 10-20 minutes and dehydrated in an ethanol series. The probe set was applied, and the section was covered with a coverslip and sealed with rubber cement. For denaturation, the slides were incubated at 75℃ for 5 minutes; for hybridization, they were left in a humidified chamber at 37℃ overnight. Post-hybridization washes were performed in 0.4× saline sodium citrate buffer (0.4× SSC)/Nonidet P-40 (NP-40; pH 7.0) at 72℃ for 2 minutes and in 2× SSC/NP-40 (pH 7.0) at room temperature for 1 minute. After washing and drying at room temperature, the slide was counterstained with 4'-6-diamidino-2-phenylindole I (10 ng/µL; Abbott Molecular Inc.) and analyzed via FISH.
- FISH results were represented as the ratio of EGFR to chromosome 7 centromeric signals from 50 non-overlapping tumor cell nuclei. Gene amplification was defined as the presence of EGFR gene clusters and ≥2.0 or ≥15 copies of EGFR per cell in ≥10% of total cells. High polysomy was defined as a ratio of <2.0 but displaying ≥4 copies in ≥40% of cells, whereas low polysomy was defined as 10-40% of cells in the population displaying ≥4 copies. Disomy was defined as ≥90% of cells containing ≤2 copies of both EGFR and centromeric probes. Low trisomy was defined when ≥40% of cells in a population displayed ≤2 copies, 10-40% of cells displayed three copies, and <10% of cells displayed ≥4 copies, whereas high trisomy was defined as ≥40% of cells displaying ≤2 copies, ≥40% of cells containing three copies, and <10% of cells containing ≥4 copies (Fig. 2).17,18 High polysomy and gene amplification were determined from an increase of gene copy number.
- Statistical analysis
- The dichotomized variables among the groups were statistically compared using Pearson's χ2 test. If the two-sided p-value was <0.0167, the difference was regarded as significant. Disease-free survival was analyzed by constructing a Kaplan-Meier survival curve and compared with a log rank test. All statistical analyses were performed using the SPSS ver. 14.0.1 (SPSS Inc., Chicago, IL, USA).
MATERIALS AND METHODS
- EGFR protein expression
- The 706 IDCs identified here were classified into molecular subtypes according to immunohistochemical expression profiles; 378 belonged to the luminal A type (ER+ and/or PR+, HER-2-), 141 to the luminal B type (ER+ and/or PR+, HER-2+), 99 to the HER-2 type (ER-, PR-, HER-2+), 82 to the basal-like type (ER-, PR-, HER-2-, CK5/6+, and/or EGFR+), and six to the triple-negative, non-basal-like type (ER-, PR-, HER-2-, CK5/6-, EGFR-). HER-2+ was defined as HER-2 3+ or 2+ upon gene amplification analysis using FISH.
- EGFR expression was found in 121 cases (17.1%): 31 of the 519 luminal A/B type (5.9%), 25 of the 99 HER-2 type (25.3%), and 65 of the 82 basal-like type (79.3%) cases. The luminal and HER-2 types that were EGFR+ and CK5/6+ were excluded; thus, 82 cases were selected and assigned to one of three groups on the basis of immunohistochemical expression profile (Fig. 3) as follows: group 1 (HER-2+, EGFR+, CK5/6-), group 2 (HER-2-, EGFR+, CK5/6-), and group 3 (HER-2-, EGFR+, CK5/6+).
- EGFR expression was scored as 1+ in 12 cases (14.6%), 2+ in 44 cases (53.7%), and 3+ in 26 cases (31.7%).
- Changes in EGFR gene copy number
- EGFR disomy, trisomy, polysomy, and gene amplification were found in 28, 20, 18, and 16 of the 82 EGFR+ cases, respectively. Two high polysomy and 16 gene amplification cases (22.0%) were identified using FISH. Gene amplification and high polysomy in group 1 (seven of 17, 41.2%) was higher than that in group 2 (two of 18 cases, 11.2%) and group 3 (nine of 47 cases, 19.1%), but this difference was not statistically significant (Table 3).
- EGFR protein expression and changes in the gene copy number
- FISH analysis of EGFR showed only one case of gene amplification among 12 cases with EGFR 1+ expression (8.3%), six cases of amplifications and one case of high polysomy among 44 cases with EGFR 2+ expression (15.9%), and nine cases of amplification and one case of high polysomy among 26 cases with EGFR 3+ expression (38.5%) (Table 4). EGFR gene amplification and high polysomy were more frequent in cases with EGFR 3+ expression (p=0.021).
- Clinicopathological characteristics of patients in the EGFR expression groups
- The clinicopathological characteristics of 82 patients with EGFR expression are summarized according to the various groups in Table 5. The age of the patients ranged from 25 to 75 years (mean, 50.4 years) at the time of diagnosis, and this criterion did not differ significantly among the groups. The mean tumor size was 1.4 cm in group 1, 2.5 cm in group 2, and 2.3 cm in group 3. The tumor size in group 1 was significantly smaller than that in group 2 (p=0.009), and cases scored as histological grade 3 were significantly more frequent in group 3 than in group 1 (p=0.001) and group 2 (p<0.001). Lymph node metastasis was more frequent in group 1 patients than in group 2 and 3 patients, but this difference did not reach statistical significance. High Ki-67 labeling (>60%) occurred significantly more frequently in tumors from group 2 patients than in those from group 1 (p=0.004) and group 3 (p=0.009) patients. There was no significant difference in high p53 expression (>60%) among groups.
- Disease-free survival of patients in different groups
- The treatment modality and recurrence of the tumor in the patients are summarized in Table 6. Group 1 patients with HER-2-expressing tumors were mainly treated with Herceptin and/or chemotherapy, with or without radiotherapy. Most of the patients in groups 2 and 3 with basal-like tumors were treated with chemotherapy only or in combination with radiotherapy. No additional treatment was administered to four patients.
- Patients were followed up for a period ranging from 1 to 100 months (mean, 20 months). During this follow-up period, 14 patients experienced recurrence, and one of the group 2 patients died because of disease progression. The recurrence rate in group 1 patients (5/17, 29.4%) was higher than that in group 2 patients (2/18, 11.1%) and group 3 patients (7/47, 14.9%), but this difference did not reach statistical significance.
- Kaplan-Meier survival curves for group-specific disease-free-survival are presented in Fig. 4. Patients in group 2 had significantly better disease-free survival than did patients in groups 1 and 3 (p=0.0112). Patients in group 3 had better disease-free survival than did those in group 1, but this difference was not statistically significant. In three of eight patients with HER-2-expressing tumors, who were treated with Herceptin and experienced recurrence, EGFR expression was scored as 2+ or 3+. Patient survival showed no statistical correlation with either EGFR gene amplification and polysomy or the level of EGFR expression.
RESULTS
- Among breast cancers, those described as HER-2, basal-like, or triple-negative types are characterized by earlier age of onset, late clinical stage, and larger tumor size at diagnosis. These subtypes also have a higher histological grade, lymph node metastasis, and poorer overall and disease-free survival rates than do the hormone receptor-positive subtypes.19,20 Because patients with an ER-/HER-2+ immunophenotype may be treated with anti-HER-2 therapy, they have better overall and disease-free survival rates than do patients with TNBC.21,22 EGFR is used as a basal marker, but it also plays a role as a prognostic marker, because EGFR-expressing breast cancers are associated with poor overall and disease-free survival rates.3,14
- The incidence of EGFR expression in breast cancer is extremely variable according to published data.3,4 The most important factors underlying this variation seem to be differences in the study groups and the criteria used for scoring cells as positive. For example, some studies score only EGFR expression levels 2+ and 3+ as EGFR overexpression, whereas others also include EGFR protein expression level 1+.22,23
- In this study, all cases with EGFR expression from 1+ to 3+ were considered positive because EGFR gene amplification was reported in EGFR protein 1+ breast cancers.12,15 EGFR protein expression rate was 17.1% of 706 IDCs; 5.9% of luminal type, 25.3% of HER-2 type, and 79.3% of basal-like tumors. The tumors with HER-2+, EGFR+, CK5/6- expression were smaller than the BLBC tumors with expression of EGFR and with or without CK5/6 expression. The tumors with expression of both EGFR and CK5/6 were in histologic grade 3 compared with tumors expressing EGFR alone or with HER-2. Tumors with expression of EGFR without HER-2 or CK5/6 had high Ki-67 labeling, and patients with this phenotype had better survival than the other patients. This may be partly due to the increased chemosensitivity of highly proliferative tumors.
- HER-2, a member of the EGFR family, is overexpressed in 15-25% of IDCs, and this overexpression is mainly associated with gene amplification. Because adjuvant treatment with trastuzumab improves the survival of patients with HER-2 type breast cancers, HER-2 overexpression and/or gene amplification is now routinely evaluated in every primary breast cancer at the time of initial diagnosis or upon recurrence to select patients eligible for HER-targeted therapy.24
- EGFR overexpression in a variety of human cancers is due to gene amplification and/or activating mutation. In breast cancers, both EGFR gene amplification and mutation are rare.13 Studies using a chromogenic approach or FISH reported amplification in 0.8-14% of breast cancers.4,11-15 More importantly, gene amplification was reported in up to 21% of BLBCs and 37% of metaplastic carcinomas.13 Although EGFR gene amplification was more commonly found in tumors that express high levels of EGFR, no positive correlation was observed between protein expression and gene amplification.12 Another mechanism has been proposed for EGFR overexpression-alternative splicing of EGFR mRNA.13 In the present study, the authors used FISH-positivity to score high polysomy and gene amplification. FISH-positive tumors were found at a frequency of 20.0% (18/82) in EGFR protein-positive breast cancers; the frequency was higher in HER-2 and EGFR co-expressing tumors than in BLBCs. The EGFR FISH-positive rate was associated with increased protein expression (8.3% in 1+, 15.9% in 2+, and 38.5% in 3+), and EGFR gene amplification and high polysomy were more frequent in cases where the EGFR protein level was scored as 3+. However, EGFR protein expression was not always accompanied by gene amplification.
- Recent studies on NSCLC have reported that approximately 10% of NSCLC patients showed a clinical response to EGFR-targeted therapy.7-9 Small-molecule EGFR inhibitors (tyrosine kinase inhibitors) and anti-EGFR monoclonal antibodies have been used in the clinic as molecular-targeted agents against EGFR for the treatment of patients with EGFR-expressing tumors; however, the results have not been promising.13,14
- Our current study and those of others demonstrate that EGFR protein expression and gene amplification are significantly associated with HER-2 protein expression and/or gene amplification.25 The EGFR/HER-2 heterodimer is biologically more active than the EGFR homodimer, and it increases the growth potential of the cells. However, the results of clinical trials of dual inhibitors for EGFR and HER-2 revealed that the response depends more on the expression of HER-2 than on EGFR expression. This result is consistent with the finding that interaction of EGFR with other receptor kinases such as c-MET and IGF-1R is associated with resistance to EGFR-targeted therapy.26 In the present study, three of five patients with recurrent HER-2- and EGFR-expressing tumors had EGFR protein expression levels of either 2+ or 3+. Further studies should be performed to define the significance of EGFR protein expression and/or gene amplification in HER-2-positive tumors. Because EGFR regulates the epithelial-mesenchymal transition, EGFR-targeted therapies have been performed in combination with cytotoxic drugs to inhibit invasion or metastasis.14,27,28
- Recent studies confirm that EGFR is a potentially important target in EGFR-expressing breast cancer, in particular, in BLBC cases. Because the frequencies of EGFR gene amplification and mutation are low, EGFR protein expression may be a more useful biologic predictor.4 However, standardization of the methodology and scoring system for protein expression and understanding the pathogenetic mechanisms responsible for protein overexpression are essential to stratify patients for EGFR-targeted therapy.
DISCUSSION
- 1. Onitilo AA, Engel JM, Greenlee RT, Mukesh BN. Breast cancer subtypes based on ER/PR and HER2 expression: comparison of clinicopathologic features and survival. Clin Med Res 2009; 7: 4-13. ArticlePubMedPMC
- 2. Lin C, Chien SY, Chen LS, Kuo SJ, Chang TW, Chen DR. Triple negative breast carcinoma is a prognostic factor in Taiwanese women. BMC Cancer 2009; 9: 192.ArticlePubMedPMCPDF
- 3. Tsutsui S, Kataoka A, Ohno S, Murakami S, Kinoshita J, Hachitanda Y. Prognostic and predictive value of epidermal growth factor receptor in recurrent breast cancer. Clin Cancer Res 2002; 8: 3454-3460. PubMed
- 4. Cho EY, Choi YL, Han JJ, Kim KM, Oh YL. Expression and amplification of HER2, EGFR and cyclin D1 in breast cancer: immunohistochemistry and chromogenic in situ hybridization. Pathol Int 2008; 58: 17-25. ArticlePubMed
- 5. Tang Y, Zhu L, Li Y, et al. Overexpression of epithelial growth factor receptor (EGFR) predicts better response to neo-adjuvant chemotherapy in patients with triple-negative breast cancer. J Transl Med 2012; 10(Suppl 1):S4.ArticlePubMedPMCPDF
- 6. Yu H, Gong X, Luo X, et al. Co-expression of EGFRvIII with ErbB-2 enhances tumorigenesis: EGFRvIII mediated constitutively activated and sustained signaling pathways, whereas EGF-induced a transient effect on EGFR-mediated signaling pathways. Cancer Biol Ther 2008; 7: 1818-1828. ArticlePubMed
- 7. Hirsch FR, Varella-Garcia M, Cappuzzo F, et al. Combination of EGFR gene copy number and protein expression predicts outcome for advanced non-small-cell lung cancer patients treated with gefitinib. Ann Oncol 2007; 18: 752-760. ArticlePubMed
- 8. Moroni M, Veronese S, Benvenuti S, et al. Gene copy number for epidermal growth factor receptor (EGFR) and clinical response to antiEGFR treatment in colorectal cancer: a cohort study. Lancet Oncol 2005; 6: 279-286. ArticlePubMed
- 9. Vokes EE, Chu E. Anti-EGFR therapies: clinical experience in colorectal, lung, and head and neck cancers. Oncology (Williston Park) 2006; 20(5 Suppl 2):15-25. PubMed
- 10. Nguyen KS, Neal JW. First-line treatment of EGFR-mutant non-small-cell lung cancer: the role of erlotinib and other tyrosine kinase inhibitors. Biologics 2012; 6: 337-345. PubMedPMC
- 11. Al-Kuraya K, Schraml P, Torhorst J, et al. Prognostic relevance of gene amplifications and coamplifications in breast cancer. Cancer Res 2004; 64: 8534-8540. ArticlePubMedPDF
- 12. Shao MM, Zhang F, Meng G, et al. Epidermal growth factor receptor gene amplification and protein overexpression in basal-like carcinoma of the breast. Histopathology 2011; 59: 264-273. ArticlePubMed
- 13. Bhargava R, Gerald WL, Li AR, et al. EGFR gene amplification in breast cancer: correlation with epidermal growth factor receptor mRNA and protein expression and HER-2 status and absence of EGFR-activating mutations. Mod Pathol 2005; 18: 1027-1033. ArticlePubMedPDF
- 14. Masuda H, Zhang D, Bartholomeusz C, Doihara H, Hortobagyi GN, Ueno NT. Role of epidermal growth factor receptor in breast cancer. Breast Cancer Res Treat 2012; 136: 331-345. ArticlePubMedPDF
- 15. Nakajima H, Ishikawa Y, Furuya M, et al. Protein expression, gene amplification, and mutational analysis of EGFR in triple-negative breast cancer. Breast Cancer 2012 4 06 [Epub]. http://dx.doi.org/10.1007/s12282-012-0354-1. ArticlePDF
- 16. Milanezi F, Carvalho S, Schmitt FC. EGFR/HER2 in breast cancer: a biological approach for molecular diagnosis and therapy. Expert Rev Mol Diagn 2008; 8: 417-434. ArticlePubMed
- 17. Varella-Garcia M, Diebold J, Eberhard DA, et al. EGFR fluorescence in situ hybridisation assay: guidelines for application to non-small-cell lung cancer. J Clin Pathol 2009; 62: 970-977. ArticlePubMedPMC
- 18. Gumuskaya B, Alper M, Hucumenoglu S, Altundag K, Uner A, Guler G. EGFR expression and gene copy number in triple-negative breast carcinoma. Cancer Genet Cytogenet 2010; 203: 222-229. ArticlePubMed
- 19. Fulford LG, Easton DF, Reis-Filho JS, et al. Specific morphological features predictive for the basal phenotype in grade 3 invasive ductal carcinoma of breast. Histopathology 2006; 49: 22-34. ArticlePubMed
- 20. Livasy CA, Karaca G, Nanda R, et al. Phenotypic evaluation of the basal-like subtype of invasive breast carcinoma. Mod Pathol 2006; 19: 264-271. ArticlePubMedPDF
- 21. Piccart-Gebhart MJ, Procter M, Leyland-Jones B, et al. Trastuzumab after adjuvant chemotherapy in HER2-positive breast cancer. N Engl J Med 2005; 353: 1659-1672. PubMed
- 22. Elkin EB, Weinstein MC, Winer EP, Kuntz KM, Schnitt SJ, Weeks JC. HER-2 testing and trastuzumab therapy for metastatic breast cancer: a cost-effectiveness analysis. J Clin Oncol 2004; 22: 854-863. ArticlePubMed
- 23. Park K, Han S, Shin E, Kim HJ, Kim JY. EGFR gene and protein expression in breast cancers. Eur J Surg Oncol 2007; 33: 956-960. ArticlePubMed
- 24. Wolff AC, Hammond ME, Schwartz JN, et al. American Society of Clinical Oncology/College of American Pathologists guideline recommendations for human epidermal growth factor receptor 2 testing in breast cancer. J Clin Oncol 2007; 25: 118-145. PubMed
- 25. Qian X, LeVea CM, Freeman JK, Dougall WC, Greene MI. Heterodimerization of epidermal growth factor receptor and wild-type or kinase-deficient Neu: a mechanism of interreceptor kinase activation and transphosphorylation. Proc Natl Acad Sci U S A 1994; 91: 1500-1504. ArticlePubMedPMC
- 26. Jin Q, Esteva FJ. Cross-talk between the ErbB/HER family and the type I insulin-like growth factor receptor signaling pathway in breast cancer. J Mammary Gland Biol Neoplasia 2008; 13: 485-498. ArticlePubMedPDF
- 27. Zhang D, LaFortune TA, Krishnamurthy S, et al. Epidermal growth factor receptor tyrosine kinase inhibitor reverses mesenchymal to epithelial phenotype and inhibits metastasis in inflammatory breast cancer. Clin Cancer Res 2009; 15: 6639-6648. ArticlePubMedPMCPDF
- 28. Carey LA, Dees EC, Sawyer L, et al. The triple negative paradox: primary tumor chemosensitivity of breast cancer subtypes. Clin Cancer Res 2007; 13: 2329-2334. ArticlePubMedPDF
REFERENCES


| Treatment | Group 1 (HER-2+, CK5/6–, EFGR+) | Group 2 (HER-2–, CK5/6–, EGFR+) | Group 3 (HER-2–, CK5/6+, EGFR+) |
|---|---|---|---|
| Chemotherapy | 5 (1) | 4 (1)a | 17 (3) |
| Herceptin therapy | 1 (1) | ||
| Radiotherapy | 1 | 2 | 4 (2) |
| Chemotherapy and Herceptin therapy | 2 (1) | ||
| Chemotherapy and radiotherapy | 1 | 9 (1) | 23 |
| Herceptin therapy and radiotherapy | 3 (2) | ||
| Radiotherapy and hormone therapy | 1 (1) | ||
| Chemotherapy, Herceptin therapy and radiotherapy | 3 | ||
| None | 2 (1) | 3 | 1 |
| Total | 17 (5) | 18 (2)a | 47 (7) |
Figure & Data
References
Citations
- An overview of phenylsulfonylfuroxan-based nitric oxide donors for cancer treatment
Chao Gao, Xingyu Li, Tong Liu, Wanning Wang, Jianhui Wu
Bioorganic Chemistry.2025; 154: 108020. CrossRef - Identification of a cross-talk between EGFR and Wnt/beta-catenin signaling pathways in HepG2 liver cancer cells
Gurjinder Singh, Md Mehedi Hossain, Aadil Qadir Bhat, Mir Owais Ayaz, Nasima Bano, Rafiqa Eachkoti, Mohd Jamal Dar
Cellular Signalling.2021; 79: 109885. CrossRef - Blocking c-MET/ERBB1 Axis Prevents Brain Metastasis in ERBB2+ Breast Cancer
Shailendra K. Gautam, Ranjana K. Kanchan, Jawed A. Siddiqui, Shailendra K. Maurya, Sanchita Rauth, Naveenkumar Perumal, Pranita Atri, Ramakanth C. Venkata, Kavita Mallya, Sameer Mirza, Moorthy P. Ponnusamy, Vimla Band, Sidharth Mahapatra, Maneesh Jain, Su
Cancers.2020; 12(10): 2838. CrossRef - Evaluation of lapatinib cytotoxicity and genotoxicity on MDA-MB-231 breast cancer cell line
Mona A.M. Abo-Zeid, Mahmoud T. Abo-Elfadl, Amira M. Gamal-Eldeen
Environmental Toxicology and Pharmacology.2019; 71: 103207. CrossRef - Improved characterization of the relationship between long intergenic non‐coding RNA Linc00152 and the occurrence and development of malignancies
Jiasheng Xu, Jingjing Guo, Yangkai Jiang, Yujun Liu, Kaili Liao, Zhonghua Fu, Zhenfang Xiong
Cancer Medicine.2019; 8(10): 4722. CrossRef - Relationship between EGFR expression and subcellular localization with cancer development and clinical outcome
Ge Yan, Mohamed E.M. Saeed, Sebastian Foersch, Jose Schneider, Wilfried Roth, Thomas Efferth
Oncotarget.2019; 10(20): 1918. CrossRef - A novel matrine derivative WM622 inhibits hepatocellular carcinoma by inhibiting PI3K/AKT signaling pathways
Xiao Sun, Xiao-bin Zhuo, Yi-ping Hu, Xuan Zheng, Qing-jie Zhao
Molecular and Cellular Biochemistry.2018; 449(1-2): 47. CrossRef - lncRNA LINC00152 knockdown had effects to suppress biological activity of lung cancer via EGFR/PI3K/AKT pathway
Yan Zhang, Cheng Xiang, Yuling Wang, Yuanyuan Duan, Ci Liu, Yongli Jin, Yajing Zhang
Biomedicine & Pharmacotherapy.2017; 94: 644. CrossRef - Copy Number Profiling of MammaPrint™ Genes Reveals Association with the Prognosis of Breast Cancer Patients
Areej Fatima, Fomaz Tariq, Muhammad Faraz Arshad Malik, Muhammad Qasim, Farhan Haq
Journal of Breast Cancer.2017; 20(3): 246. CrossRef - Evaluation of serum epidermal growth factor receptor (EGFR) in correlation to circulating tumor cells in patients with metastatic breast cancer
Malgorzata Banys-Paluchowski, Isabell Witzel, Sabine Riethdorf, Brigitte Rack, Wolfgang Janni, Peter A. Fasching, Erich-Franz Solomayer, Bahriye Aktas, Sabine Kasimir-Bauer, Klaus Pantel, Tanja Fehm, Volkmar Müller
Scientific Reports.2017;[Epub] CrossRef - EGFR Is Regulated by TFAP2C in Luminal Breast Cancer and Is a Target for Vandetanib
James P. De Andrade, Jung M. Park, Vivian W. Gu, George W. Woodfield, Mikhail V. Kulak, Allison W. Lorenzen, Vincent T. Wu, Sarah E. Van Dorin, Philip M. Spanheimer, Ronald J. Weigel
Molecular Cancer Therapeutics.2016; 15(3): 503. CrossRef - Prognostic and predictive values of EGFR overexpression and EGFR copy number alteration in HER2-positive breast cancer
H J Lee, A N Seo, E J Kim, M H Jang, Y J Kim, J H Kim, S-W Kim, H S Ryu, I A Park, S-A Im, G Gong, K H Jung, H J Kim, S Y Park
British Journal of Cancer.2015; 112(1): 103. CrossRef - Epidermal growth factor receptor protein overexpression and gene amplification are associated with aggressive biological behaviors of esophageal squamous cell carcinoma
GANG LIN, XIAO-JIANG SUN, QIAN-BO HAN, ZHUN WANG, YA-PING XU, JIA-LEI GU, WEI WU, GU ZHANG, JIN-LIN HU, WEN-YONG SUN, WEI-MIN MAO
Oncology Letters.2015; 10(2): 901. CrossRef - Immunohistochemical Classification of Primary and Secondary Glioblastomas
Kyu Sang Lee, Gheeyoung Choe, Kyung Han Nam, An Na Seo, Sumi Yun, Kyung Ju Kim, Hwa Jin Cho, Sung Hye Park
Korean Journal of Pathology.2013; 47(6): 541. CrossRef - A Comparison of Tumor Biology in Primary Ductal CarcinomaIn SituRecurring as Invasive Carcinoma versus a NewIn Situ
Wenjing Zhou, Christine Johansson, Karin Jirström, Anita Ringberg, Carl Blomqvist, Rose-Marie Amini, Marie-Louise Fjallskog, Fredrik Wärnberg
International Journal of Breast Cancer.2013; 2013: 1. CrossRef
 PubReader
 ePub Link
-
 Cite this Article
- Cite this Article
-
- Close
- Download Citation
- Close
- Figure
-

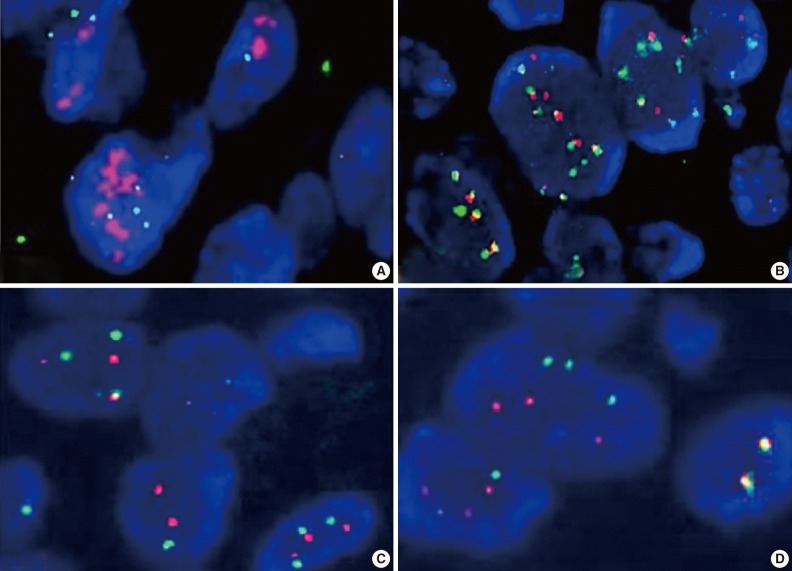
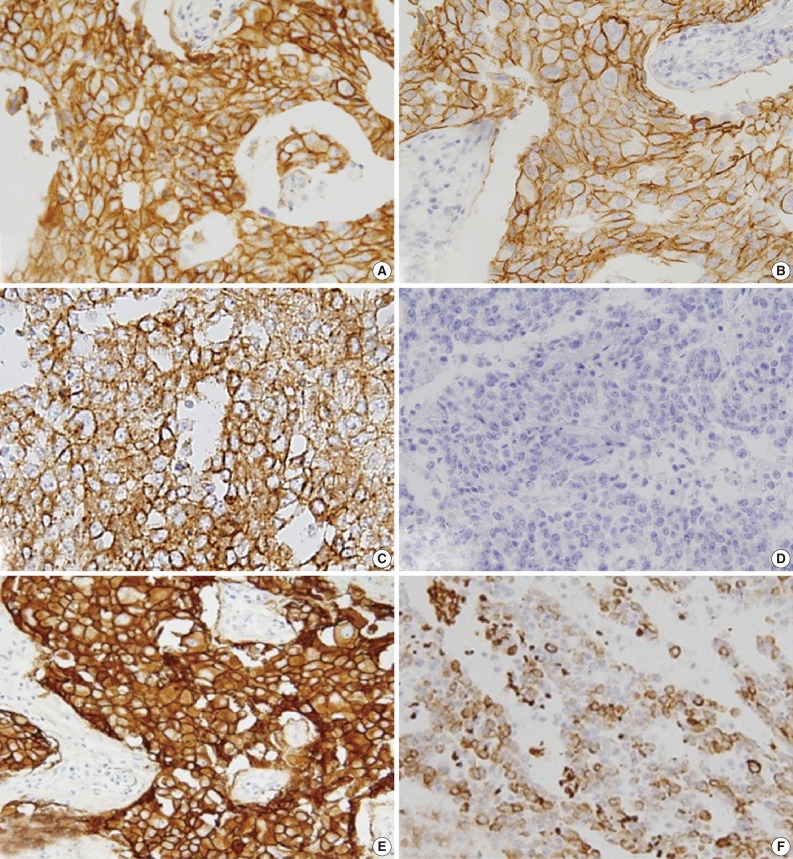
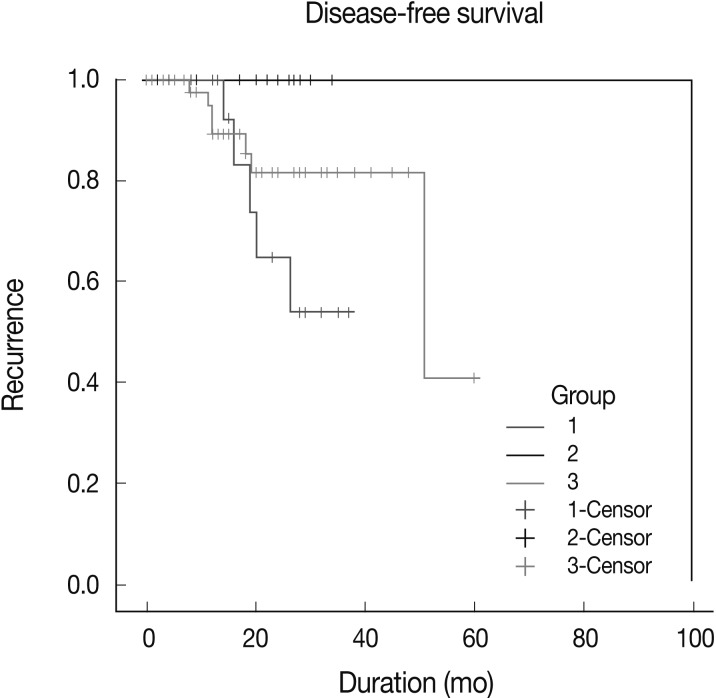


Fig. 1
Fig. 2
Fig. 3
Fig. 4
| Antibody | Type | Clone | Source | Dilution |
|---|---|---|---|---|
| ER | Monoclonal mouse | 1D5 | Dako, Glostrup, Denmark | 1:50 |
| PR | Monoclonal mouse | PgR 636 | Dako, Glostrup, Denmark | 1:50 |
| HER-2 | Monoclonal rabbit | SP3 | Thermo Scientific, Rockford, IL, USA | 1:100 |
| CK5/6 | Monoclonal mouse | D5/16B4 | Dako, Glostrup, Denmark | 1:50 |
| EGFR | Monoclonal mouse | E30 | Dako, Glostrup, Denmark | 1:100 |
| p53 | Monoclonal mouse | DO-7 | Novocastra, Newcast upon Tyne, UK | 1:50 |
| Ki-67 | Monoclonal mouse | MIB-1 | Dako, Glostrup, Denmark | 1:50 |
| Grade | Criteria |
|---|---|
| 0 | No staining or membranous staining in < 10% of the tumor cells |
| 1+ | Incomplete membrane staining in > 10% of the tumor cells |
| 2+ | Weak to moderate complete membrane staining in > 10% of the tumor cells |
| 3+ | Strong and complete membrane staining in > 10% of the tumor cells |
| Group 1 (HER-2+, CK5/6–, EFGR+) | Group 2 (HER-2–, CK5/6–, EGFR+) | Group 3 (HER-2–, CK5/6+, EGFR+) | Total | ||
|---|---|---|---|---|---|
| FISH+ | Amplification | 7 (41.2) | 1 (5.6) | 8 (17.0) | 16 (19.5) |
| High polysomy | 0 (0.0) | 1 (5.6) | 1 (2.1) | 2 (2.5) | |
| Subtotal | 7 (41.2) | 2 (11.2) | 9 (19.1) | 18 (22.0) | |
| FISH– | Disomy | 8 (47.0) | 10 (55.6) | 10 (21.3) | 28 (34.1) |
| Low trisomy | 2 (11.8) | 1 (5.6) | 14 (29.8) | 17 (20.7) | |
| High trisomy | 0 (0.0) | 1 (5.6) | 2 (4.3) | 3 (3.7) | |
| Low polysomy | 0 (0.0) | 4 (22.0) | 12 (25.5) | 16 (19.5) | |
| Subtotal | 10 (58.8) | 16 (88.8) | 38 (80.9) | 64 (78.0) | |
| Total | 17 | 18 | 47 | 82 |
| Protein 1+ | Protein 2+ | Protein 3+ | Total | ||
|---|---|---|---|---|---|
| FISH+ | Amplification | 1 (8.3) | 6 (13.6) | 9 (34.6) | 16 (19.5) |
| High polysomy | 0 (0.0) | 1 (2.3) | 1 (3.9) | 2 (2.5) | |
| Subtotal | 1 (8.3) | 7 (15.9) | 10 (38.5) | 18 (22.0) | |
| FISH– | Disomy | 3 (25.0) | 16(36.3) | 9 (34.6) | 28 (34.1) |
| Low trisomy | 5 (41.7) | 9 (20.5) | 3 (11.5) | 17 (20.7) | |
| High trisomy | 0 (0.0) | 3 (6.8) | 0 (0.0) | 3 (3.7) | |
| Low polysomy | 3 (25) | 9 (20.5) | 4 (15.4) | 16 (19.5) | |
| Subtotal | 11 (91.7) | 37 (84.1) | 16 (61.5) | 64 (78.0) | |
| Total | 12 | 44 | 26 | 82 |
| Parameters | Group 1 (HER-2+, CK5/6–, EFGR+) | Group 2 (HER-2–, CK5/6–, EGFR+) | Group 3 (HER-2–, CK5/6+, EGFR+) | Total | p-value |
|---|---|---|---|---|---|
| Age (yr) | |||||
| ≤ 50 | 6 (35) | 9 (50) | 26 (55) | 41 (50) | G1 vs G2: 0.380 |
| > 50 | 11 (65) | 9 (50) | 21 (45) | 41 (50) | G2 vs G3: 0.367 |
| Mean age (yr) | 53.0 | 52.4 | 48.1 | 50.4 | G1 vs G3: 0.157 |
| Tumor size (cm) | |||||
| ≤ 2 | 14 (82) | 7 (39) | 26 (55) | 47 (57) | G1 vs G2: 0.009 |
| > 2 | 3 (18) | 11 (61) | 21 (45) | 35 (43) | G2 vs G3: 0.031 |
| G1 vs G3: 0.048 | |||||
| Histologic grade | |||||
| 1 | 1 (6) | 1 (6) | 0 (0) | 2 (2) | G1 vs G2: 0.694 |
| 2 | 8 (47) | 6 (33) | 3 (6) | 17 (21) | G2 vs G3: 0.001 |
| 3 | 8 (47) | 11 (61) | 44 (94) | 63 (77) | G1 vs G3: 0.000 |
| LN metastasis | |||||
| Negative | 11 (65) | 16 (89) | 37 (79) | 64 (78) | G1 vs G2: 0.089 |
| Positive | 6 (35) | 2 (11) | 10 (21) | 18 (22) | G2 vs G3: 0.222 |
| G1 vs G3: 0.253 | |||||
| Ki-67 (%) | |||||
| ≤ 60 | 13 (76) | 5 (28) | 19 (40) | 37 (45) | G1 vs G2: 0.004 |
| > 60 | 4 (24) | 13 (72) | 28 (60) | 45 (55) | G2 vs G3: 0.009 |
| G1 vs G3: 0.011 | |||||
| p53 (%) | |||||
| ≤ 60 | 13 (76) | 11 (61) | 26 (55) | 50 (61) | G1 vs G2: 0.328 |
| > 60 | 4 (24) | 7 (39) | 21 (45) | 32 (39) | G2 vs G3: 0.309 |
| G1 vs G3: 0.126 |
| Treatment | Group 1 (HER-2+, CK5/6–, EFGR+) | Group 2 (HER-2–, CK5/6–, EGFR+) | Group 3 (HER-2–, CK5/6+, EGFR+) |
|---|---|---|---|
| Chemotherapy | 5 (1) | 4 (1) |
17 (3) |
| Herceptin therapy | 1 (1) | ||
| Radiotherapy | 1 | 2 | 4 (2) |
| Chemotherapy and Herceptin therapy | 2 (1) | ||
| Chemotherapy and radiotherapy | 1 | 9 (1) | 23 |
| Herceptin therapy and radiotherapy | 3 (2) | ||
| Radiotherapy and hormone therapy | 1 (1) | ||
| Chemotherapy, Herceptin therapy and radiotherapy | 3 | ||
| None | 2 (1) | 3 | 1 |
| Total | 17 (5) | 18 (2) |
47 (7) |
ER, estrogen receptor; PR, progesterone receptor; HER-2, human epidermal growth factor receptor; CK, cytokeratin; EGFR, epidermal growth factor receptor; p53, p53 protein; Ki-67, Ki-67 antigen.
EGFR, epidermal growth factor receptor.
Values are presented as number (%). EGFR, epidermal growth factor receptor; HER-2, human epidermal growth factor receptor; CK, cytokeratin; FISH, fluorescent
Values are presented as number (%). EGFR, epidermal growth factor receptor; FISH, fluorescent
Values are presented as number (%). HER-2, human epidermal growth factor receptor; CK, cytokeratin; EGFR, epidermal growth factor receptor; LN, lymph node.
Number in the parenthesis represents the recurrence. HER-2, human epidermal growth factor receptor; CK, cytokeratin; EGFR, epidermal growth factor receptor. Includes the dead patient.

